. 2021 Mar;19(3):615-630.
doi: 10.1111/pbi.13493. Epub 2020 Nov 20.

A high-quality Brassica napus genome reveals expansion of transposable elements, subgenome evolution and disease resistance

Affiliations

A high-quality Brassica napus genome reveals expansion of transposable elements, subgenome evolution and disease resistance

Xuequn Chen et al. Plant Biotechnol J. 2021 Mar.

Abstract

Rapeseed (Brassica napus L.) is a recent allotetraploid crop, which is well known for its high oil production. Here, we report a high-quality genome assembly of a typical semi-winter rapeseed cultivar, 'Zhongshuang11' (hereafter 'ZS11'), using a combination of single-molecule sequencing and chromosome conformation capture (Hi-C) techniques. Most of the high-confidence sequences (93.1%) were anchored to the individual chromosomes with a total of 19 centromeres identified, matching the exact chromosome count of B. napus. The repeat sequences in the A and C subgenomes in B. napus expanded significantly from 500 000 years ago, especially over the last 100 000 years. These young and recently amplified LTR-RTs showed dispersed chromosomal distribution but significantly preferentially clustered into centromeric regions. We exhaustively annotated the nucleotide-binding leucine-rich repeat (NLR) gene repertoire, yielding a total of 597 NLR genes in B. napus genome and 17.4% of which are paired (head-to-head arrangement). Based on the resequencing data of 991 B. napus accessions, we have identified 18 759 245 single nucleotide polymorphisms (SNPs) and detected a large number of genomic regions under selective sweep among the three major ecotype groups (winter, semi-winter and spring) in B. napus. We found 49 NLR genes and five NLR gene pairs colocated in selective sweep regions with different ecotypes, suggesting a rapid diversification of NLR genes during the domestication of B. napus. The high quality of our B. napus 'ZS11' genome assembly could serve as an important resource for the study of rapeseed genomics and reveal the genetic variations associated with important agronomic traits.

Keywords: Brassica napus; disease resistance; long-read sequencing; selective sweep; subgenome evolution.


Conflict of interest statement

The authors declared that they have no conflict of interest to this work.

Figures

Figure 1
Figure 1
Genome features of the B. napus ZS11_PB genome assembly. (a) Distribution along the assembled 19 chromosomes (A01 to A10, and C01 to C09), red triangle shows the inferred position of centromeres based on the centromeric repeats. (b) Gene density track. (c) GC content track (non‐overlapping windows of 100 Kb). (d and e) The density of gypsy and copia retrotransposon. (f and g) Level of gene expression in buds and roots.
Figure 2
Figure 2
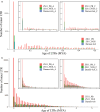
The number of intact LTR‐RTs with different insertion age in B. napus genomes. (a) The number of intact LTR‐RTs from 0 to 500 000 years ago. (b) 0–5 million years ago (MYA).
Figure 3
Figure 3
Comparative analysis between different genomes. (a) MUMmerplot comparison of the allopolyploid (y‐axis) and their diploid parents (x‐axis). Chromosome order on the x‐ and y‐axis was both ordered from A01 to A10, and C01 to C09. Blue points indicate likely chromosomal inversions and breakage. (b and c) Macrosynteny (upper) and microsynteny (bottom) plots between allopolyploid and B. oleracea on the chromosome C02. The bottom half was a randomly selected region for illustration purpose. Grey wedges connecting the chromosomes represent the synteny blocks. Blue and green boxes represent for different genes, with plus or minus orientations, respectively. (d) Macrosynteny (middle) and microsynteny (upper and bottom) between ZS11 and their diploid parents B. oleracea on the chromosome C09. The red connecting wedges represent the synteny blocks between ZS11_PB and B. oleracea, which was misassembled in ZS11_NGS. The red lines represent a selected set of functionally important genes (Table S15).
Figure 4
Figure 4
Maximum‐likelihood phylogenetic trees of ‘sensor–executor’ paired NLR genes identified in ZS11_PB genome. Paired NLR genes (two NLR genes shared an upstream region in opposite directions (van Wersch and Li, 2019)) in the same subclade are linked by the same colour. The paired NLR genes in ZS11_PB were marked with 'Paired', and the sensor–executor paired NLR genes in A. thaliana were identified in (Van de Weyer et al., 2019). The symbols '+' and '‐' represent the plus or minus orientations of the NLR genes.
Figure 5
Figure 5
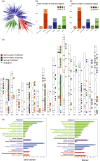
Phylogenetic relationships and the selective signal between different B. napus ecotypes. (a) A maximum‐likelihood (ML) tree. Blue, green and red represent winter, spring and semi‐winter ecotypes, respectively. The black arrow indicates the phylogenetic position of ZS11_PB. (b‐c) The total number of selective sweep regions (b) and genes (c) in different ecotypes. Orange, blue and green mean the comparative within semi‐winter VS winter, semi‐winter VS spring and spring VS winter. The light and dark colours represent the distribution in A and C subgenomes, respectively. (d) Distribution of NLR genes and selective sweeps between different B. napus ecotypes. Orange, blue and green mean the comparative within semi‐winter VS winter, semi‐winter VS spring and spring VS winter. (e) KEGG pathway annotation in the selected regions between semi‐winter and winter ecotype groups. The black labels on the y‐axis represent KEGG B class, the coloured label represents the specific pathway under the class, and the x‐axis shows the number of genes in a given KEGG pathway (Table S21).
Figure 6
Figure 6
Disease resistance genes within the selected regions between semi‐winter and winter ecotypes in B. napus. (a) The FST distribution and density of π ratio (semi‐winter/winter) between semi‐winter and winter ecotype groups. The upper part represents the distribution of FST in each chromosome, and the top 5% of FST values drawn in black dotted line. The lower part represents the distribution of the π ratio, and blue and yellow mean the selective sweep region in semi‐winter and winter ecotypes, respectively. All the NLR genes were labelled. The combination of extremal values of FST and π together defines ‘selective sweeps’ in this study. (b‐d) FST and π ratio on the chromosome C02 (b), A08 (c) and A09 (d). The black dotted line represents the top 5% of π ratio and FST values. The grey interval represents the selected region that overlaps with the identified QTL regions. The blue point indicates the locations of the predicted NLR genes, and red point indicates the locations of the new annotated NLR gene. (b) C02, none of the NLR genes overlapped with the identified resistance QTL regions. (c‐d) A08, A09, all the NLR genes were located on the identified resistance QTL regions.

Similar articles

Cited by

References

    1. Abrusan, G. , Grundmann, N. , DeMester, L. and Makalowski, W. (2009) TEclass–a tool for automated classification of unknown eukaryotic transposable elements. Bioinformatics, 25, 1329–1330. - PubMed
    1. Akdemir, K.C. and Chin, L. (2015) HiCPlotter integrates genomic data with interaction matrices. Genome Biol. 16, 198. - PMC - PubMed
    1. Bayer, P.E. , Edwards, D. and Batley, J. (2018) Bias in resistance gene prediction due to repeat masking. Nat Plants, 4, 762–765. - PubMed
    1. Bayer, P.E. , Hurgobin, B. , Golicz, A.A. , Chan, C.K.K. , Yuan, Y.X. , Lee, H. , Renton, M. et al. (2017) Assembly and comparison of two closely related Brassica napus genomes. Plant Biotechnol. J. 15, 1602–1610. - PMC - PubMed
    1. Bennetzen, J.L. and Wang, H. (2014) The contributions of transposable elements to the structure, function, and evolution of plant genomes. Annu. Rev. Plant Biol. 65, 505–530. - PubMed

Publication types

Substances

LinkOut - more resources