

Zika virus depletes neural stem cells and evades selective autophagy by suppressing the Fanconi anemia protein FANCC
- PMID: 33073500
- PMCID: PMC7726779
- DOI: 10.15252/embr.201949183
Zika virus depletes neural stem cells and evades selective autophagy by suppressing the Fanconi anemia protein FANCC
Abstract
Zika virus (ZIKV) is an emerging flavivirus, which when passed through vertical transmission from mother to developing fetus can lead to developmental abnormalities, including microcephaly. While there is mounting evidence that suggests a causal relationship between ZIKV infection and microcephaly, the mechanisms by which ZIKV induces these changes remain to be elucidated. Here, we demonstrate that ZIKV infection of neural stems cells, both in vitro and in vivo, induces macroautophagy to enhance viral replication. At the same time, ZIKV downregulates a number of essential selective autophagy genes, including the Fanconi anemia (FA) pathway genes. Bioinformatics analyses indicate that the transcription factor E2F4 promotes FANCC expression and is downregulated upon ZIKV infection. Gain and loss of function assays indicate that FANCC is essential for selective autophagy and acts as a negative regulator of ZIKV replication. Finally, we show that Fancc KO mice have increased ZIKV infection and autophagy protein levels in various brain regions. Taken together, ZIKV downregulates FANCC to modulate the host antiviral response and simultaneously attenuate neuronal growth.
Keywords: Fanconi anemia protein C; ZIKA virus replication; neural stem cells; selective autophagy; transcription factor E2F4.
© 2020 The Authors. Published under the terms of the CC BY NC ND 4.0 license.
Conflict of interest statement
T.M.R. is a founder of ViRx Pharmaceuticals and has an equity interest in the company. The terms of this arrangement have been reviewed and approved by the University of California San Diego in accordance with its conflict of interest policies.
Figures
- A, B
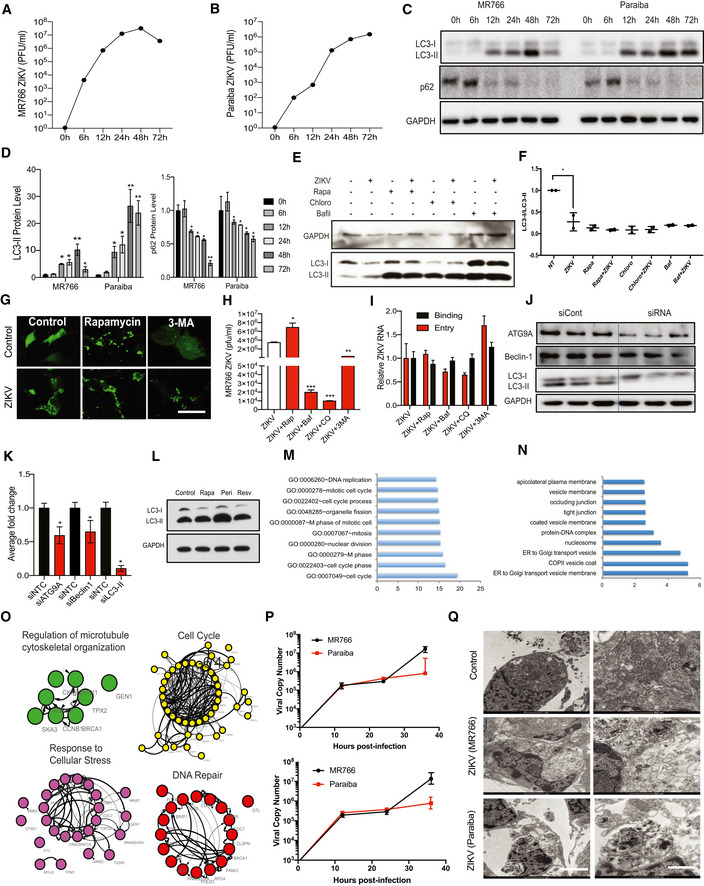
Infection of human NSCs and plaque‐forming units for both ZIKV strain (MR766 and Paraiba) at different time points during infection.
- C
Western blot of autophagy proteins LC3 and P62 at various times after infection of primary mouse NSCs with strains MR766 or Paraiba.
- C
Densitometric quantification of the blot shown in Fig 1C expressed as the ratio of LC3‐II/Gapdh and p62/Gapdh, mean ± SEM of n = 3 biological replicates, *P < 0.05, **P < 0.005, by Student's t test.
- D
Western blot of LC3‐I/LC3‐II expression in control or ZIKV‐infected NSC treated with or without 100 nM rapamycin, 10 nM bafilomycin A1, or 20 μM chloroquine for 24 h.
- E
Quantification of the LC3-I/LC3-II ratio from the Western blot shown in (E). Data are presented as the mean ± SEM of two biological replicates. *P < 0.05 by Student's t test
- F
Fluorescence images of GFP‐LC3 in NSCs 24 h after mock or ZIKV infection (MR766, MOI 0.2). Cells were incubated with or without 100 nM rapamycin or 5 mM 3‐methyladenine. Scale bar = 50 μm.
- G
Infection of hNSCs and plaque‐forming units for ZIKV treated with autophagy activator (rapamycin) and inhibitors (Baf, CQ and 3‐MA). Mean ± SEM of three biological triplicates. *P < 0.05, **P < 0.01, ***P < 0.001 by Student's t test.
- H
RT‐qPCR showing binding and entry of ZIKV in the presence of rapamycin, baf, CQ, and 3‐MA. Mean ± SEM of n = 3 biological replicates, ns by Student's t test.
- I
Western blot analysis showing siRNA‐mediated knockdown of autophagy proteins ATG9A, Beclin, and LC3‐II.
- J
Densitometric analysis of KD proteins, mean ± SEM of n = 3 biological replicates. *P < 0.05 by Student's t test.
- K
Western blot analysis of LC3‐I and LC3‐II expression in HeLa cells treated for 4 h with the autophagy inducers perifosine (50 μM), rapamycin (50 nM), and resveratrol (100 μM).
- M, N
GO analysis of biological processes (M) and cellular localization (N) enriched among the 83 genes commonly downregulated by all three autophagy activators (HeLa cells) and ZIKV infection (hNSCs). Bars represent −log10 P values.
- O
String analysis of enriched pathways common to both autophagy‐induced HeLa cells and ZIKV‐infected hNSCs. Edge (line) thickness is proportional to the combined network score, with thicker edges representing stronger evidence for protein interaction.
- N
RT–qPCR analysis of ZIKV copy number in mNSCs (upper graph) and hNSC (lower graph) at 12, 24, and 36 h post‐infection with MR766 (MOI 0.2) and Paraiba (MOI 2) ZIKV. Data are presented as the mean ± SEM of n = 3.
- O
Mock‐infected mNSCs (top row) showing normal morphology of mitochondria, ER, and other cellular organelles. MR766 strain ZIKV‐infected mNSCs (middle row) showing many vacuole‐like structures, disrupted ER membrane (ER), and localization of viral particles (ZV) to membrane‐bound organelles. Paraiba strain ZIKV‐infected mNSCs (bottom row) showing many double‐membrane‐bound autophagosome‐like structures and aberrant mitochondria and ER. Scale bars 1 μm (left) and 500 nm (middle and right).
- A
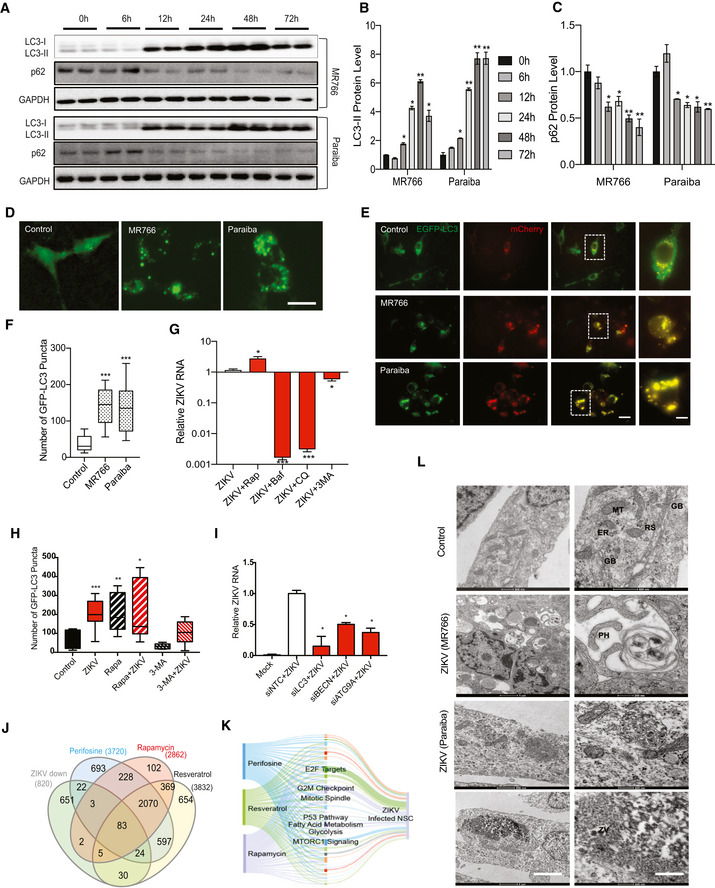
Western blot of autophagy proteins LC3 and p62 at various time points after infection of human NSCs with strains MR766 or Paraiba.
- B, C
Quantitative representation of LC3‐II and p62 protein levels during ZIKV infection at indicated time points. Mean ± SEM, n = 3 biological replicates.
- D
GFP‐LC3 puncta of mock‐ and ZIKV‐infected hNSCs. Scale bar = 100 μm.
- D
Tandem EGFP‐LC3 and mCherry punctae co‐localization in control and ZIKV‐infected hNSC. Scale bar = 100 μm, boxed magnified images with scale bar = 50 μm.
- E
Number of GFP‐LC3 puncta in MR766 and Paraiba‐infected hNSCs, n = > 50 cells. Box plots show the mean and the smallest; largest values in whiskers represent the 10th and 90th percentiles in 50 randomly selected cells per group; and solid horizontal line indicates median. ***P < 0.001 by Student's t test.
- F
RT–qPCR of ZIKV RNA in hNSCs incubated with vehicle or 100 nM rapamycin, 20 μM chloroquine, 10 nM bafilomycin A1, or 5 mM 3‐methyladenine for 24 h. Mean ± SEM of three biological replicates. *P < 0.05, ***P < 0.001 by Student's t test.
- G
GFP‐LC3 puncta in ZIKV with or without rapamycin and 3‐MA treated hNSC cells. Cells were treated with or without rapamycin (100 nM) or 3‐methyladenine (5 μM). Box plots show the mean and the smallest; largest values in whiskers represent the 10th and 90th percentiles in 50 randomly selected cells per group; and solid horizontal line indicates median. *P < 0.05, **P < 0.01, ***P < 0.001 by Student's t test.
- H
RT–qPCR of ZIKV RNA in infected hNSCs transfected with siRNAs targeting LC3, BECN or ATG9A 48 h post‐infection. Mean ± SEM of three biological replicates. *P < 0.05 by Student's t test.
- I
Venn diagram of genes significantly downregulated in HeLa cells treated for 4 h with perifosine (50 μM), rapamycin (50 nM), and resveratrol (100 μM), compared with ZIKV‐infected hNSCs (ZIKV data from Tang et al, 2016).
- J
Sankey diagram of pathways associated with genes commonly enriched in ZIKV‐infected hNSCs and perifosine‐, resveratrol‐, and rapamycin‐treated HeLa cells. The width of each band is proportional to the number of genes in the group/pathway.
- K
Transmission electron microscopy of hNSCs infected by ZIKV MR766 and Paraiba strains. Mitochondria (MT), endoplasmic reticulum (ER), Golgi bodies (GB), ribosomes (RS), phagophores (PH), and lipid droplet (LD). Scale bars, first row, 1 μm (left), 500 nm (control right); 200 nm (right).
- A–D
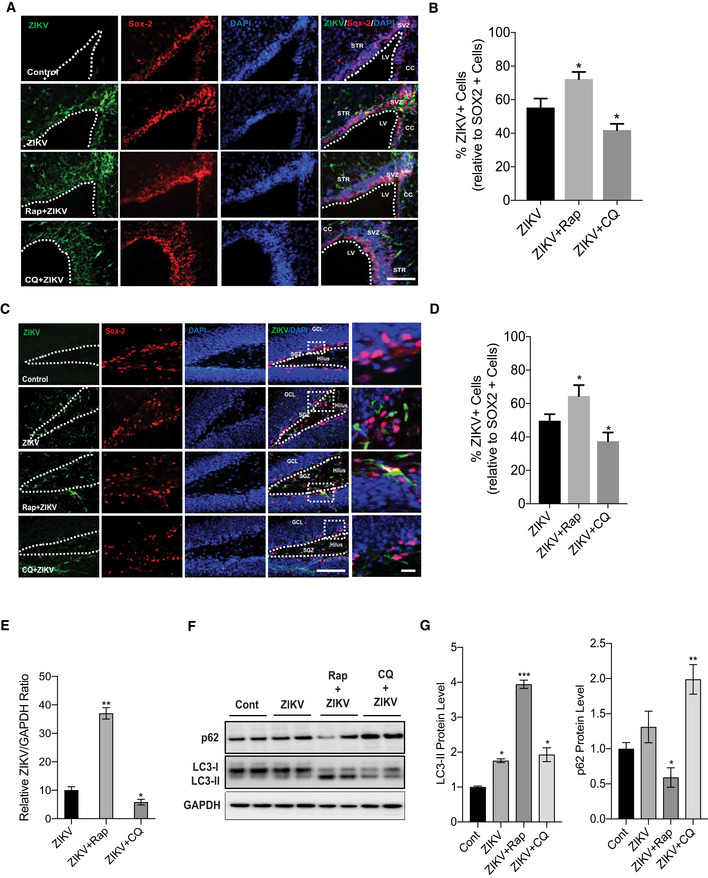
Immunostaining and quantification of neural progenitor marker SOX2 (red) and ZIKV envelope flavivirus group antigen (ZIKVE, green) in the SVZ (A, B) and hippocampus (C, D) of uninfected or ZIKV Paraiba‐infected wild‐type mice treated with vehicle, rapamycin, or chloroquine at 6 days post‐infection. n = 10 sections/group, mean ± SEM, *P < 0.05, **P < 0.001. Nuclei were stained with DAPI (blue). Right‐most column shows enlargements of the boxed regions. CC, cortical cortex; GCL, granular cell layer; LV, lateral ventricle; SGZ, subgranular zone; STR, striatum; SVZ, subventricular zone.
- E
RT‐qPCR for ZIKV RNA expression in brain, mean ± SEM, n = 3 biological replicates, *P < 0.05, **P < 0.001 by Student's t test.
- F, G
Western blot for autophagy protein LC3‐II, p62, and quantification normalized with GAPDH, mean ± SEM, n = 3 biological replicates, *P < 0.05, and **P < 0.001 by Student's t test.
- A
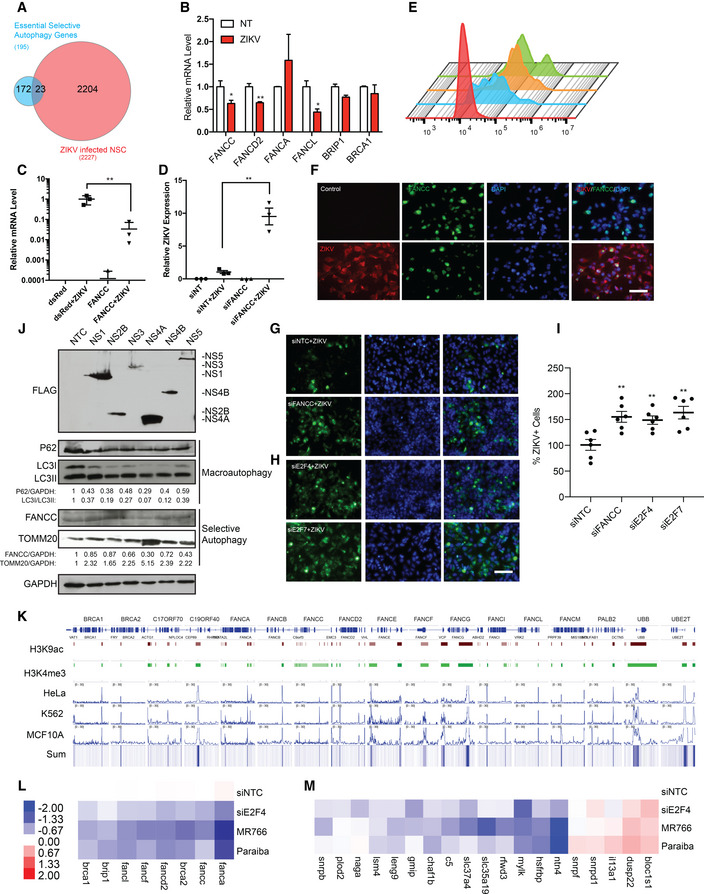
Venn diagram showing overlap between virophagy‐related genes in HeLa cells (Orvedahl et al, 2011) and ZIKV‐infected hNSCs (Tang et al, 2016).
- B
RT–qPCR analysis of FA pathway genes at 48 h after ZIKV infection of hNSCs. Mean ± SEM of biological triplicates. *P < 0.05, **P < 0.01 by Student's t test.
- C, D
RT–qPCR analysis of ZIKV mRNA 48 h after ZIKV infection of HeLa cells overexpressing FANCC (C) or FANCC‐specific siRNA (D). Mean ± SEM of biological triplicates. **P < 0.01 by Student's t test.
- E
Flow cytometry analysis of ZIKVE expression in mock‐infected (red), ZIKV‐infected (blue), ZIKV‐infected siFANCC‐transfected (orange), and ZIKV‐infected siE2F4‐transfected (green) hNSCs at 48 h post‐infection.
- E
ZIKV NS1 and FANCC immunostaining 48 h after ZIKV infection of hNSCs. Scale bar = 100 μm.
- F
ZIKV NS1 expression 48 h after ZIKV infection of hNSCs expressing control siRNA (NTC) or siFANCC‐targeting siRNA. Scale bar = 100 μm.
- H, I
ZIKV NS1 expression 48 h after ZIKV infection of hNSCs expressing control (NTC) or siE2F4‐targeting siRNA. Mean ± SEM of six imaging fields of biological triplicates, **P < 0.01 by Student's t test, Scale bar = 100 μm.
- J
Immunoblot of macroautophagy (p62, LC3I/LC3II) and selective autophagy (FANCC, TOMM20) proteins 24 h after overexpression of FLAG‐tagged ZIKV NS1, NS2B, NS3, NS4A, NS4B, and NS5 in 293FT cells.
- I
Analysis of E2F4 ChIP‐seq datasets (Encode) showing direct chromatin‐binding interaction between E2F4 and FA pathway genes in HeLa (GEO: GSM935365, Farnham lab), K562 (GEO: GSM935600, Farnham lab), and MCF10A (GEO: GSM: 935400, Struhl lab) cell lines. H3K9ac and H3K4me3 datasets identify promoter regions. The genomic region is displayed in log scale with the scale range identified in each panel (0–30). The summed interaction (Sum) across all three cell types is represented as a heatmap.
- L, M
Heatmaps of RT–qPCR analysis of FA pathway genes (K) or essential selective autophagy genes (L) in hNSCs 48 h after transfection with control (NTC) or E2F4‐targeting siRNAs or after infection with ZIKV MR766 and Paraiba strains. Color patterns in heatmap indicate as red showing the highest expression and blue showing the lowest expression of genes.
- A
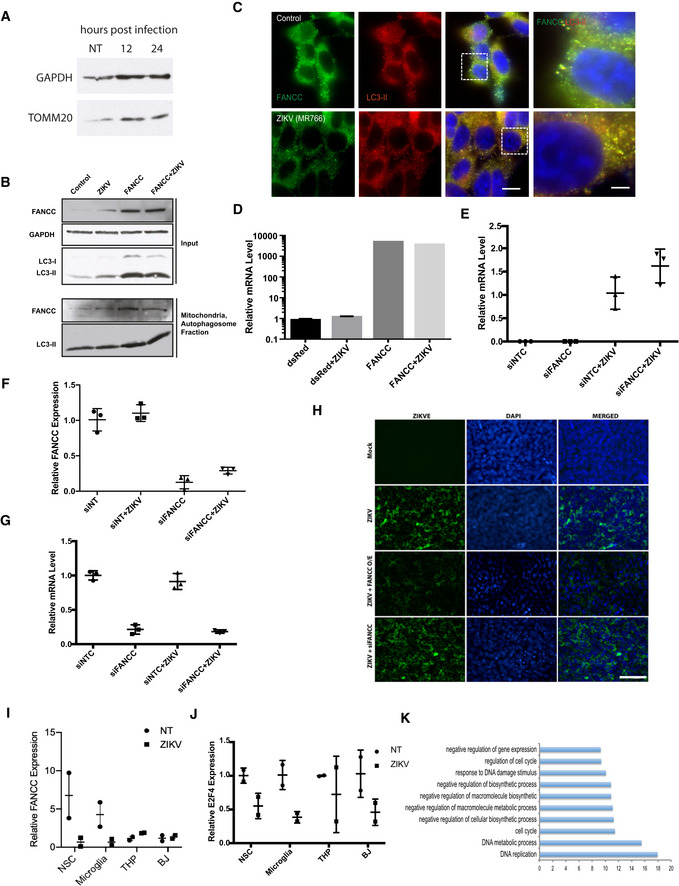
Western blot analysis of TOMM20 in ZIKV‐infected cells at 12 and 24 h post‐infection.
- B
Western blot analysis of LC3‐I, LC3‐II, and FANCC expression in mock‐ or ZIKV‐infected HeLa cells expressing a control plasmid or a FANCC overexpression plasmid. Upper panel shows whole cell lysates, and lower panels show subcellular fractions enriched in mitochondria and autophagosomes.
- C
Confocal immunofluorescence images showing co‐labeling of FANCC with LC3‐II antibody in hNSC infected with ZIKV (MR766) and control group. Scale bar = 100 μm, boxed magnified images with scale bar = 50 μm.
- D, E
RT–qPCR analysis of relative expression of FANCC genes in control or ZIKV‐infected HeLa cells expressing control plasmid or FANCC overexpression plasmid FANCC (D), or control (NT) or FANCC‐specific siRNAs (E). Cells were analyzed at 48 h post‐infection. Data are presented as the mean ± SEM of biological triplicates.
- F, G
RT–qPCR analysis of ZIKV (F) and FANCC (G) gene expression in mock‐ or ZIKV‐infected HeLa cells expressing control (NTC) or FANCC‐specific siRNA. Cells were analyzed 24 h post‐infection. Data are presented as the mean ± SEM of n = 3 biological replicates.
- H
Immunofluorescence images of ZIKVE expression in ZIKV‐infected (MR766, MOI 0.2) HeLa cells after FANCC knockdown (siFANCC) or overexpression (O/E). Cells were stained at 48 h after ZIKV infection. Scale bar = 100 μm.
- I, J
Relative mRNA expression of FANCC and E2F4 in mNSC, human microglial, macrophage/monocyte (THP‐1), and fibroblast (BJ) cell lines at 36 h after ZIKV infection. Mean of biological duplicates.
- K
Gene ontology analysis of predicted E2F4 target genes downregulated by ZIKV infection. Bars represent −log10 P value.
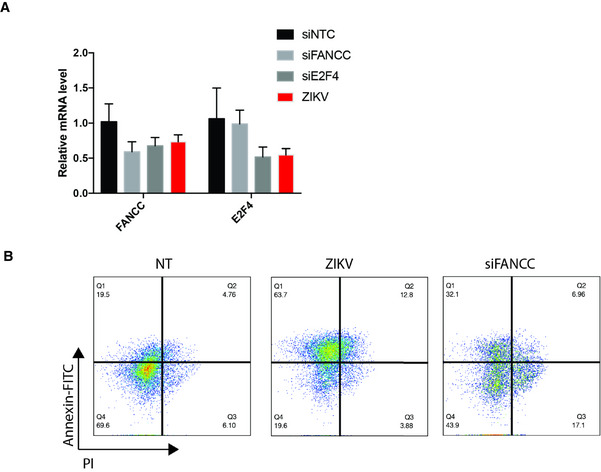
RT–qPCR analysis of FANCC and E2F4 expression in hNSCs expressing control (NTC), FANCC‐specific, or E2F4‐specific siRNAs, or infected with ZIKV 48 h post‐treatment. Data are presented as the mean ± SEM of biological triplicates.
Flow cytometric analysis of annexin V and PI staining of hNSCs at 48 h after mock (left), ZIKV infection (middle), or siFANCC transfection (right). Q1, early apoptotic cells (annexin+/PI−); Q2, late apoptotic cells (annexin+/PI+); Q3, necrotic cells (annexin−/PI+); Q4, healthy cells (annexin−/PI−).
- A
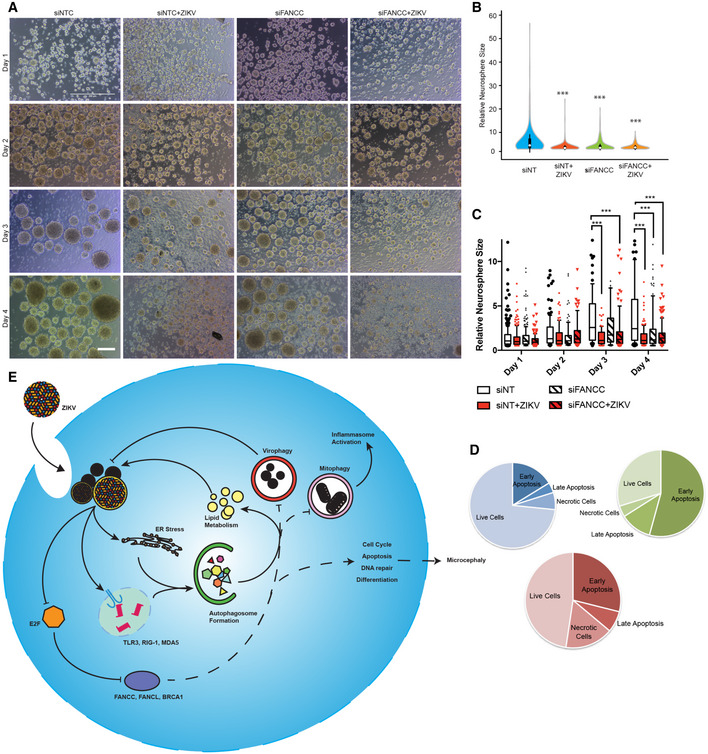
Representative images of mock‐ or ZIKV‐infected human neurospheres expressing control (NTC) or FANCC‐targeting siRNAs at 1–4 days post‐infection. Scale bar = 250 μm.
- B, C
Violin plot (B) and box plot (C) of relative size of neurospheres treated as described in (A) and measured on day 4 (B) or days 1–4 (C). Box plots show the mean and the smallest; largest values in whiskers represent the 10th and 90th percentiles in 50 randomly selected cells per group; and solid horizontal line indicates median. ***P < 0.001 by Student's t test.
- D
Pie chart displaying the percentage of early apoptotic, late apoptotic, or necrotic hNSCs at 48 h after mock infection (blue), ZIKV infection (green), or siFANCC transfection (red).
- D
Model of the effects of ZIKV infection on ER stress, autophagy induction, and FA gene expression leading to impaired virophagy and mitophagy.
- A, B
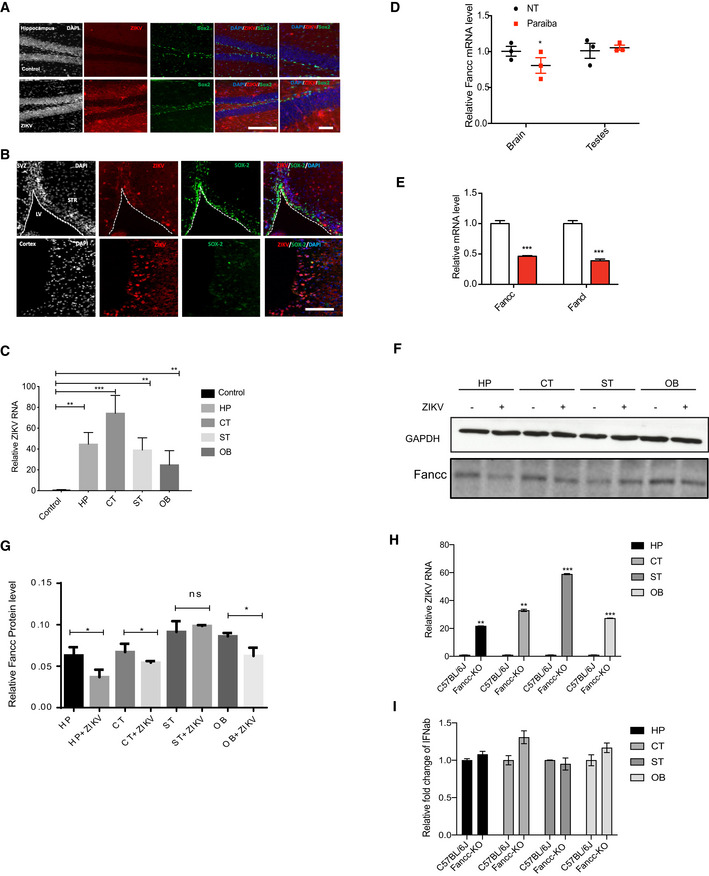
Immunostaining of neural progenitor marker SOX2 (green) and ZIKV envelope flavivirus group antigen (ZIKVE, red) in the hippocampus (A) and SVZ (B) of uninfected or ZIKV Paraiba‐infected Ifnar −/− mice 6 days post‐infection. Nuclei were stained with DAPI (gray). Right‐most column in (A) shows enlargements of the regions. CC, cortical cortex; GCL, granular cell layer; LV, lateral ventricle; SGZ, subgranular zone; STR, striatum; SVZ, subventricular zone. Scale bars, 100 μm.
- C
RT–qPCR analysis of relative ZIKV RNA in different brain regions of Ifnar −/− mice. Mean ± SEM of n = 3 biological replicates, **P < 0.005, ***P < 0.001 by Student's t test.
- C
RT–qPCR analysis of relative Fancc mRNA levels from whole brains or testes in mock‐ and ZIKV Paraiba‐infected Ifnar −/− mice 6 days post‐infection. Mean ± SEM of n = 3 biological replicates, *P < 0.05 and ns by Student's t test.
- D
RT–qPCR analysis of relative Fancc or Fancl mRNA levels from whole brains from mock‐ and ZIKV Paraiba‐infected Ifnar −/− newborn mice. Mean ± SEM of n = 3 biological replicates, ***P < 0.001 by Student's t test.
- E
Western blot analysis of Fancc protein in brain regions from mock‐ and ZIKV Paraiba‐infected Ifnar −/− mice 6 days post‐infection. CT, cortex; HP, hippocampus; OB, Olfactory Bulb; ST, striatum.
- F
Bar graph showing the quantification of Fancc proteins, mean ± SEM of n = 3 biological replicates, *P < 0.05 and ns by Student's t test.
- G
RT–qPCR analysis of relative ZIKV RNA in different brain regions of Fancc KO neonatal mice 6 days post‐infection. Mean ± SEM of n = 3 biological replicates, **P < 0.005, ***P < 0.001 by Student's t test.
- H
RT–qPCR for Ifnab gene expression in wild type and Fancc KO mice. Mean ± SEM of n = 3 biological replicates, ns by Student's t test.
- A
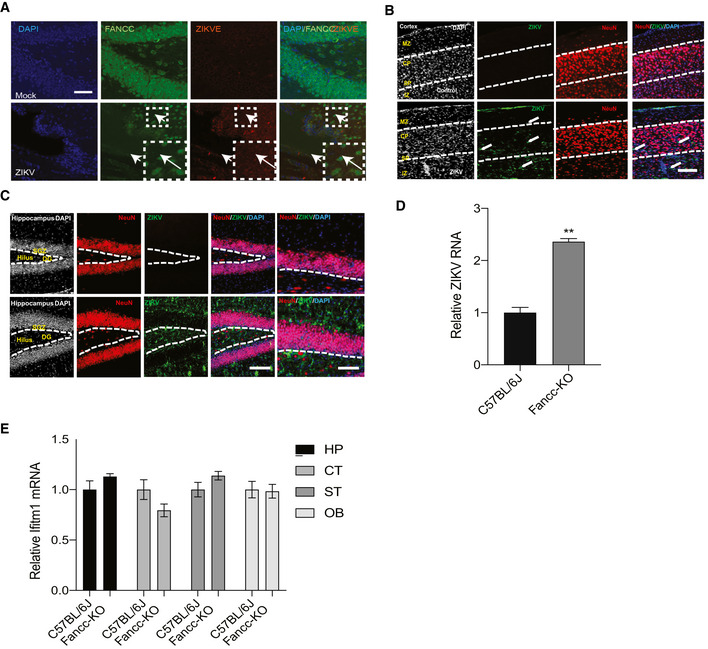
Immunoreactivity of Fancc (green) with ZIKVE (red) in control and ZIKV‐infected hippocampus brain region. Arrows represent reduction in Fancc immunoreactivity in ZIKV‐infected cells, Scale bar = 50 μm.
- B, C
Immunostaining of mature neuronal marker NeuN (red) and ZIKV envelope flavivirus group antigen (ZIKVE, green) in the cortex (A), hippocampus (B) of uninfected or ZIKV Paraiba‐infected Ifnar −/− mice 6 days post‐infection. Nuclei were stained with DAPI (gray). DG, dentate gyrus; GCL, granular cell layer; InGr, internal granular layer; SGZ, subgranular zone. Scale bars are as indicated on image.
- D
RT‐qPCR for ZIKV RNA expression in wild‐type and Fancc KO mice brain infected with ZIKV. Mean ± SEM, n = 3 biological replicates, **P < 0.001 by Student's t test.
- D
RT‐qPCR for Ifitm1 mRNA expression in wild type and Fancc KO mice brain. Mean ± SEM, n = 3 biological replicates, ns by Student's t test.
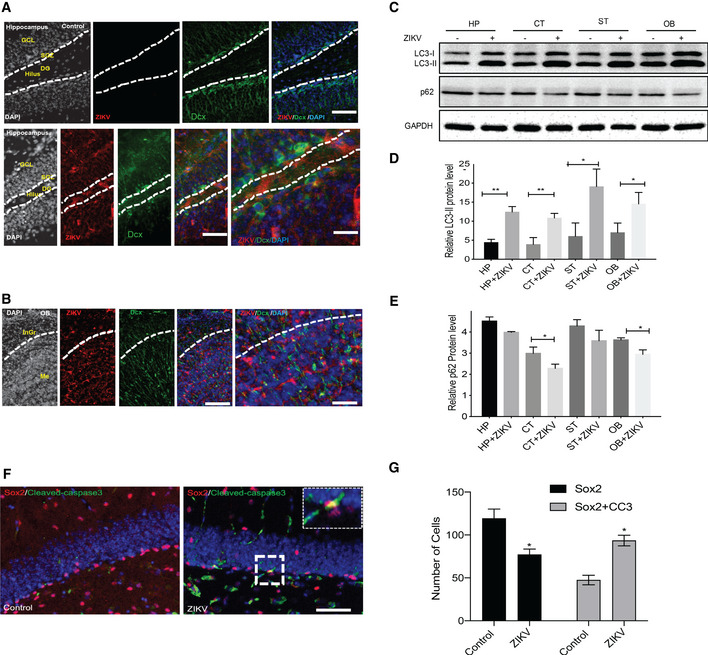
- A, B
Immunostaining of immature neuronal marker DCX (green) and ZIKV envelope (ZIKVE, red) in the hippocampus and olfactory bulb of uninfected or ZIKV Paraiba‐infected Ifnar −/− mice 6 days post‐infection. Nuclei were stained with DAPI (gray). Bottom row shows enlargements of the hippocampus region. DG, dentate gyrus; GCL, granular cell layer; InGr, internal granular layer; Me, medulla; OB, olfactory bulb; SGZ, subgranular zone. Scale bars, 50 and 100 μm.
- C–E
Western blot of autophagy protein LC3 and p62 in different brain region of Fancc KO neonatal mice 6 days post‐infection of ZIKV (MR766). Mean ± SEM of n = 3 biological replicates, *P < 0.05, **P < 0.005, by Student's t test. CT, cortex; HP, hippocampus; OB, Olfactory Bulb; ST, striatum.
- F
Representative immunofluorescent images showing immunoreactivity of neural progenitor marker (Sox2) with apoptosis marker (Cleaved‐caspase‐3, CC3) in hippocampus region of Fancc KO mice. Scale bar = 50 μm.
- D
Quantitative analysis of number of Sox2+ cells and Sox2/CC3+ co‐labeled cells in Fancc KO mice hippocampal brain region. Mean ± SEM, n = 3 biological replicates, *P < 0.05 by Student's t test.
References
-
- Agarwal S, Tiwari SK, Seth B, Yadav A, Singh A, Mudawal A, Chauhan LK, Gupta SK, Choubey V, Tripathi A et al (2015) Activation of autophagic flux against xenoestrogen bisphenol‐A‐induced hippocampal neurodegeneration via AMP kinase (AMPK)/mammalian target of rapamycin (mTOR) pathways. J Biol Chem 290: 21163–21184 - PMC - PubMed
-
- Bogliolo M, Surralles J (2015) Fanconi anemia: a model disease for studies on human genetics and advanced therapeutics. Curr Opin Genet Dev 33: 32–40 - PubMed
Publication types
MeSH terms
Substances
Grants and funding
LinkOut - more resources
Full Text Sources
Medical
Molecular Biology Databases
Research Materials
