

Mechanistic Modeling of Intra-Tumor Spatial Distribution of Antibody-Drug Conjugates: Insights into Dosing Strategies in Oncology
- PMID: 33073529
- PMCID: PMC7877868
- DOI: 10.1111/cts.12892
Mechanistic Modeling of Intra-Tumor Spatial Distribution of Antibody-Drug Conjugates: Insights into Dosing Strategies in Oncology
Abstract
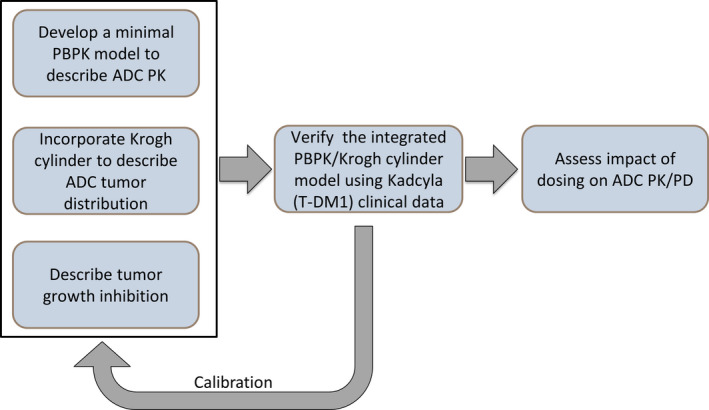
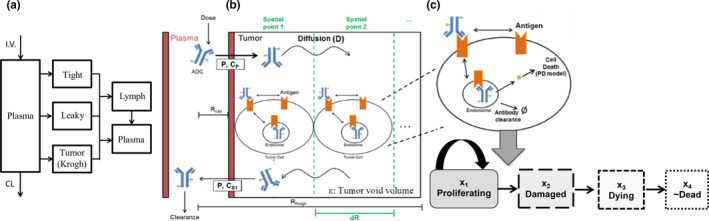
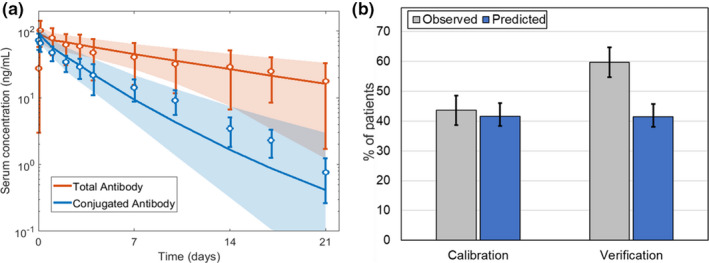
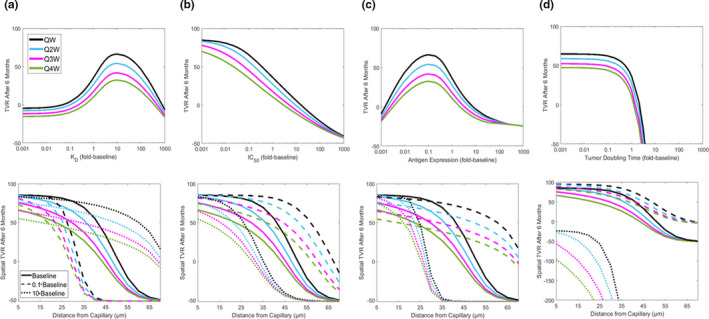
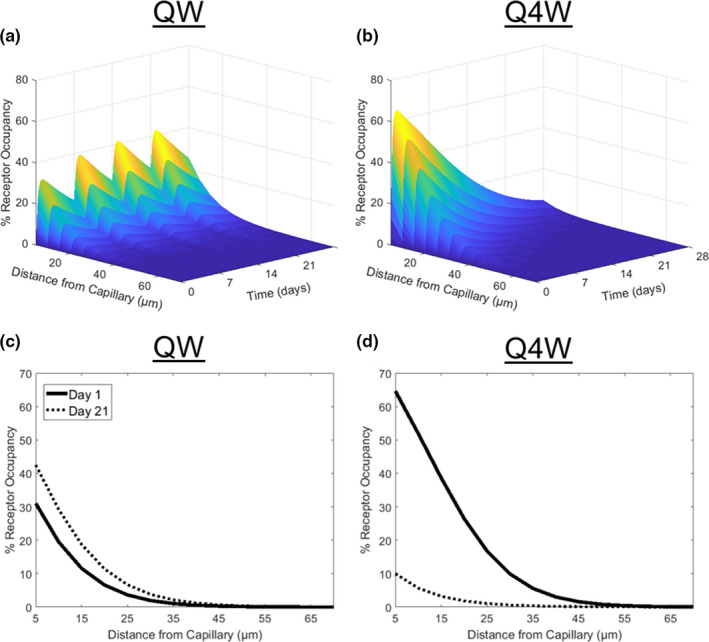
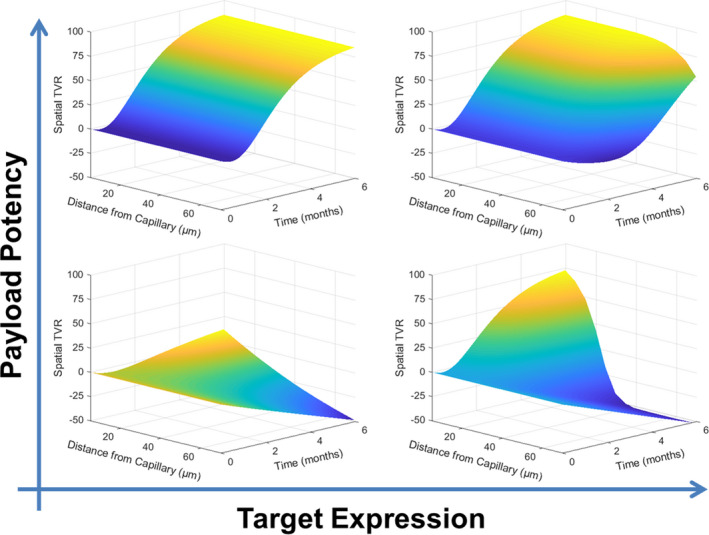
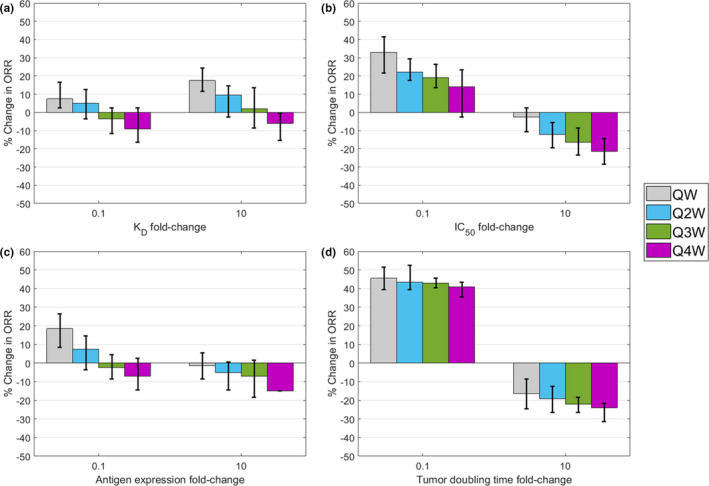
Antibody drug conjugates (ADCs) provide targeted delivery of cytotoxic agents directly inside tumor cells. However, many ADCs targeting solid tumors have exhibited limited clinical efficacy, in part, due to insufficient penetration within tumors. To better understand the relationship between ADC tumor penetration and efficacy, previously applied Krogh cylinder models that explore tumor growth dynamics following ADC administration in preclinical species were expanded to a clinical framework by integrating clinical pharmacokinetics, tumor penetration, and tumor growth inhibition. The objective of this framework is to link ADC tumor penetration and distribution to clinical efficacy. The model was validated by comparing virtual patient population simulations to observed overall response rates from trastuzumab-DM1 treated patients with metastatic breast cancer. To capture clinical outcomes, we expanded upon previous Krogh cylinder models to include the additional mechanism of heterogeneous tumor growth inhibition spatially across the tumor. This expansion mechanistically captures clinical response rates by describing heterogeneous ADC binding and tumor cell killing; high binding and tumor cell death close to capillaries vs. low binding, and high tumor cell proliferation far from capillaries. Sensitivity analyses suggest that clinical efficacy could be optimized through dose fractionation, and that clinical efficacy is primarily dependent on the ADC-target affinity, payload potency, and tumor growth rate. This work offers a mechanistic basis to predict and optimize ADC clinical efficacy for solid tumors, allowing dosing strategy optimization to improve patient outcomes.
© 2020 AbbVie Inc. Clinical and Translational Science published by Wiley Periodicals LLC on behalf of the American Society for Clinical Pharmacology and Therapeutics.
Conflict of interest statement
S.B. and M.S. are employees and may hold AbbVie stock or stock options. J.W., M.S.C., and J.P.G. are former employees of AbbVie and may hold AbbVie stock or stock options.
Figures
Similar articles
-
An Agent-Based Systems Pharmacology Model of the Antibody-Drug Conjugate Kadcyla to Predict Efficacy of Different Dosing Regimens.AAPS J. 2020 Jan 15;22(2):29. doi: 10.1208/s12248-019-0391-1. AAPS J. 2020. PMID: 31942650 Free PMC article.
-
Towards a platform quantitative systems pharmacology (QSP) model for preclinical to clinical translation of antibody drug conjugates (ADCs).J Pharmacokinet Pharmacodyn. 2024 Oct;51(5):429-447. doi: 10.1007/s10928-023-09884-6. Epub 2023 Oct 3. J Pharmacokinet Pharmacodyn. 2024. PMID: 37787918 Free PMC article.
-
Antibody Coadministration as a Strategy to Overcome Binding-Site Barrier for ADCs: a Quantitative Investigation.AAPS J. 2020 Jan 14;22(2):28. doi: 10.1208/s12248-019-0387-x. AAPS J. 2020. PMID: 31938899 Free PMC article.
-
HER2-Overexpressing/Amplified Breast Cancer as a Testing Ground for Antibody-Drug Conjugate Drug Development in Solid Tumors.Clin Cancer Res. 2020 Feb 15;26(4):775-786. doi: 10.1158/1078-0432.CCR-18-1976. Epub 2019 Oct 3. Clin Cancer Res. 2020. PMID: 31582515 Review.
-
Novel HER2-Targeting Antibody-Drug Conjugates of Trastuzumab Beyond T-DM1 in Breast Cancer: Trastuzumab Deruxtecan(DS-8201a) and (Vic-)Trastuzumab Duocarmazine (SYD985).Eur J Med Chem. 2019 Dec 1;183:111682. doi: 10.1016/j.ejmech.2019.111682. Epub 2019 Sep 6. Eur J Med Chem. 2019. PMID: 31563805 Review.
Cited by
-
Evolution of Pyrrolysyl-tRNA Synthetase: From Methanogenesis to Genetic Code Expansion.Chem Rev. 2024 Aug 28;124(16):9580-9608. doi: 10.1021/acs.chemrev.4c00031. Epub 2024 Jul 2. Chem Rev. 2024. PMID: 38953775 Free PMC article. Review.
-
Advancing cancer drug development with mechanistic mathematical modeling: bridging the gap between theory and practice.J Pharmacokinet Pharmacodyn. 2024 Dec;51(6):581-604. doi: 10.1007/s10928-024-09930-x. Epub 2024 Jun 21. J Pharmacokinet Pharmacodyn. 2024. PMID: 38904912 Free PMC article. Review.
-
Pharmacokinetics and Pharmacodynamics of TAK-164 Antibody Drug Conjugate Coadministered with Unconjugated Antibody.AAPS J. 2022 Oct 7;24(6):107. doi: 10.1208/s12248-022-00756-4. AAPS J. 2022. PMID: 36207468 Free PMC article.
-
Single-Domain Antibodies as Antibody-Drug Conjugates: From Promise to Practice-A Systematic Review.Cancers (Basel). 2024 Jul 27;16(15):2681. doi: 10.3390/cancers16152681. Cancers (Basel). 2024. PMID: 39123409 Free PMC article. Review.
-
Moving the needle for oncology dose optimization: A call for action.CPT Pharmacometrics Syst Pharmacol. 2024 Jun;13(6):909-918. doi: 10.1002/psp4.13157. Epub 2024 May 22. CPT Pharmacometrics Syst Pharmacol. 2024. PMID: 38778466 Free PMC article. No abstract available.
References
-
- Goldenberg, D.M. & Sharkey, R.M. Sacituzumab govitecan, a novel, third‐generation, antibody‐drug conjugate (ADC) for cancer therapy. Expert Opin. Biol. Ther. 20, 871–885 (2020). - PubMed
-
- Dott, J. , Abila, B. & Wuerthner, J.U. Current trends in the clinical development of antibody‐drug conjugates in oncology. Pharm. Med. 32, 259–273 (2018).
-
- Shah, D.K. , Haddish‐Berhane, N. & Betts, A. Bench to bedside translation of antibody drug conjugates using a multiscale mechanistic PK/PD model: a case study with brentuximab‐vedotin. J. Pharmacokinet. Pharmacodyn. 39, 643–659 (2012). - PubMed
Publication types
MeSH terms
Substances
LinkOut - more resources
Full Text Sources
Medical
