

Oncogenic mutant RAS signaling activity is rescaled by the ERK/MAPK pathway
- PMID: 33073539
- PMCID: PMC7569415
- DOI: 10.15252/msb.20209518
Oncogenic mutant RAS signaling activity is rescaled by the ERK/MAPK pathway
Abstract
Activating mutations in RAS are present in ~ 30% of human tumors, and the resulting aberrations in ERK/MAPK signaling play a central role in oncogenesis. However, the form of these signaling changes is uncertain, with activating RAS mutants linked to both increased and decreased ERK activation in vivo. Rationally targeting the kinase activity of this pathway requires clarification of the quantitative effects of RAS mutations. Here, we use live-cell imaging in cells expressing only one RAS isoform to quantify ERK activity with a new level of accuracy. We find that despite large differences in their biochemical activity, mutant KRAS isoforms within cells have similar ranges of ERK output. We identify roles for pathway-level effects, including variation in feedback strength and feedforward modulation of phosphatase activity, that act to rescale pathway sensitivity, ultimately resisting changes in the dynamic range of ERK activity while preserving responsiveness to growth factor stimuli. Our results reconcile seemingly inconsistent reports within the literature and imply that the signaling changes induced by RAS mutations early in oncogenesis are subtle.
Keywords: FRET biosensor; RAS disease; computational modeling; epidermal growth factor; single-cell kinetics.
© 2020 The Authors. Published under the terms of the CC BY 4.0 license.
Conflict of interest statement
The authors acknowledge the following potential sources for conflicts of interest. Frank McCormick is a consultant for the following companies: Aduro Biotech, Amgen, Daiichi Ltd., Ideaya Biosciences, Kura Oncology, Leidos Biomedical Research, Inc., PellePharm, Pfizer Inc., PMV Pharma, Portola Pharmaceuticals, and Quanta Therapeutics. Dr. McCormick has received research grants from Daiichi Sankyo Ltd. and is a recipient of funded research from Gilead Sciences. Dr. McCormick is a consultant and co‐founder for the following companies (with ownership interest including stock options): BridgeBio, DNAtrix Inc., Olema Pharmaceuticals, Inc., and Quartz. Dr. McCormick is Scientific Director of the NCI Ras Initiative at Frederick National Laboratory for Cancer Research/Leidos Biomedical Research Inc. John Albeck has received research grants from Kirin Corporation.
Figures
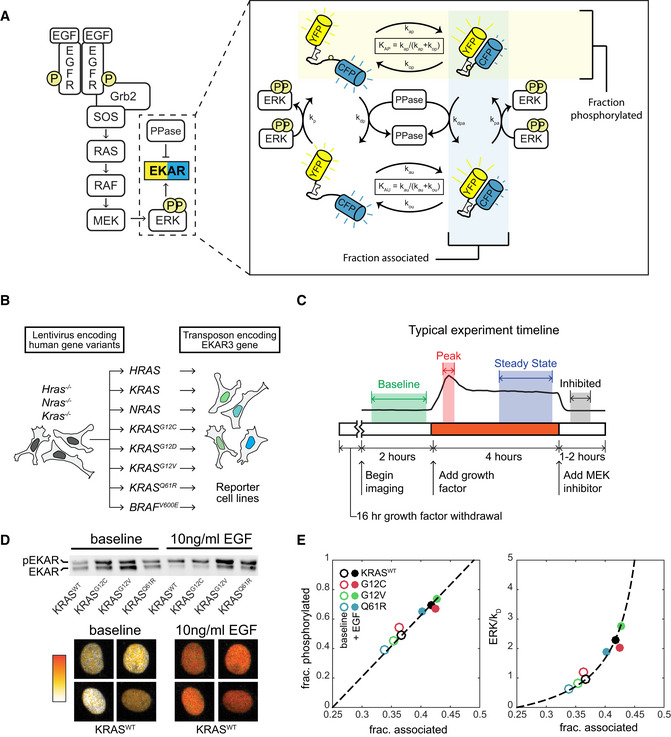
Schematic of EGF signaling through RAS to ERK, including the EKAR3 sensor. The detail image at right depicts the cycle of EKAR3 phosphorylation by ERK, binding and unbinding of the internal WW domain to the phosphorylated threonine residue, and removal of the phosphate by phosphatases. Spontaneous association of the fluorophores in the absence of phosphorylation contributes to background signal and is included in activity calculations.
Construction scheme for cell lines bearing a single RAS isoform, using H/K/N-RAS knockouts.
Diagram of the typical experiment timeline. Shaded regions indicate time windows that are averaged for each measurement.
Sample calibration data for the EKAR3 reporter, consisting of Phos‐Tag immunoblot for phospho‐EKAR (upper) and live‐cell imaging of reporter FRET activity (lower) under matched conditions for 4 cell lines that span the full range of ERK activity levels. Ratiometric images of four individual nuclei from the KRASWT line, which show the largest change from baseline to peak, are shown before and after stimulus as a representative example of the image data.
Calibration curves for ERK activity. Fraction of EKAR3 phosphorylated is shown vs. the fraction in the associated conformation by FRET (left). The ERK to phosphatase activity ratio (right) is derived from a model of EKAR3 (see Appendix Supplementary Methods). Each marker represents the mean value from one cell line with (filled circle) or without (open circle) EGF treatment, from 3 replicate live‐cell samples and 4 replicate immuno blot samples.
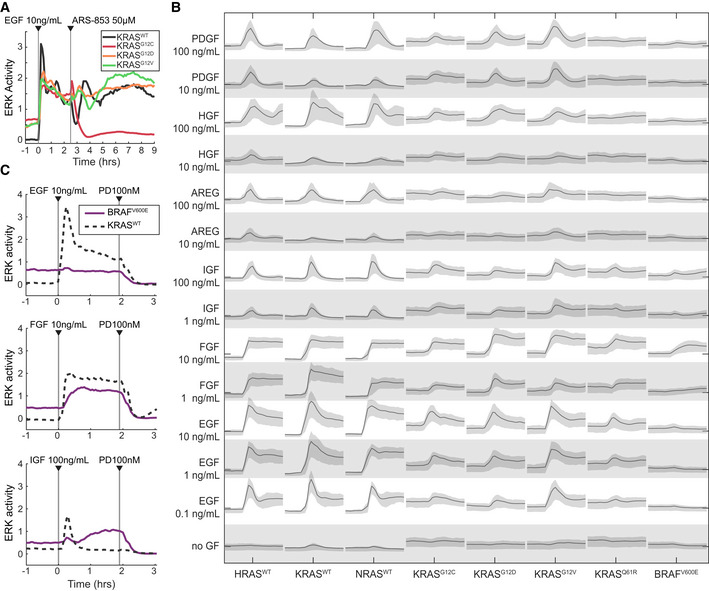
Demonstration of the system measuring a cell line‐specific response via ARS‐853, a RAS activity inhibitor specific to the KRASG12C mutant. Traces are median values from a representative experiment. Experiment was replicated 3 times.
Graphical summary of single RAS isoform cell lines (labeled along bottom) stimulated by a panel of growth factors (labeled along left). Each panel of the matrix shows the time series of ERK activity with the indicated growth factor spiked in after beginning imaging. All scales are equal; x‐axis: time; y‐axis: ERK activity. Lines indicate median of single‐cell measurements over time, and shaded regions denote the 25th–75th percentile region, across 3 replicate cultures (6 for no GF).
Demonstration of RAS‐independent activity from ligands other than EGF, evidenced by response in the BRAFV600E cell line lacking H/K/N-RAS. Traces are median values from a representative experiment. Experiment was replicated 5 times.
- A–E
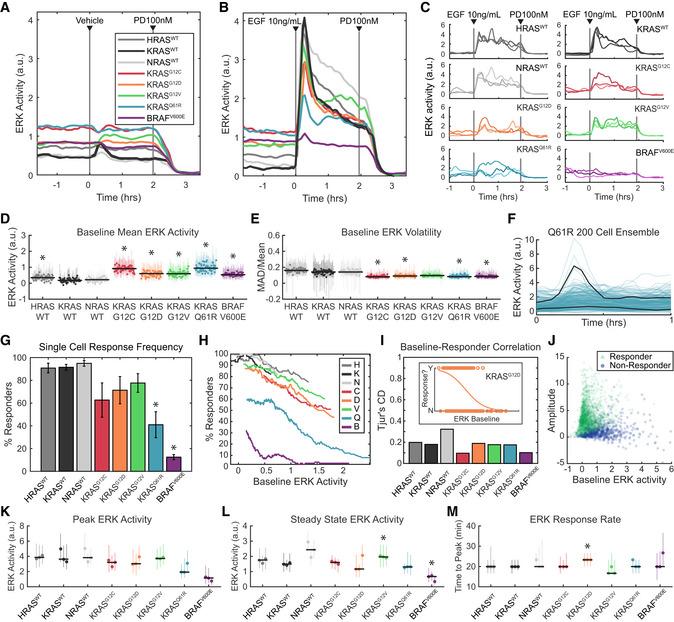
ERK activity in each of the 8 MEF cell lines, after growth factor withdrawal for 16–24 h, followed by stimulus consisting of (A) media only, or (B) 10 ng/ml EGF. (A, B) Mean values over 3 replicate cultures. (C) Three example single‐cell traces per cell line, randomly selected from 3 replicate experiments. (D) Average baseline (pre‐stimulus) ERK activity over 58 replicate cultures per cell line. Each dot represents the median value across cells in an experiment and vertical lines represent the 25th–75th percentiles. Black horizontal bars denote the median across all replicates. Asterisks indicate significance by t‐test (pFDR < 0.05). (E) Average volatility (pre‐stimulus) over 58 replicate cultures per cell line, reflecting the scale of variation over time, displayed as in D. Dots show medians and error bars show 25th–75th percentiles. Asterisks indicate significance by t‐test (pFDR < 0.05).
- F–J
Analysis of single‐cell response likelihood after EGF stimulus. (F) Demonstration of many cells not responding to EGF stimulus in the Q61R cell line, in a representative experiment. Black lines highlight one responder and one non‐responder cell, with 200 individual cell traces shown. (G) Likelihood of single cells responding to EGF stimulus, for each cell line, showing mean of 3 replicates with error bars showing one standard deviation. Asterisks indicate significance by t‐test (pFDR < 0.05). (H) Relationship between response likelihood and average baseline ERK activity as a possible correlate, for each cell line. Means taken over 3 replicate cultures. (I) Weakness of correlation between baseline ERK activity and response likelihood, measured by Tjur's coefficient of discrimination (i.e., correlation coefficient for a binary response). Inset shows an example from the KRASG12D mutant, where dots are scattered per cell by baseline ERK activity (x‐axis) and whether that cell responded to EGF (binary y‐axis). Orange line indicates the logistic fit. Correlations calculated from single‐cell data from 3 replicate experiments. (J) Scattered single‐cell measurements of baseline ERK activity and amplitude of the change after EGF stimulus. Green triangles: cells that responded; blue circles: cells that did not respond.
- K–M
Analysis of the response to EGF, by filtering to remove cells that do not respond, presented as in (D), with dots showing medians and error bars showing 25th–75th percentiles. Asterisks indicate significance by t‐test (pFDR < 0.05). Data from 3 independent culture replicates. (K) Peak ERK activity reached after EGF stimulus. (L) Average ERK activity after 2 h in the presence of EGF. (M) Delay between EGF stimulus and peak ERK activity.
- A, B
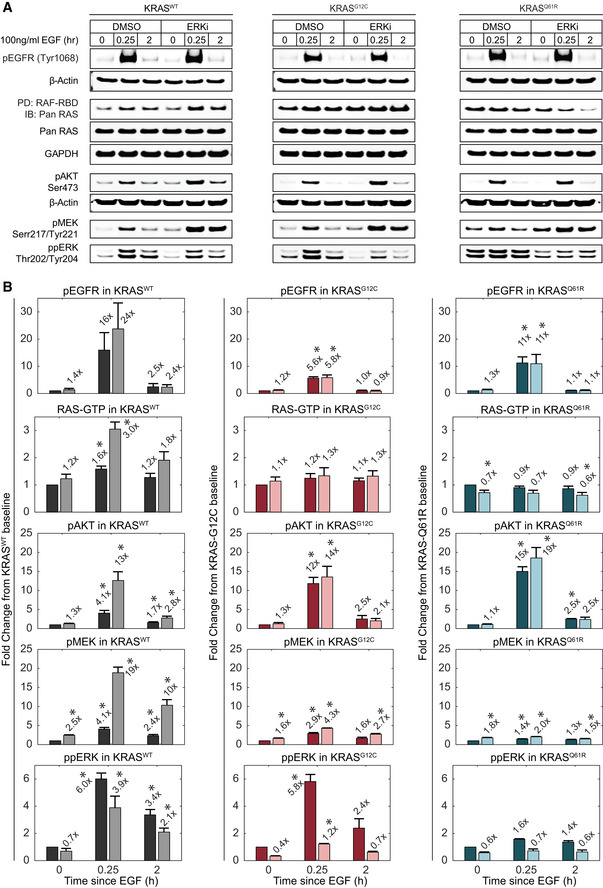
Immunoblot analysis of RAS‐ERK pathway activity at multiple levels in the absence or presence of ERK inhibition by 100 nM SCH772984 (ERKi). Lysates for the indicated cell lines were collected at baseline, peak (15 min), and steady state (2 h) time points after treatment with 100 ng/ml EGF. (A) Sample blot imagery for each measurement. (B) Quantified measurements, shown as fold change relative to the DMSO‐treated baseline sample. Values for pEGFR, pAKT, ppMEK, and ppERK were normalized to β‐actin; data for RAF‐RBD PD/Pan RAS were normalized to total Pan RAS. Bars represent the mean of triplicate measurements and error bars the standard error of the mean. Mean fold change values are printed above each bar. Dark bars: DMSO‐treated; light bars: ERKi‐treated. x‐axis indicates the duration of EGF treatment. Asterisks indicate statistical significance by t‐test (P < 0.05).
- A
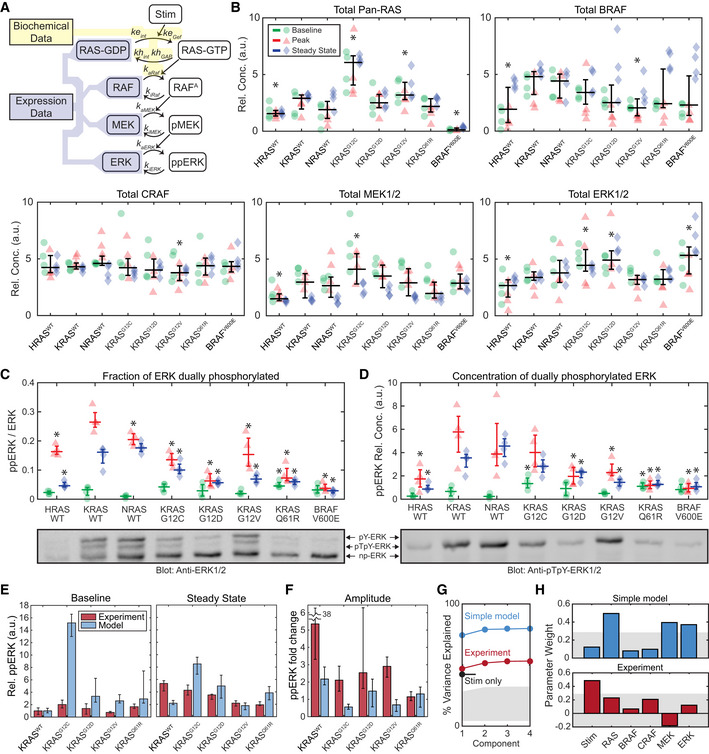
Schematic of a model of the internal factors of the RAS‐ERK pathway, showing parameters associated with each reaction. Shaded regions indicate portions of the model for which parameter values are available from either (yellow) published biochemical assays or (blue) our immunoblot expression data (B–D).
- B
Immunoblot measurement of RAS‐ERK pathway components in each cell line, at baseline (green circles), peak activity (15 min, red triangles), and steady‐state activity (2 h, blue diamonds), four replicates each. Overlaid plots indicate the median (horizontal bars) and 25th–75th percentiles (vertical whiskers) over all conditions. Asterisks indicate statistical significance from the KRASWT cell line, by t‐test (pFDR < 0.05).
- C, D
Phos‐Tag immunoblot measurement of ERK fractional phosphorylation (C) and the relative concentration of dually‐phosphorylated ERK (D), annotated as in (B), but with median and percentile ranges indicated per treatment condition, for 4 replicate cultures. Sample blot imagery shows anti‐ERK1/2 (below C) and anti‐ppERK1/2 (below D) for the same blot replicate. Asterisks indicate significance by t‐test (pFDR < 0.05) from the KRASWT cell line measurement for each condition.
- E, F
Comparison of the internal RAS‐ERK model to experimental data. (E) Relative ppERK as predicted by the internal model and measured by immunoblot for the 4 replicates collected, showing the median of the baseline and steady state after EGF treatment (E), and the amplitude of stimulation (F). Error bars show 25th–75th percentiles.
- G, H
Partial least squares regression of both experimental ppERK measurements and predictions via the simple RAS‐ERK model. Regression was based on presence/absence of EGF, and expression levels of RAS, BRAF, CRAF, MEK, and ERK. (G) Percent of variance explained by each PLS model considered, based on how many component terms are allowed. Stim only refers to a PLS model using experimental ppERK data, but only predicting based on the presence/absence of EGF. (H) Weights assigned to each parameter in the PLS models. Gray shaded regions indicate the bounds of statistical significance, determined via bootstrapping with scrambled data. Only values that extend beyond the gray regions are statistically significant from zero (P < 0.05).
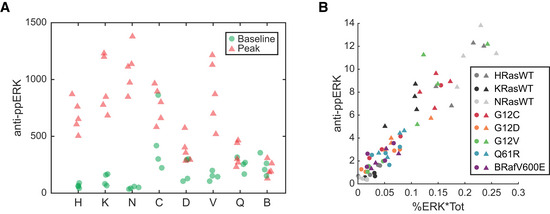
ppERK measured in baseline and peak stimulated samples of each cell line, via immuno blot with anti‐ppERK antibody.
Data from A, plotted against the ppERK calculated for the same samples, as percent of ERK phosphorylated (via Phos‐Tag) times the total ERK (via immuno blot with anti‐ERK1/2 antibody).
- A
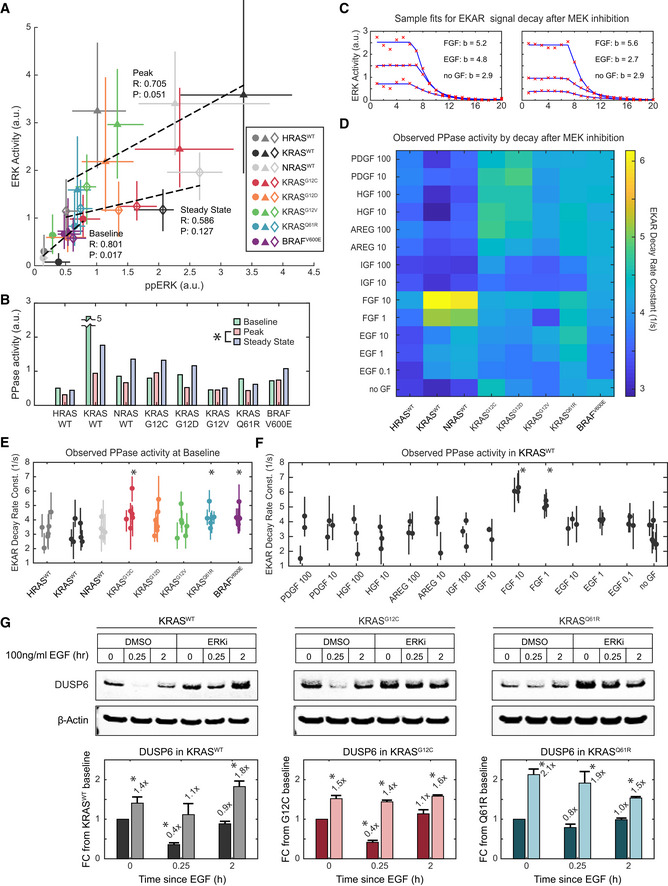
Correlation of ERK activity and ppERK concentration, median of 3 and 4 replicates, respectively, per condition. Error bars denote 25th–75th percentiles, including single‐cell distributions for ERK activity. Markers are color‐coded by cell line, and marker shape indicates treatment (circle: baseline, triangle: peak, diamond: steady state). Dotted lines show linear regression for each treatment; Pearson's correlation coefficients (R), and associated P‐values (P) are printed alongside.
- B
Estimate of substrate level phosphatase activity per cell line and treatment, calculated as ppERK/ERK activity. Asterisk indicates significance when comparing all cell lines, by t‐test (pFDR < 0.05).
- C
EKAR signal decay after MEK inhibition, example single‐cell data (red x's) fit to a decaying exponential model (blue lines), with decay rate constants (b) printed.
- D
Heatmap of median decay rate constants fit for each cell line and treatment.
- E, F
Statistical analysis of phosphatase activities observed by EKAR signal decay at (E) baseline (i.e., no GF treatment prior to MEKi) for all cell lines compared with KRASWT, with 6 replicates, and (F) in KRASWT for all treatments, compared with no GF, with 3 replicates. Dots denote median values, and bars 25th–75th percentiles. Asterisks indicate significance by t‐test (pFDR < 0.05); t‐tests performed as detailed in Methods and Protocols “Statistical Analysis: t‐tests for Single‐Cell Data”.
- G
Immunoblot analysis of DUSP6 levels, subject to stimulation by EGF and inhibition of ERK by 100 nM SCH772984. Bars represent the mean of triplicate measurements and error bars the standard error of the mean. Asterisks indicate statistical significance by t‐test (P < 0.05).
References
-
- Adler M, Szekely P, Mayo A, Alon U (2017) Optimal regulatory circuit topologies for fold‐change detection. Cell Syst 4: 171–181 e178 - PubMed
-
- Amit I, Citri A, Shay T, Lu Y, Katz M, Zhang F, Tarcic G, Siwak D, Lahad J, Jacob‐Hirsch J et al (2007) A module of negative feedback regulators defines growth factor signaling. Nat Genet 39: 503–512 - PubMed
Publication types
MeSH terms
Substances
Grants and funding
LinkOut - more resources
Full Text Sources
Miscellaneous
