. 2020 Oct 19:9:e62199.
doi: 10.7554/eLife.62199.

APOE2 is associated with longevity independent of Alzheimer's disease

Affiliations

APOE2 is associated with longevity independent of Alzheimer's disease

Mitsuru Shinohara et al. Elife. .

Abstract

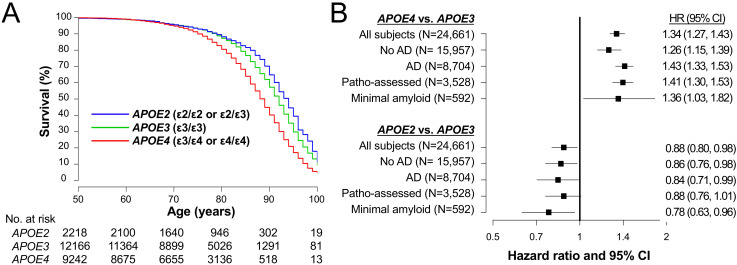
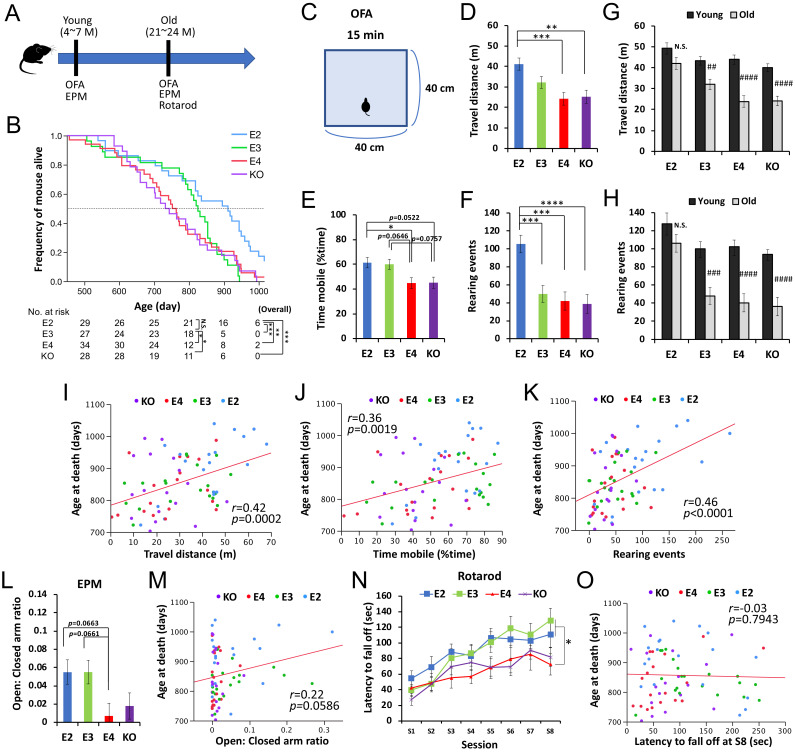
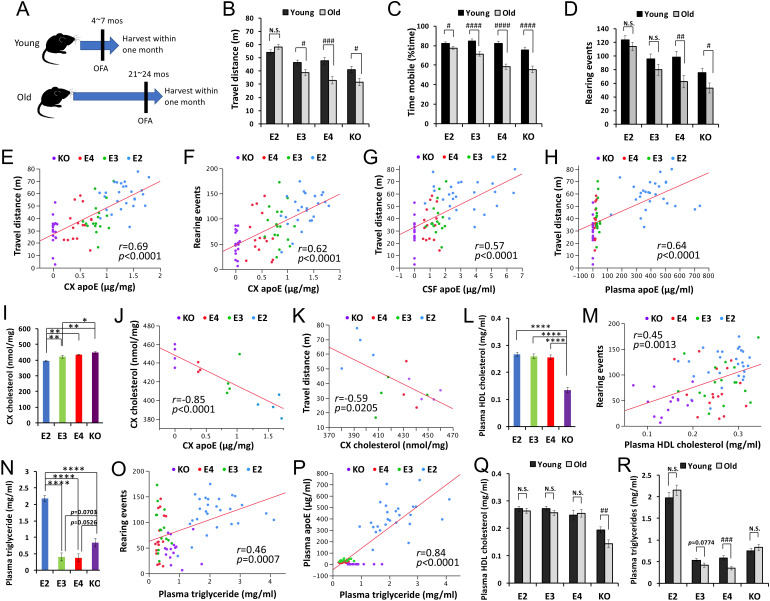
Although the ε2 allele of apolipoprotein E (APOE2) benefits longevity, its mechanism is not understood. The protective effects of the APOE2 on Alzheimer's disease (AD) risk, particularly through their effects on amyloid or tau accumulation, may confound APOE2 effects on longevity. Herein, we showed that the association between APOE2 and longer lifespan persisted irrespective of AD status, including its neuropathology, by analyzing clinical datasets as well as animal models. Notably, APOE2 was associated with preserved activity during aging, which also associated with lifespan. In animal models, distinct apoE isoform levels, where APOE2 has the highest, were correlated with activity levels, while some forms of cholesterol and triglycerides were associated with apoE and activity levels. These results indicate that APOE2 can contribute to longevity independent of AD. Preserved activity would be an early-observable feature of APOE2-mediated longevity, where higher levels of apoE2 and its-associated lipid metabolism might be involved.

Keywords: APOE; Alzheimer's disease; human; longevity; medicine; mouse; neuroscience.


Conflict of interest statement

MS, TK, MT, AK, MS, YF, JZ, XH, PS, GR, JF, MH, GB No competing interests declared

Figures

Figure 1.
Figure 1.. APOE associate with lifespan irrespective of AD in clinical cohorts.
(A) Kaplan-Meier survival curve according to APOE genotype. (B) Effects of APOE4 (ε3/ε4 or ε4/ε4) or APOE2 (ε2/ε3 or ε2/ε2) on survival compared to APOE3 (ε3/ε3) as a reference in all subjects (‘All subjects’), when stratifying by AD diagnosis at last visit (‘No AD’ or ‘AD’), in subjects with neuropathologically-assessment (‘Patho-assessed’), and subjects with minimal amyloid pathology (‘Minimal amyloid’). HR = hazard ratio. CI = confidence interval. HRs and 95% CIs result from Cox proportional hazards regression models. Models for all subjects were adjusted for sex, race, cognitive status at last visit, presence of AD at last visit, and cardiovascular factors. The models for subjects with neuropathological assessment were adjusted for sex, race, CERAD diffuse plaque score, CERAD neuritic plaque score, Braak NFT stage, presence of vascular pathology, and cardiovascular factors. All other models were adjusted for sex, race, and cardiovascular factors.
Figure 2.
Figure 2.. APOE2 benefits lifespan and preserved activity levels in animal models.
(A) The timeline of the survival cohort. The OFA and EPM were performed at both young (4–7 months) and old (21–24 months) ages. Rotarod test was also performed at old age. (B) Kaplan-Meier survival curve of apoE-TR and Apoe-KO mouse models (n = 118), categorized by APOE carrier status with number of mice at risk. *p<0.05, **p<0.01, ***p<0.001 after Bonferroni correction for multiple comparisons; calculated by Cox proportional hazards regression models that were adjusted for sex. Median survival for each group is the point at which the Kaplan-Meier survival curves intersects with the dotted horizontal line. (C) Diagram of OFA. (D–I) Total distance traveled (D and G), percent time spent mobile (E), and number of rearing events (F and H) in the OFA were compared among APOE genotype groups at old age (D–F) or between young and old ages within the same APOE genotype (G and H) after adjusting for sex (n = 17–20 mice/group). (I–J) Total distance traveled (I), percent time spent mobile (J), and number of rearing events (K) in the OFA performed at old age are plotted against the age at death. (L and M) Ratios of time stayed at open arm vs. closed arm measured by EPM test at old age were compared among APOE genotype groups after adjusting for sex (L), and plotted against following age at death (M) (n = 17–20 mice/group). (N and O) Latency to fall off at each session of rotarod test at old age was compared among APOE genotype groups after adjusting for sex (N), and plotted against following age at death (O) (n = 17–20 mice/group). Data are presented as adjusted means ± standard errors of the means. *p<0.05, **p<0.01, ***p<0.001, ****p<0.0001; compared among APOE genotype groups using the Tukey’s HSD test (D-F and L) or repeated-measures one-way ANOVA followed by Tukey-Kramer test (N)., or #p<0.05, ##p<0.01, ###p<0.001, ####p<0.0001; compared with young mice using two-sided Student’s t test (G and H). (I-K, M and O) Correlation coefficients (r) and p-values were calculated using the Pearson correlation test. N.S. = not significant.
Figure 3.
Figure 3.. APOE2 is associated with preserved activity in clinical cohorts.
(A) Odds ratio with 95% CIs of APOE2 or APOE4 on ‘dropped activities and interests’, ‘total GDS score’, and ‘memory problem’ compared to APOE3, as calculated by logistic regression models that were adjusted for sex, race, and age at the time of the GDS questionnaire. (B) Kaplan–Meier survival curve of subjects with/without ‘dropped activities and interests’; dropped activities and interests were associated with poorer survival (Hazard ratio = 1.20, p=0.010). *p<0.05; calculated by Cox proportional hazards regression analysis adjusting for sex, race, and APOE genotype group.
Figure 4.
Figure 4.. ApoE and lipid levels correlate with activity.
(A) The timeline of biochemically assessed cohort. The OFA was performed within one month before harvest. (B–D) Total distance traveled (B), percent time spent mobile (C), and number of rearing events (D) were compared between young and old mice within the same APOE genotype after adjusting for sex (n = 16–28 mice/group). (E–H) ApoE levels in the brain cortex (CX, E, and F), CSF (G) and plasma (H) are plotted against the total distance traveled (E, G and H), or number of rearing events in the OFA (F). (I) Levels of cholesterol in the brain cortex of old male mice were compared among APOE genotypes (n = 3–4 mice/group) and are plotted against apoE levels in the cortex (J) and total distance traveled in the OFA (K). (L–R) Plasma HDL-cholesterol levels (L and M) or triglyceride levels (N–P) were compared among APOE genotypes in old mice (L and N) or between young and old mice within the same APOE genotype (Q and R) after adjusting for sex and plotted against the number of rearing events in the OFA (M and O) or plasma apoE levels (P) (n = 9–27 mice/group). Data are presented as adjusted means ± standard errors of the means. *p<0.05, **p<0.01, ***p<0.001, ****p<0.0001; compared among APOE genotypes using the Tukey-Kramer test (I), Tukey’s HSD test (L and N), or #p<0.05, ##p<0.01, ###p<0.001, ####p<0.0001; compared between young and old mice using two-sided Student’s t test (B-D, Q, and R). (E-H, J, K, M, O, and P) Correlation coefficients (r) and p-values were calculated using the Pearson correlation test. N.S. = not significant.

Similar articles

Cited by

References

    1. Barzilai N, Gabriely I, Gabriely M, Iankowitz N, Sorkin JD. Offspring of centenarians have a favorable lipid profile. Journal of the American Geriatrics Society. 2001;49:76–79. doi: 10.1046/j.1532-5415.2001.49013.x. - DOI - PubMed
    1. Bross TG, Rogina B, Helfand SL. Behavioral, physical, and demographic changes in Drosophila populations through dietary restriction. Aging Cell. 2005;4:309–317. doi: 10.1111/j.1474-9726.2005.00181.x. - DOI - PubMed
    1. Burkholder T, Foltz C, Karlsson E, Linton CG, Smith JM. Health evaluation of experimental laboratory mice. Current Protocols in Mouse Biology. 2012;2:145–165. doi: 10.1002/9780470942390.mo110217. - DOI - PMC - PubMed
    1. Cauley JA, Eichner JE, Ilyas Kamboh M, Ferrell RE, Kuller LH. Apo E allele frequencies in younger (age 42-50) vs older (age 65-90) women. Genetic Epidemiology. 1993;10:27–34. doi: 10.1002/gepi.1370100104. - DOI - PubMed
    1. Conejero-Goldberg C, Gomar JJ, Bobes-Bascaran T, Hyde TM, Kleinman JE, Herman MM, Chen S, Davies P, Goldberg TE. APOE2 enhances neuroprotection against Alzheimer’s disease through multiple molecular mechanisms. Molecular Psychiatry. 2014;19:1243–1250. doi: 10.1038/mp.2013.194. - DOI - PubMed

Publication types

Substances