Clinical Trial
. 2020;78(3):989-1010.
doi: 10.3233/JAD-200896.

Benfotiamine and Cognitive Decline in Alzheimer's Disease: Results of a Randomized Placebo-Controlled Phase IIa Clinical Trial

Affiliations
Clinical Trial

Benfotiamine and Cognitive Decline in Alzheimer's Disease: Results of a Randomized Placebo-Controlled Phase IIa Clinical Trial

Gary E Gibson et al. J Alzheimers Dis. 2020.

Abstract

Background: In preclinical models, benfotiamine efficiently ameliorates the clinical and biological pathologies that define Alzheimer's disease (AD) including impaired cognition, amyloid-β plaques, neurofibrillary tangles, diminished glucose metabolism, oxidative stress, increased advanced glycation end products (AGE), and inflammation.

Objective: To collect preliminary data on feasibility, safety, and efficacy in individuals with amnestic mild cognitive impairment (aMCI) or mild dementia due to AD in a placebo-controlled trial of benfotiamine.

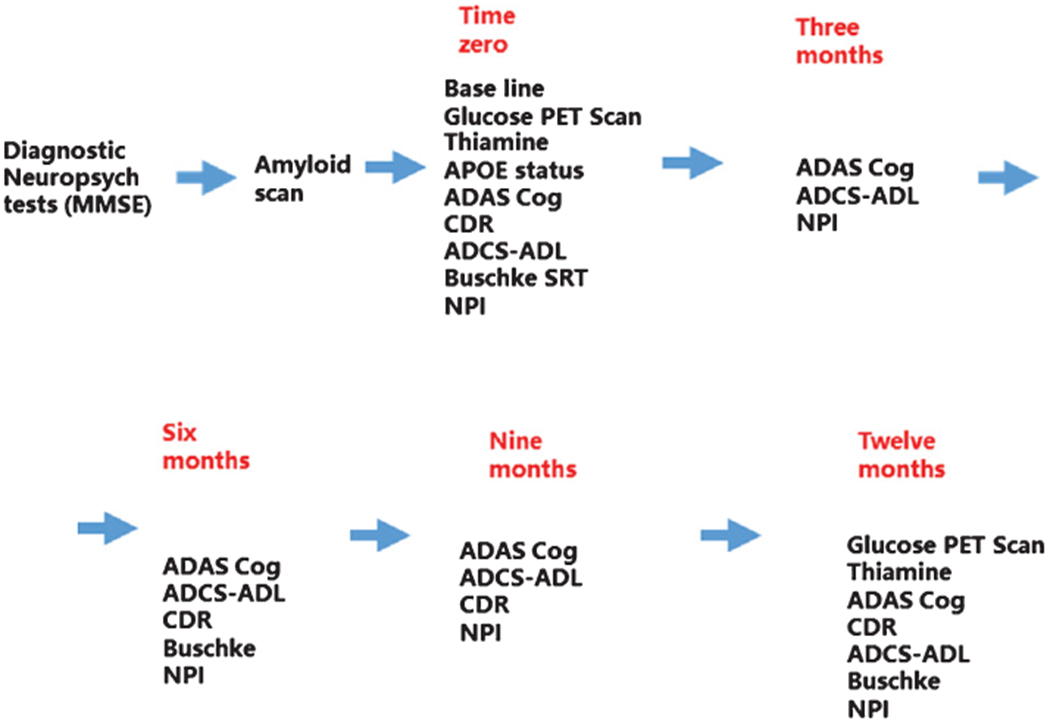
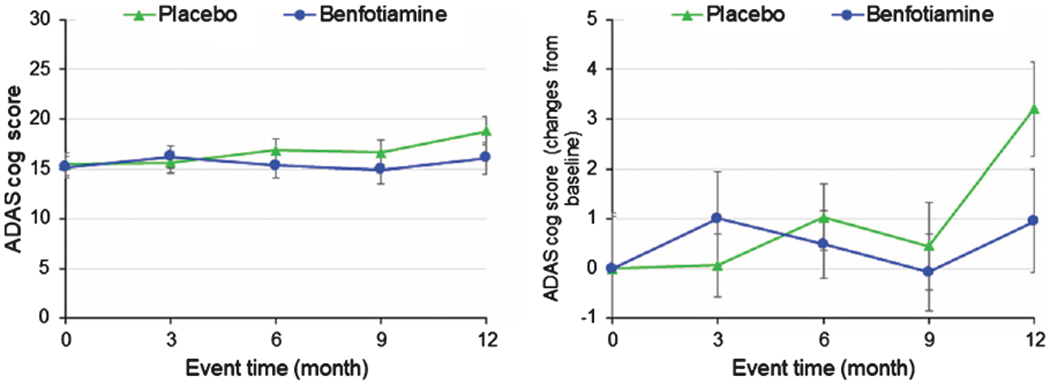
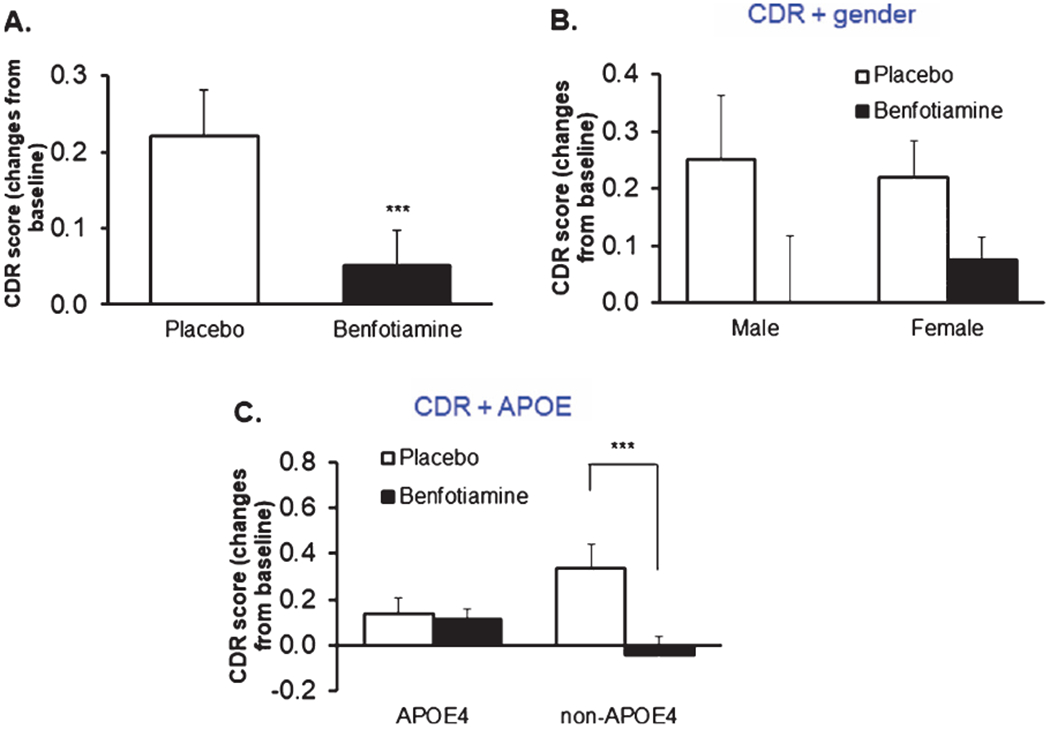
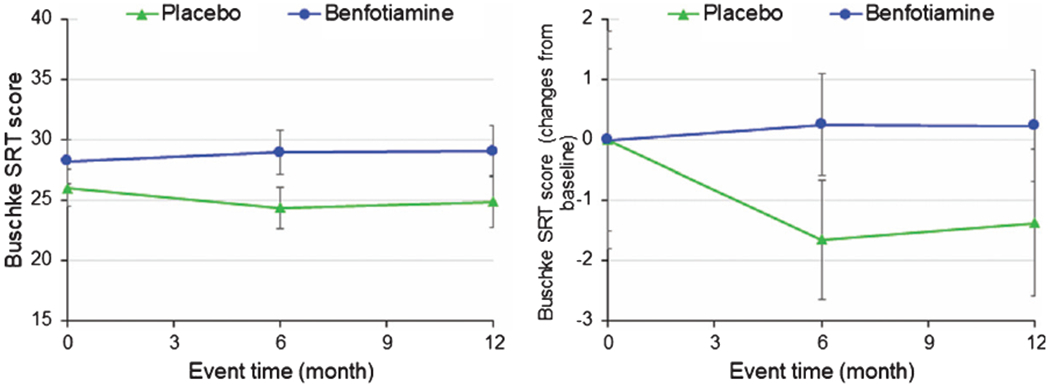
Methods: A twelve-month treatment with benfotiamine tested whether clinical decline would be delayed in the benfotiamine group compared to the placebo group. The primary clinical outcome was the Alzheimer's Disease Assessment Scale-Cognitive Subscale (ADAS-Cog). Secondary outcomes were the clinical dementia rating (CDR) score and fluorodeoxyglucose (FDG) uptake, measured with brain positron emission tomography (PET). Blood AGE were examined as an exploratory outcome.

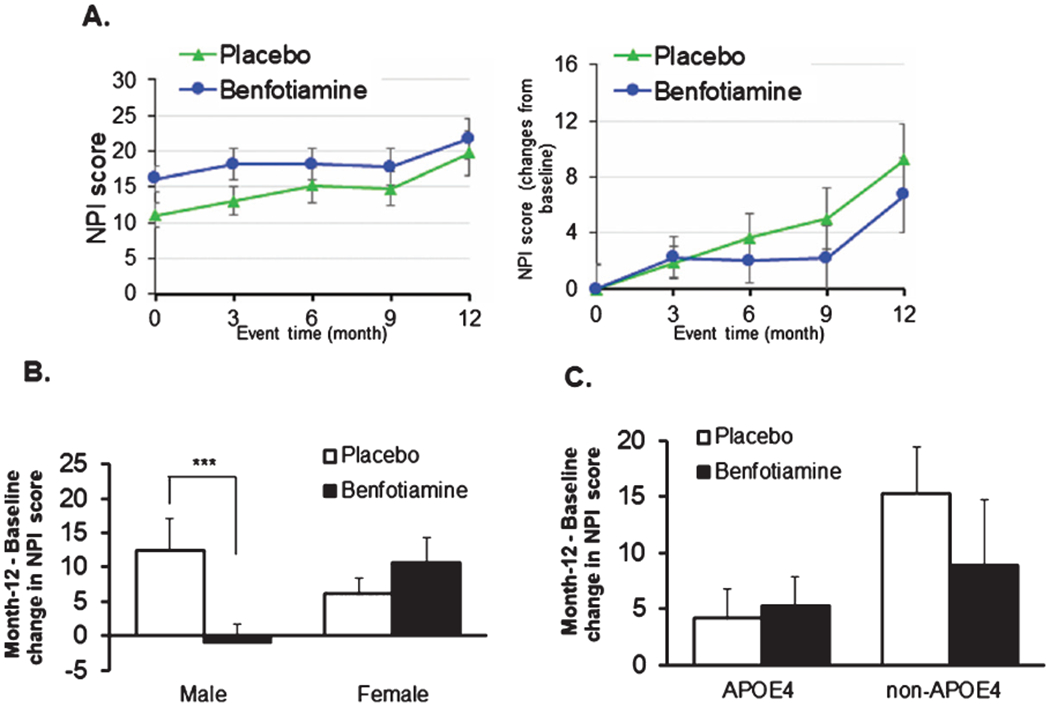
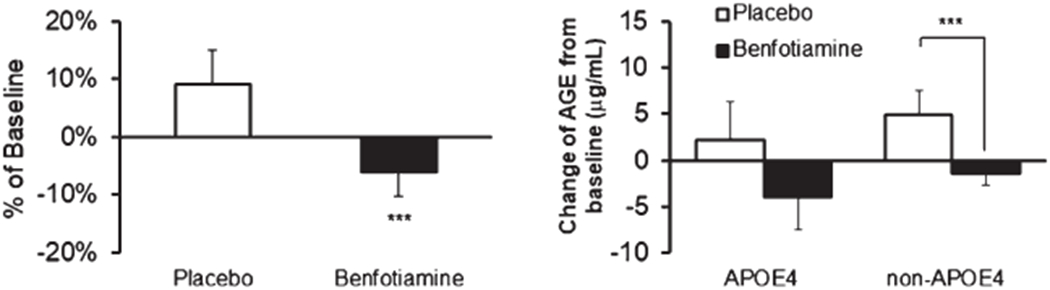
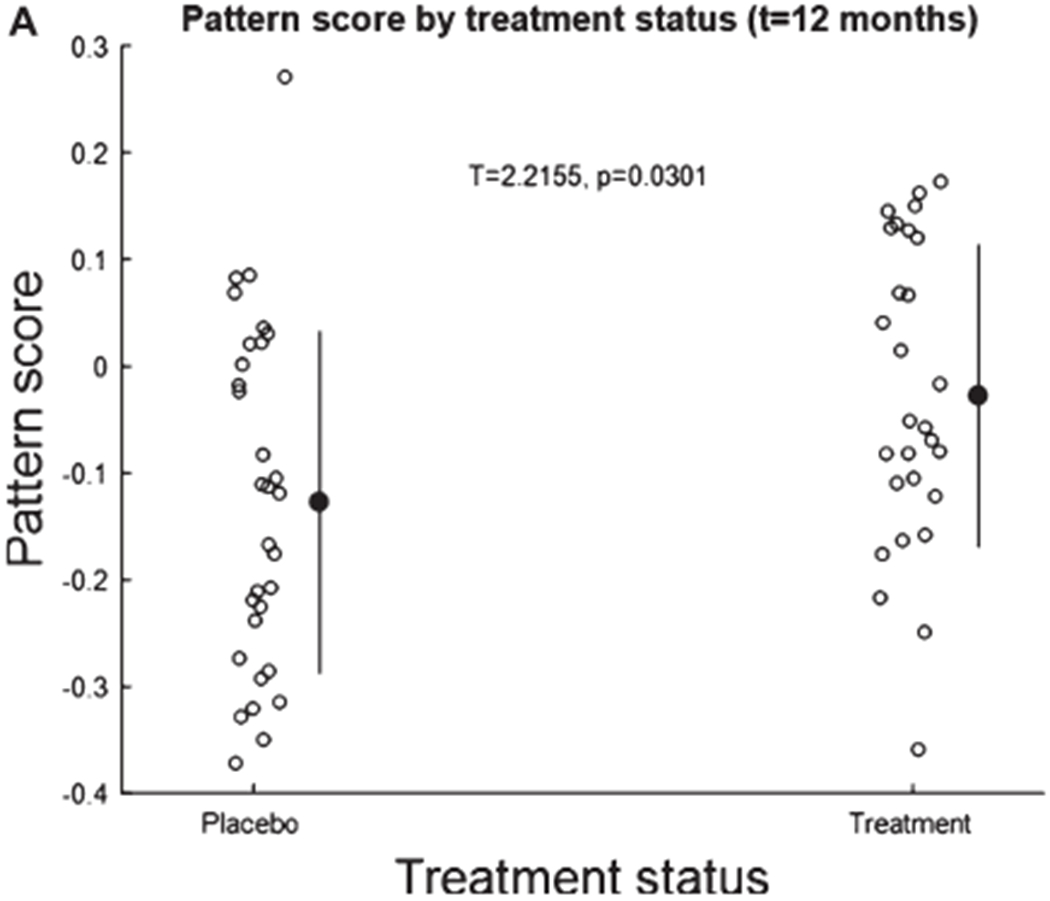
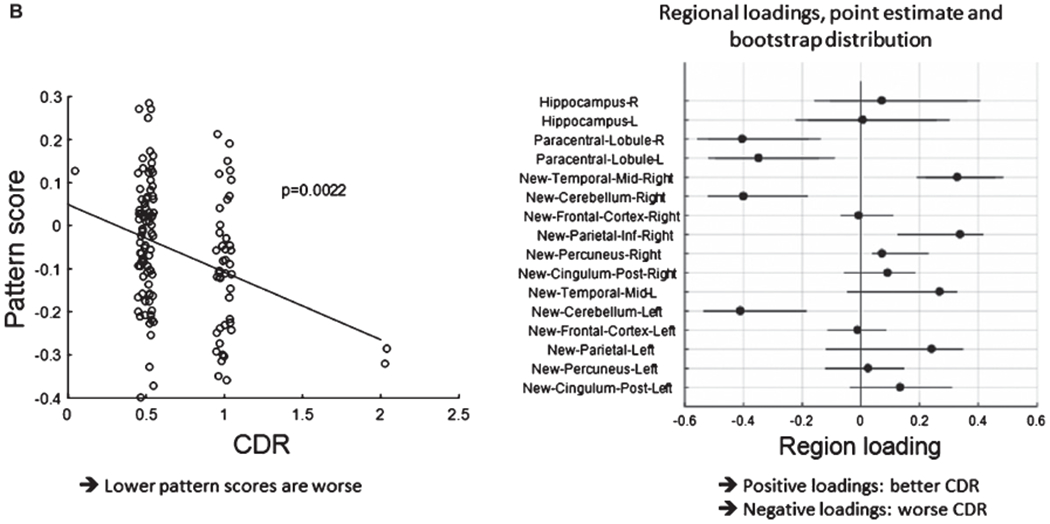
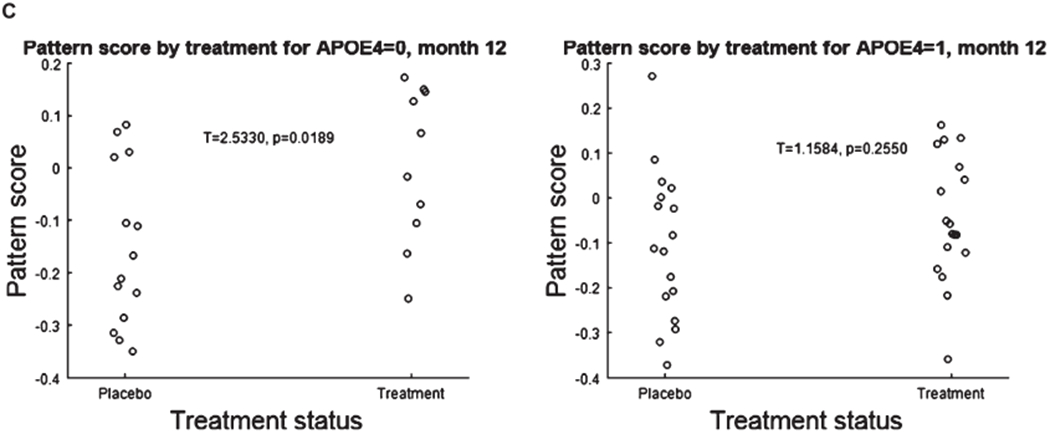
Results: Participants were treated with benfotiamine (34) or placebo (36). Benfotiamine treatment was safe. The increase in ADAS-Cog was 43% lower in the benfotiamine group than in the placebo group, indicating less cognitive decline, and this effect was nearly statistically significant (p = 0.125). Worsening in CDR was 77% lower (p = 0.034) in the benfotiamine group compared to the placebo group, and this effect was stronger in the APOEɛ4 non-carriers. Benfotiamine significantly reduced increases in AGE (p = 0.044), and this effect was stronger in the APOEɛ4 non-carriers. Exploratory analysis derivation of an FDG PET pattern score showed a treatment effect at one year (p = 0.002).

Conclusion: Oral benfotiamine is safe and potentially efficacious in improving cognitive outcomes among persons with MCI and mild AD.

Keywords: Advanced glycation endproducts; Alzheimer’s disease; benfotiamine; glucose; inflammation; oxidative stress.


Figures

Fig. 1.
Fig. 1.
Summary of the treatment protocol for the one-year trial.
Fig. 2.
Fig. 2.
Changes in ADAS-Cog with benfotiamine treatment compared to controls. See Table 7 for statistical comparisons.
Fig. 3.
Fig. 3.
Benfotiamine treatment and the CDR. CDR Placebo = 34, benfotiamine = 29. On the figure *** indicates significantly different (p = 0.034) (A). When the groups are also separated by sex, large but non-significant differences occur (B). When the groups are separated by APOE4 only the non-APOE ε4 allele group differs. In the non-APOE4 group the *** indicates values significantly different (p = 0.013) (C). The APOE4 denotes at least one ε4 allele. p-values here are when there are subgroups are all obtained from subgroup analysis, not interaction from ANOVA (C).
Fig. 4.
Fig. 4.
Benfotiamine and the Buschke Selective Reminding Test (SRT).
Fig. 5.
Fig. 5.
Benfotiamine and the Neuropsychiatric Inventory (NPI). No differences were seen in the overall scores (A). However, separation of the groups by sex revealed a highly significant benefit in males but not females. *** indicates p = 0.035 (B). No significant difference was seen with APOE ε4 alleles (C).
Fig. 6.
Fig. 6.
Alzheimer’s Disease Cooperative Study-Activities of Daily Living (ADCS-ADL).
Fig. 7.
Fig. 7.
Blood thiamine, ThMP, and ThDP concentrations at baseline and month 12. Each dot represents a different patient. The bar represents the mean value. All values are per protocol after omitting a patient designated as placebo who was taking benfotiamine from another source.
Fig. 8.
Fig. 8.
Relation of sex and APOE ε4 genotype to thiamine, ThDP and ThMP. Values are means ± SEM. *** denotes significantly different (p <0.0001) by t-test.
Fig. 9.
Fig. 9.
Advanced glycation end products (AGE) after benfotiamine treatment. These were done as an exploratory analysis. They were measured on serum and several samples were contaminated with RBC. In the left panel, the n’s are 12 placebo and 13 benfotiamine patients. The asterisk indicates p = 0.043. In the right panel, in the APOE ε4 group the n = 6. In the non-APOE4 group n = 7. The APOE ε4 denotes at least one ε4 allele.
Fig. 10
Fig. 10
A. Pattern score as function of the 12-month treatment period. The pattern is a linear combination of the first two principal components whose pattern score is slightly but significantly higher for treatment than untreated participants at time point 12 months. B. The left panel shows the pattern score plotted against CDR status (p-level obtained from whole-model F-test.) A higher pattern score implies lower CDR status. The right panel shows loading distributions from a bootstrap test with 90% coverage intervals. We stress that these loadings sizes and signs are relative since we removed the whole-brain mean from the analysis prior to the pattern derivation. Thus, high positive loadings are found in the right mid temporal and inferior parietal cortex, implying relatively higher signal in participants with lower CDR. Bilateral cerebellum and paracentral lobule on the other hand, had relatively lower signal in participants with lower CDR. C. Stratification of the pattern score by APOE status reveals that APOE4 negative patients show the greatest response. APOE ε4 = 0 patients show a treatment effect (left panel), APOE ε4 = 1 do not (right panel).
Fig. 10
Fig. 10
A. Pattern score as function of the 12-month treatment period. The pattern is a linear combination of the first two principal components whose pattern score is slightly but significantly higher for treatment than untreated participants at time point 12 months. B. The left panel shows the pattern score plotted against CDR status (p-level obtained from whole-model F-test.) A higher pattern score implies lower CDR status. The right panel shows loading distributions from a bootstrap test with 90% coverage intervals. We stress that these loadings sizes and signs are relative since we removed the whole-brain mean from the analysis prior to the pattern derivation. Thus, high positive loadings are found in the right mid temporal and inferior parietal cortex, implying relatively higher signal in participants with lower CDR. Bilateral cerebellum and paracentral lobule on the other hand, had relatively lower signal in participants with lower CDR. C. Stratification of the pattern score by APOE status reveals that APOE4 negative patients show the greatest response. APOE ε4 = 0 patients show a treatment effect (left panel), APOE ε4 = 1 do not (right panel).

References

    1. Gordon BA, Blazey TM, Su Y, Hari-Raj A, Dincer A, Flores S, Christensen J, McDade E, Wang G, Xiong C, Cairns NJ, Hassenstab J, Marcus DS, Fagan AM, Jack CR, Hornbeck RC, Paumier KL, Ances BM, Berman SB, Brickman AM, Cash DM, Chhatwal JP, Correia S, Förster S, Fox NC, Graff-Radford NR, la Fougère C, Levin J, Masters CL, Rossor MN, Salloway S, Saykin AJ, Schofield PR, Thompson PM, Weiner MM, Holtzman DM, Raichle ME, Morris JC, Bateman RJ, Benzinger TLS (2018) Spatial patterns of neuroimaging biomarker change in individuals from families with autosomal dominant Alzheimer’s disease: A longitudinal study. Lancet Neurol 17, 241–250. - PMC - PubMed
    1. Mosconi L, Mistur R, Switalski R, Tsui WH, Glodzik L, Li Y, Pirraglia E, De Santi S, Reisberg B, Wisniewski T, de Leon MJ (2009) FDG-PET changes in brain glucose metabolism from normal cognition to pathologically verified Alzheimer’s disease. Eur J Nucl Med 36, 811–822. - PMC - PubMed
    1. Butterfield DA, Halliwell B (2019) Oxidative stress, dysfunctional glucose metabolism and Alzheimer disease. Nat Rev Neurosci 20, 148–160. - PMC - PubMed
    1. Johnson ECB, Dammer EB, Duong DM, Ping L, Zhou M, Yin L, Higginbotham LA, Guajardo A, White B, Troncoso JC, Thambisetty M, Montine TJ, Lee EB, Trojanowski JQ, Beach TG, Reiman EM, Haroutunian V, Wang M, Schadt E, Zhang B, Dickson DW, Ertekin-Taner N, Golde TE, Petyuk VA, De Jager PL, Bennett DA, Wingo TS, Rangaraju S, Hajjar I, Shulman JM, Lah JJ, Levey AI, Seyfried NT (2020) Large-scale proteomic analysis of Alzheimer’s disease brain and cerebrospinal fluid reveals early changes in energy metabolism associated with microglia and astrocyte activation. Nat Med 26, 769–780. - PMC - PubMed
    1. Gibson GE, Sheu K-FR, Blass JP, Baker A, Carlson KC, Harding B, Perrino P (1988) Reduced Activities of thiamine-dependent enzymes in the brains and peripheral tissues of patients with Alzheimer’s disease. Arch Neurol 45, 836–840. - PubMed

Publication types

MeSH terms