. 2020;1(2):zqaa018.
doi: 10.1093/function/zqaa018. Epub 2020 Sep 22.

Impaired Myocardial Energetics Causes Mechanical Dysfunction in Decompensated Failing Hearts

Affiliations

Impaired Myocardial Energetics Causes Mechanical Dysfunction in Decompensated Failing Hearts

Rachel Lopez et al. Function (Oxf). 2020.

Abstract

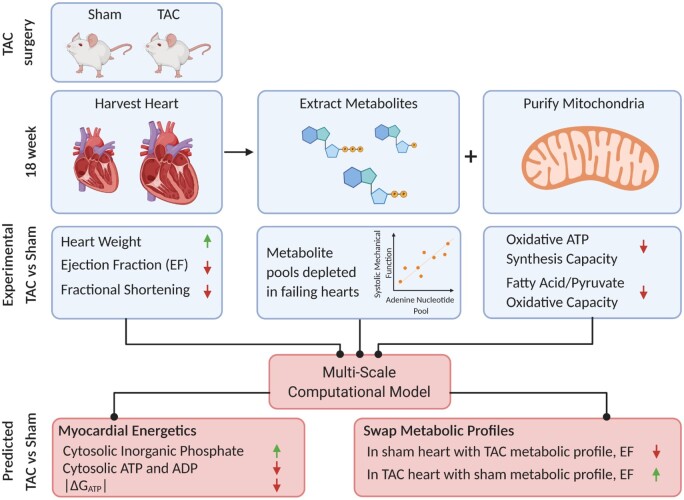
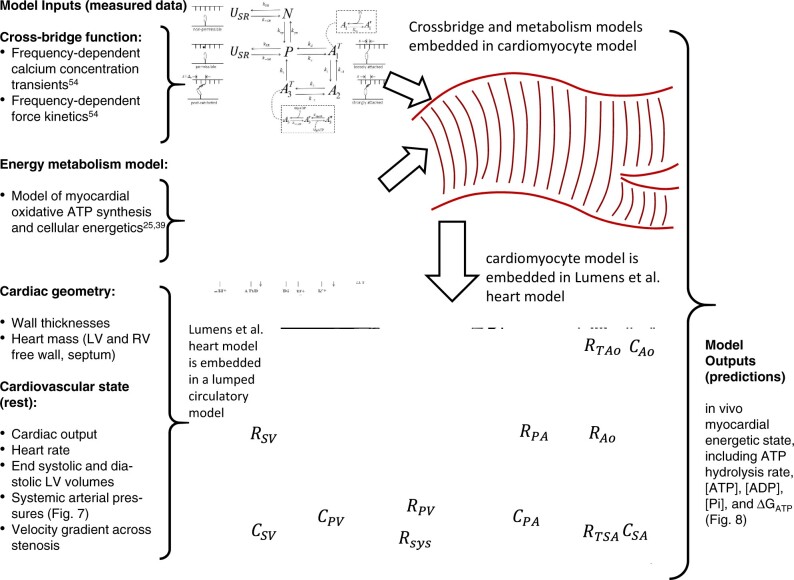
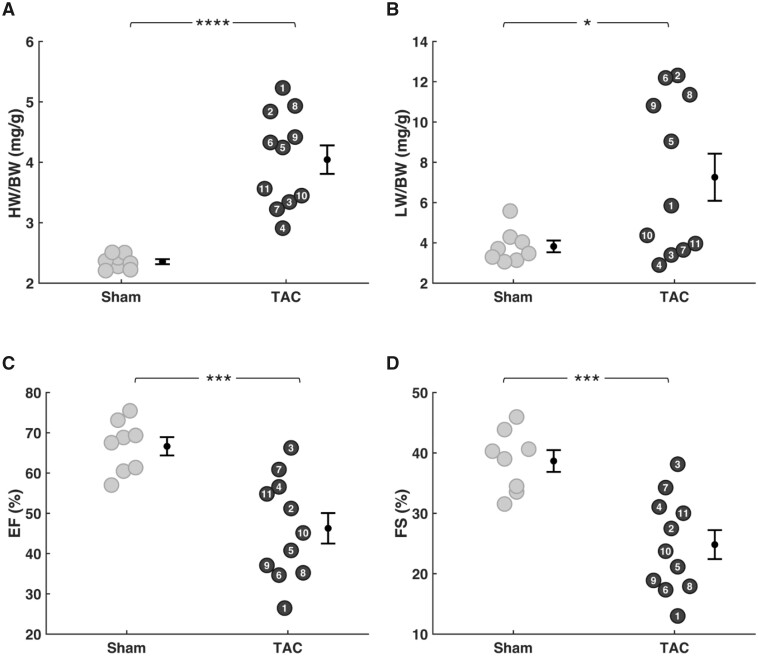
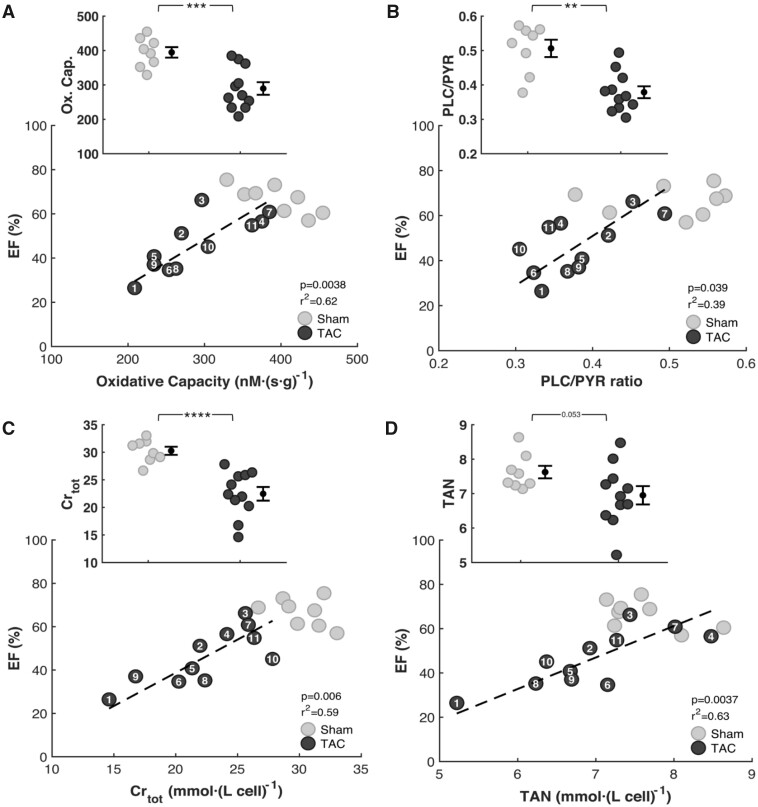
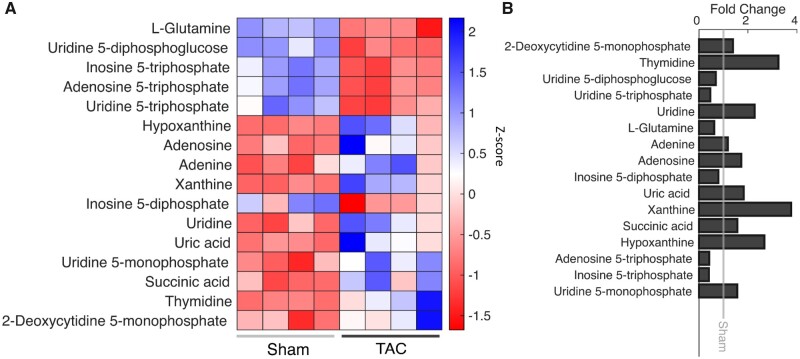
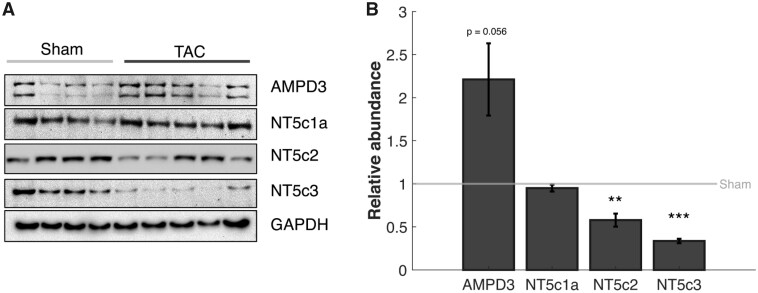
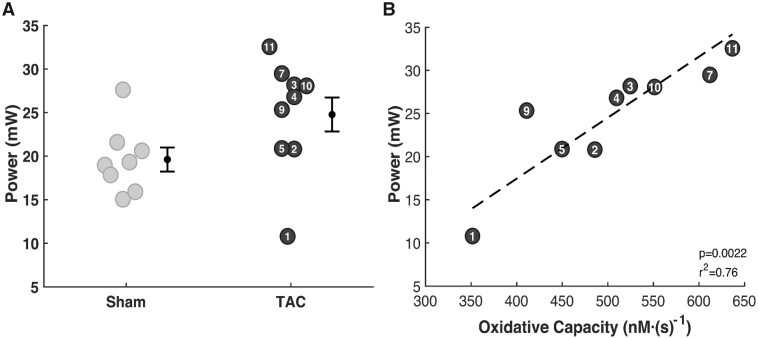
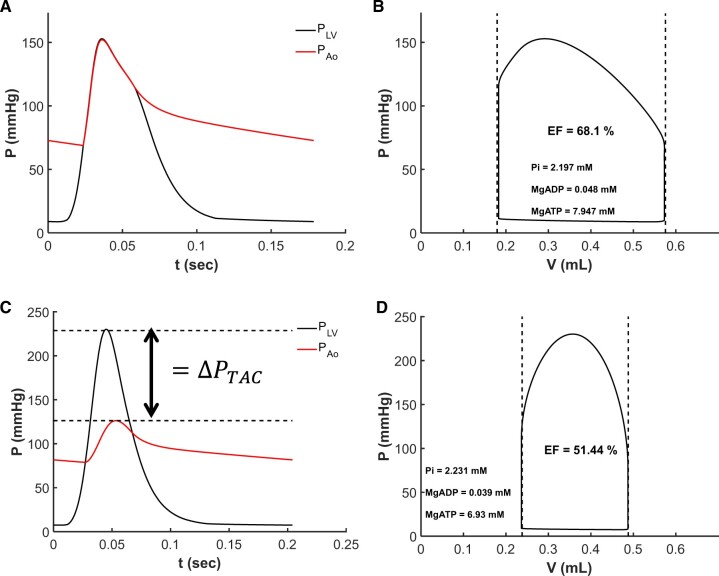
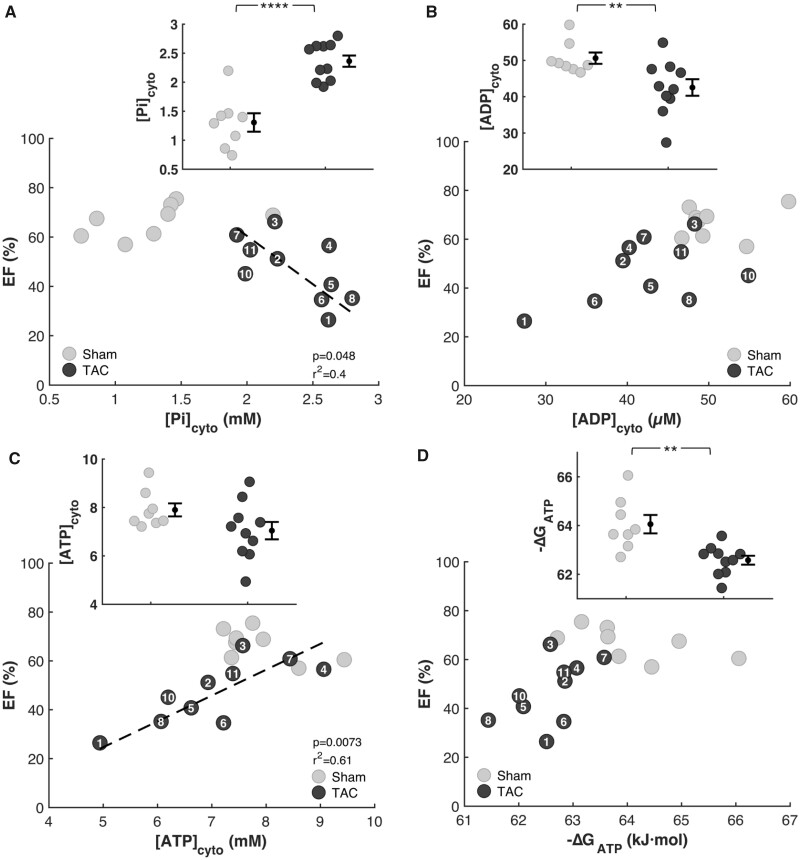
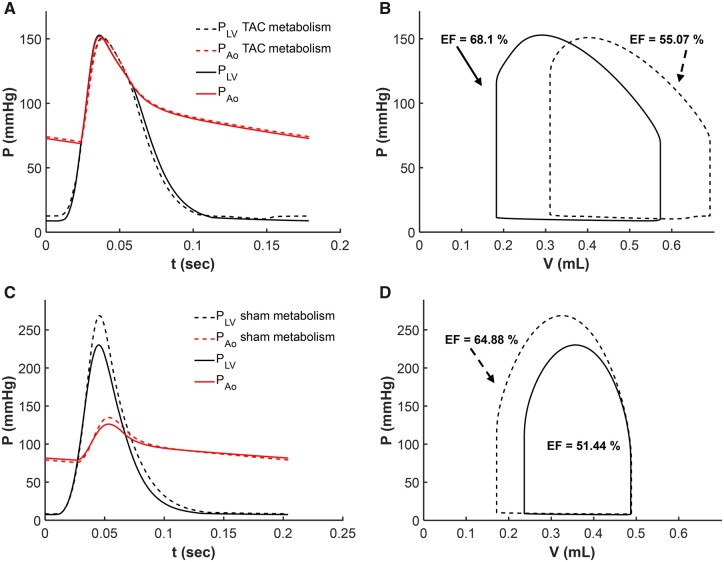
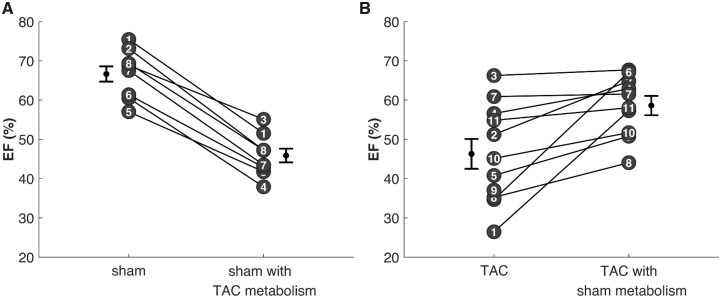
Cardiac mechanical function is supported by ATP hydrolysis, which provides the chemical-free energy to drive the molecular processes underlying cardiac pumping. Physiological rates of myocardial ATP consumption require the heart to resynthesize its entire ATP pool several times per minute. In the failing heart, cardiomyocyte metabolic dysfunction leads to a reduction in the capacity for ATP synthesis and associated free energy to drive cellular processes. Yet it remains unclear if and how metabolic/energetic dysfunction that occurs during heart failure affects mechanical function of the heart. We hypothesize that changes in phosphate metabolite concentrations (ATP, ADP, inorganic phosphate) that are associated with decompensation and failure have direct roles in impeding contractile function of the myocardium in heart failure, contributing to the whole-body phenotype. To test this hypothesis, a transverse aortic constriction (TAC) rat model of pressure overload, hypertrophy, and decompensation was used to assess relationships between metrics of whole-organ pump function and myocardial energetic state. A multiscale computational model of cardiac mechanoenergetic coupling was used to identify and quantify the contribution of metabolic dysfunction to observed mechanical dysfunction. Results show an overall reduction in capacity for oxidative ATP synthesis fueled by either fatty acid or carbohydrate substrates as well as a reduction in total levels of adenine nucleotides and creatine in myocardium from TAC animals compared to sham-operated controls. Changes in phosphate metabolite levels in the TAC rats are correlated with impaired mechanical function, consistent with the overall hypothesis. Furthermore, computational analysis of myocardial metabolism and contractile dynamics predicts that increased levels of inorganic phosphate in TAC compared to control animals kinetically impair the myosin ATPase crossbridge cycle in decompensated hypertrophy/heart failure.

Keywords: cardiac energetics; cardiomyopathy; computational modeling; ejection fraction; heart failure; mechanoenergetic coupling; mitochondria; oxidative respiration; transaortic constriction.


Figures

Graphical Abstract
Graphical Abstract
Figure 1.
Figure 1.
Multiscale Myocardial Mechanoenergetic Function. The model integrates previously developed and validated models of cardiomyocyte dynamics,, myocardial energetics,, whole-organ cardiac mechanics, and a simple lumped parameter closed-loop circulatory system representing the systemic and pulmonary circuits. Data from multiple experimental modalities are used to identify model components for each individual animal in this study. Detailed descriptions of model formulation and implementation are provided in Marzban et al. The model predicts variables representing the in vivo myocardial energetic state, including ATP hydrolysis rate, [ATP], [ADP], [Pi], and the free energy of ATP hydrolysis DGATP in the LV myocardium for each individual animal.
Figure 2.
Figure 2.
Cardiac Hypertrophy and Decompensation in TAC Animals. EF and FS were measured at 18 weeks postsurgery by echocardiography. HW and LW were measured following harvesting the heart and lungs. (A) HW-to-body-weight ratio (HW/BW) and (B) LW-to-body-weight (LW/BW) were normalized to the bodyweight of each rat. Variability in HW and LW was low in sham rats compared to TAC rats. Mean HW/BW and LW/BW were elevated in the TAC group compared to sham group. (C) EF and (D) and FS were both lower in TAC rats compared to sham rats (sham n = 8; TAC n = 11; error bars: SEM; HW/BW P-value: <0.0001; LW/BW P-value: 0.016; EF and FS P-value: 0.0003).
Figure 3.
Figure 3.
Relationships between Heart Function and Cardiac Energetics. Respiratory capacity was assessed from high-resolution respirometry with mitochondria isolated from the apex of the heart 18 weeks postsurgery. Metabolites were extracted from frozen left ventricular and septal heart tissue. (A) Measurements of respiratory capacity on carbohydrate substrate (PYR) show lower ATP synthesis capacity in TAC rats compared to the sham group. Oxidative capacity and EF are correlated in the TAC group. (B) Measurements of the ratio of respiratory capacity on fatty acid oxidative capacity (PLC) to the respiratory capacity on carbohydrate substrate show a decrease in PLC/PYR in TAC rats compared to sham control. CRtot levels (C) TAN levels (D) were depleted in TAC rats compared to control. Reductions in TAN and CRtot are correlated with reductions in EF in the TAC group. (sham n = 8; TAC n = 11; error bars: SEM; Oxidative Capacity P-value:0.0004; CRtotP-value: <0.0001; PLC/PYR P-value: 0.0011).
Figure 4.
Figure 4.
Metabolite Levels Within the Degradation Pathway. KEGG and MBROLE were used to identify significant pathways from a metabolomics screen done on four sham and four TAC samples. (A) A heatmap showing the z-score of significantly different metabolites within the pyrimidine and purine metabolism pathways. Shades of blue signify an increase in abundance, white represents no change, and shades of red represent a decrease in abundance. Metabolites that are increased in TAC rats are associated with degradation of purines and pyrimidines. The decreased metabolites are ones that are being degraded and converted to the metabolites that are increased. (B) This graph shows the fold change of the metabolites in panel A (sham n = 4; TAC n = 4).
Figure 5.
Figure 5.
Regulation of Purine Degradation Pathway. (A) Representative Western blots are shown. Each lane represents a biological replicate. GAPDH is used as a loading control. Two isoforms of 5′-nucleotidase (Nt5c2 and NT5c3) are found to be less abundant in TAC rats compared to control while one (NT5c1a) is unchanged between TAC and control. The AMP deaminase AMPD3 is upregulated in TAC compared to control. (B) Using ImageJ to quantify the Western blots, there is a 42% and 66% decrease in NT5c2 and NT5c3, respectively, and a 121% increase in AMPD3 protein abundance in the TAC rats compared to control (error bar: SEM; NT5C3 P-value: 0.009; NT5C2 P-value: 0.05; sham n = 8; TAC n = 8).
Figure 6.
Figure 6.
Resting Left-Ventricular Mechanical Power Output. (A) Although mean estimated LVPO is higher in TAC rats than in sham controls, the observed difference is not statistically significant. Developed pressure in TAC rats is markedly higher than in controls, while cardiac output tends to be lower. The effects of these two differences on power output tend to counteract one another. (B) Resting LVPO is strongly correlated with oxidative ATP synthesis capacity in the TAC group.
Figure 7.
Figure 7.
Multiscale Model Fits Echocardiography Data. (A and B) Model predicted left-ventricular and aortic pressure over the cardiac cycle and left-ventricular pressure–volume loop for control sham rat #3. (C and D) shows model predicted left-ventricular and aortic pressure over the cardiac cycle and left-ventricular pressure–volume loop for TAC rat #2. Vertical dashed lines in (B) and (D) represent measured end-systolic and end-diastolic left-ventricular volumes. Horizontal dashed lines in (C) represent the estimated pressure drop across the aortic constriction.
Figure 8.
Figure 8.
Myocardial Energetics Is Predicted by Multiscale Computational Model. Model predictions of myocardial phosphate metabolites are plotted against EF for every animal in the study. (A) Cytoplasmic inorganic phosphate [Pi]cyto is predicted to be higher in TAC rats compared to sham and to be inversely correlated with EF. (B) The predicted concentration of cytosolic ADP is lower in the TAC compared to the control group, without a statistically significant correlation with EF. (C) The mean model-predicted concentration of cytosolic ATP in the TAC group was lower than in the control group. However, the difference is not statistically significant. There is, however, as statistically significant correlation between predicted [ATP]cyto and EF. There was no observable change in cytosolic ATP. There was a strong correlation between cytosolic ATP and EF. (D) The predicted free energy of ATP hydrolysis DGATP is lower in the TAC compared to the control group, without a statistically significant correlation with EF (sham n = 8; TAC n = 10; error bars: SEM; Pi P-value: 1.0E-04; ADP P-value: 0.01; ΔGATPP-value: 0.005).
Figure 9.
Figure 9.
Analysis of Effects of Metabolic State on Mechanical Function. Simulations of left-ventricular and aortic pressure (A and C) and left-ventricular pressure–volume loops (B and D) are shown for sham rat #3 and TAC rat #2. The baseline simulations (solid lines) are equivalent to those shown in Fig. 7. Dashed lines in (A) and (B) illustrate model predictions associated with replacing the metabolic model parameter values for sham rat #3 with values representing the mean TAC rat. Imposition of the TAC rat metabolic phenotype on the sham rat results in an increase in inorganic phosphate concentration, diminished systolic contractility, and reduction in EF. Dashed lines in (C) and (D) illustrate model predictions associated with replacing the metabolic model parameter values for TAC rat #2 with values representing the mean sham rat. Imposition of the control sham metabolic phenotype on the TAC rat results in a decrease in inorganic phosphate concentration, improved systolic contractility, and increase in EF.
Figure 10.
Figure 10.
Predicted Impact of Metabolic Dysfunction in Resting Systolic Mechanical Function. The multiscale computational model of myocardial mechanoenergetic coupling was used to predict the effects of changing metabolic status of the myocardium on cardiac mechanical function. (A) The effect of switching the parameterization of the component of the model representing metabolic function for each control sham rat to values of mitochondrial capacity and metabolic pools associated with the mean TAC rat. Predicted EF drop from 67% for the original data to 50% for sham rats with TAC metabolism. (B) The effect of switching the parameterization of the component of the model representing metabolic function for each TAC rat to values of mitochondrial capacity and metabolic pools associated with the mean sham rat. Predicted EF increase from 46% for the original data to 59% for TAC rats with sham metabolism.

Comment in

Similar articles

Cited by

References

    1. Wu F, Zhang EY, Zhang J, et al. Phosphate metabolite concentrations and ATP hydrolysis potential in normal and ischaemic hearts. J Physiol 2008;586(17):4193–4208. - PMC - PubMed
    1. Lassers BW, Kaijser L, Wahlqvist ML, et al.Relationship in man between plasma free fatty acids and myocardial metabolism of carbohydrate substrates. Lancet 1971;2(7722):448–450. - PubMed
    1. Gertz EW, Wisneski JA, Stanley WC, et al. Myocardial substrate utilization during exercise in humans. Dual carbon-labeled carbohydrate isotope experiments. J Clin Invest 1988;82(6):2017–2025. - PMC - PubMed
    1. Viscarra JA, Ortiz RM. Cellular mechanisms regulating fuel metabolism in mammals: role of adipose tissue and lipids during prolonged food deprivation. Metabolism 2013;62(7):889–897. - PMC - PubMed
    1. Liepinsh E, Makrecka M, Kuka J, et al. The heart is better protected against myocardial infarction in the fed state compared to the fasted state. Metabolism 2014;63(1):127–136. - PubMed

Publication types

LinkOut - more resources