. 2020 Oct 19;16(10):e1008968.
doi: 10.1371/journal.ppat.1008968. eCollection 2020 Oct.

Analysis of KSHV B lymphocyte lineage tropism in human tonsil reveals efficient infection of CD138+ plasma cells

Affiliations

Analysis of KSHV B lymphocyte lineage tropism in human tonsil reveals efficient infection of CD138+ plasma cells

Farizeh Aalam et al. PLoS Pathog. .

Abstract

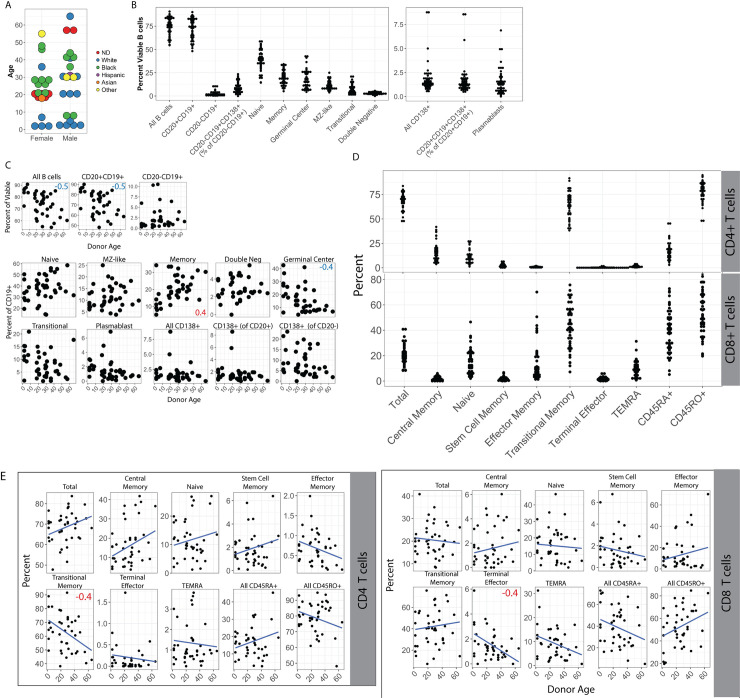
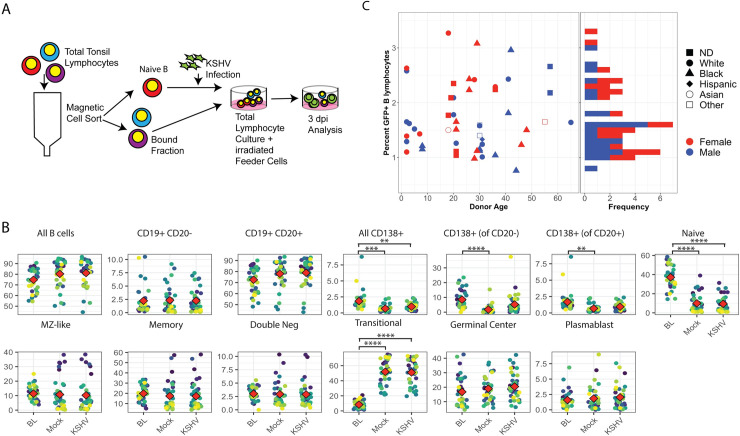
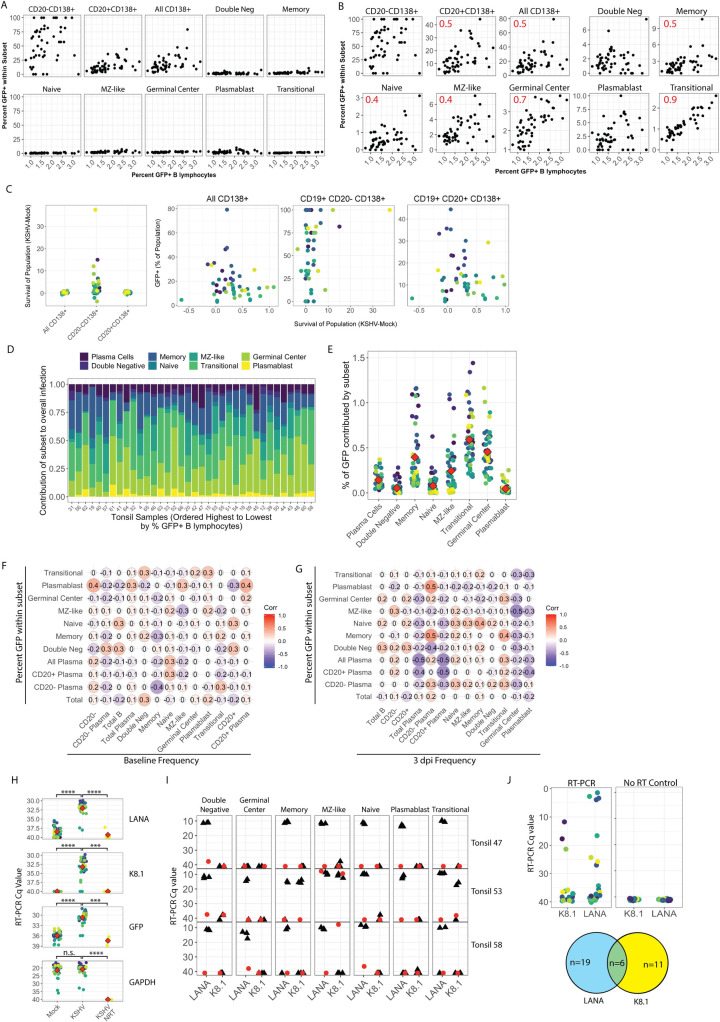
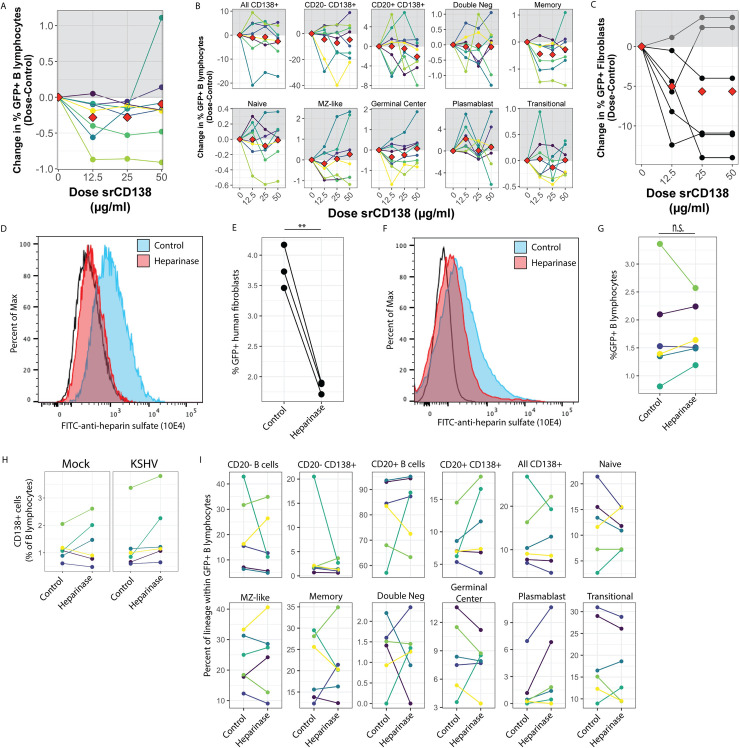
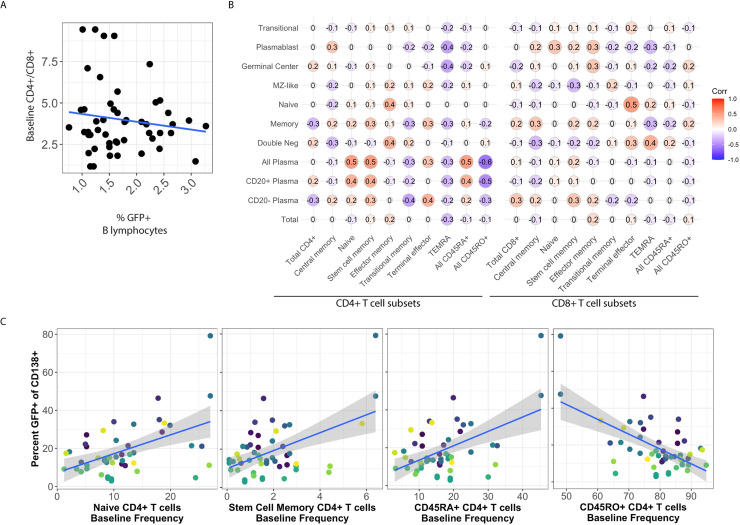
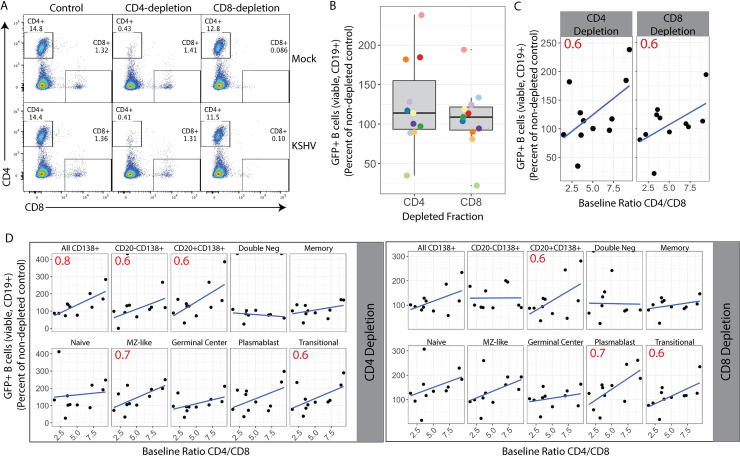
Despite 25 years of research, the basic virology of Kaposi Sarcoma Herpesviruses (KSHV) in B lymphocytes remains poorly understood. This study seeks to fill critical gaps in our understanding by characterizing the B lymphocyte lineage-specific tropism of KSHV. Here, we use lymphocytes derived from 40 human tonsil specimens to determine the B lymphocyte lineages targeted by KSHV early during de novo infection in our ex vivo model system. We characterize the immunological diversity of our tonsil specimens and determine that overall susceptibility of tonsil lymphocytes to KSHV infection varies substantially between donors. We demonstrate that a variety of B lymphocyte subtypes are susceptible to KSHV infection and identify CD138+ plasma cells as a highly targeted cell type for de novo KSHV infection. We determine that infection of tonsil B cell lineages is primarily latent with few lineages contributing to lytic replication. We explore the use of CD138 and heparin sulfate proteoglycans as attachment factors for the infection of B lymphocytes and conclude that they do not play a substantial role. Finally, we determine that the host T cell microenvironment influences the course of de novo infection in B lymphocytes. These results improve our understanding of KSHV transmission and the biology of early KSHV infection in a naïve human host, and lay a foundation for further characterization of KSHV molecular virology in B lymphocyte lineages.


Conflict of interest statement

The authors have declared that no competing interests exist.

Figures

Fig 1
Fig 1. Variablility and age-dependence of B lymphocyte lineage distribution in human tonsils.
(A) Donor demographics for human tonsil specimens used in this study. Plotted by age (y-axis), sex (x-axis) and self-reported race (color) ND = not determined. (B) Frequency distributions of B cell lineages in tonsil specimens (see S1A Fig and Table 2 for lineage definitions). All B cells are shown as frequency of viable lymphocytes, other B cell subsets are shown as frequency of viable, CD19+ B cells unless otherwise specified in parenthesis. (C) Frequency of B cell lineages based on donor age. Pearson correlation coefficients (r) with an absolute value greater than or equal to 0.4 are shown as red or blue inset text in the subset panels. (D) Frequency distributions of T cell lineages in tonsil specimens (see S1B Fig and Table 2 for lineage definitions). All T cells are shown as frequency of viable CD4+ (top) or CD8+ (bottom) T cell except total CD4+ and total CD8+ (far left) which are shown as frequency of viable lymphocytes. (E) Frequency of CD4+ (left) and CD8+ (right) T cell lineages based on donor age. Pearson correlation coefficients (r) with an absolute value greater than or equal to 0.4 are shown as red or blue inset text in the subset panels.
Fig 2
Fig 2. Tonsil-derived B lymphocytes from diverse donors display variable susceptibility to KSHV infection.
(A) Schematic of lymphocyte infection procedure. Untouched naïve B cells are magnetically separated from total lymphocytes and 1e6 naïve B cells are infected per condition. Following infection, bound fractions are added back to reconstitute a total lymphocyte environment and cells are plated on X-ray irradiated CDw32 feeder cells. Analysis is performed by flow cytometry at 3 days post-infection for B cell lineage markers as shown in S1 Fig and Table 2 and GFP reporter expression for KSHV infection. (B) The effect of KSHV infection and the culture system on overall B cell lineage frequency was examined by comparing the frequency of B cell lineages at baseline (BL, unmanipulated samples) and 3 days post infection in Mock infected and KSHV infected cultures. Student’s T test was used to determine statistical significance for all comparisons **p<0.004, ***p<0.0002, ****p<1e-6 (C) Infection frequency data for viable, CD19+GFP+ lymphocytes at 3 dpi n = 50 from 40 tonsil specimens with biological replicates for 10 specimens displayed with respect to donor age (x-axis, left panel), sex (color), and self-reported race (shape, left panel). The histogram in the right panel is included to show the distribution of infection frequencies with the majority of infections resulting in 1–2% GFP+ B lymphocytes at 3 dpi.
Fig 3
Fig 3. B lymphocyte lineage tropism of KSHV.
Naïve B lymphocytes from 40 individual human tonsil specimens (n = 50) were infected with KSHV.219 as in Fig 2A. Cells were collected at 3dpi, stained for B cell lineages as shown in S1A Fig and Table 2 and analyzed flow cytometry for B cell lineages and KSHV infection based on GFP reporter expression. The within-lineage infection frequency (y-axis) as a function of overall B cell infection frequency (x-axis) at 3dpi in for n = 50 infections from 40 individual tonsil specimens shown (A) normalized to 100% or (B) scaled to each individual lineage population. Pearson correlation coefficients (r) with an absolute value greater than or equal to 0.4 are shown in (B) as red inset text in the subset panels. (C) The survival of plasma cell lineages (frequency of viable B lymphocytes in KSHV-Mock samples at 3 dpi) was plotted for all CD138+, CD20-CD138+ and CD20+CD138+ lineages (left panel) and each lineage’s frequency of KSHV infection was plotted against its survival (right three panels) with individual tonsil samples designated by color. Statistical analysis was performed for both linear (Pearson) and monotonic (Spearman) correlations. For all plasma cells r = 0.15, ρ = 0.2; for CD20- plasma cells r = 0.3, ρ = 0.32, for CD20+ plasma cells r = 0.15, ρ = 0.13. The contribution of specific B cell lineages to overall infection in each sample was calculated as % GFP within lineage * % of lineage within viable B cells in each sample, and results are shown in (D) for each tonsil sample ordered from highest to lowest (right to left) based on overall GFP+ B lymphocytes (overall susceptibility) and (E) by lineage with individual samples designated by color and the mean infection frequency of each lineage shown as a red diamond. Correlation matrix analysis showing linear relationships (Pearson’s correlation coefficient) between within-lineage infection frequency and (F) baseline (pre-infection) overall frequency or (G) 3 dpi overall frequency in KSHV-infected cultures for B lymphocytes and their subsets. Statistical power analysis indicates that this dataset can predict correlations at the level of r > |0.4| with alpha = 0.05 and power = 0.8. Thus, r values ≥ 0.4 can be considered a statistically significant correlation for this data. (H) KSHV transcripts LANA and K8.1 as well as GFP and GAPDH transcripts analyzed for n = 20 tonsil specimens by RT-PCR in bulk lymphocyte cultures at 3 dpi. Left panels show Ct values with individual samples designated by color and the mean Ct values for each condition shown as a red diamond. Student’s T-test was used to determine statistical significance for all comparisons ***p<1e-7, ****p<2e-10. (I) At 3 dpi, 10 million KSHV-infected lymphocytes from three tonsil specimens were stained for B lymphocyte surface markers and lineages were sorted into Trizol LS. RNA was extracted, reverse transcribed (black triangles) or amplified without reverse transcriptase (NRT, red circles) and analyzed by nested RT-PCR for viral transcripts in sorted B lymphocyte lineages. (J) At 3 days post-infection, 1 million KSHV-infected B cells from three tonsil specimens were stained for viability, CD19 and CD138. 187 single cells that were viable, CD19+, CD138+ were sorted into 96-well plates and analyzed by nested RT-PCR for viral transcripts. Colors indicate single plasma cells analyzed with RT-PCR (left) or control reactions including no reverse transcriptase (right) The bottom panel is a venn diagram quantitating the number of plasma cells in RT-PCR reactions which amplified for each and both viral transcripts.
Fig 4
Fig 4. CD138 and heparin sulfate proteoglycans as attachment factors for KSHV in B lymphocytes.
(A) Purified KSHV virions were pre-treated with srCD138 protein at indicated concentrations (x-axis) and used for infection of B lymphocytes. Cells were collected at 3dpi, stained for B cell lineages as shown in S1A Fig and Table 2 and analyzed by flow cytometry for lineage frequencies and KSHV infection by GFP reporter expression. 8 experimental replicates of 5 unique tonsil specimens are shown where the average infection rate was 1.8±0.5% in untreated controls. Data is represented as change in GFP+ cells at each dose of srCD138 compared to untreated control. Colors denote individual experimental replicates and red diamonds are the mean change at each dose for all replicates. (B) Data as in (A) for within-subset GFP quantitation. (C) Similar experiments were performed in E6/E7 transformed fibroblasts derived from human tonsils. 6 experimental replicates are shown where the average infection rate was 25.5±16% in untreated controls. Data is represented as change in GFP+ cells as in (A). (D) 1 million E6/E7 transformed human tonsil fibroblasts were treated with 4.5 units of heparinase I/III blend for 24 hours and removal of heparin sulfate proteoglycans was verified by flow cytometry using a heparin sulfate-FITC antibody. Black line indicates no antibody control. (E) Control (untreated) or heparinase-treated fibroblasts were infected with KSHV.219 and analyzed for infection by GFP reporter expression at 3 dpi. Student’s T-test was used to compare control and heparinase-treated cultures for n = 3 experimental replicates p = 0.007. (F) 25 million human tonsil lymphocytes were treated with 9U of heparinase I/III blend and plated on X-ray irradiated CDW32 feeder cells for 24 hours. After incubation removal of heparin sulfate proteoglycans was verified by flow cytometry as in (D). (G) After heparinase treatment lymphocytes were fractionated and infected as shown in Fig 2A and viable, GFP+ B lymphocytes were quantitated by flow cytometry at 3 days post-infection. 6 experimental replicates with 6 tonsil specimens were performed and colors designate unique samples and can be compared between this panel, panel H and panel I. Student’s t-test was performed to compare infection of control and heparinase treated lymphocytes p = 0.969. (H) the recovery of cell surface CD138 HSPG after 3 days of culture was examined by comparing CD138+ cells as a percent of viable B cells in control and heparinase treated samples for both mock and KSHV-infected conditions. Colors indicate unique tonsil specimens. Student’s T-test was performed to compare control vs. heparinase conditions for mock p = 0.57, for KSHV p = 0.52 (I) Data for KSHV-infected cultures at 3dpi with or without heparinase pre-treatment as in (G) showing the level of KSHV infection for specific B cell lineages. Student’s T-test indicates no significant difference comparing control and heparinase treated samples for any lineage.
Fig 5
Fig 5. The donor-specific CD4+ T cell microenvironment influences infection of CD138+ plasma cells.
(A) For each donor, baseline levels of CD4+ T cells/CD8+ T cells is plotted against the overall susceptibility of the specimen based on the percent of GFP+ B lymphocytes at 3 dpi. Blue line indicates least means linear regression. Correlation analysis reveals no significant linear or monotonic relationship between the variables. (B) Pairwise linear correlations (Pearson method) were performed for overall (Total) and lineage-specific KSHV infection at 3 dpi (vertical axis) and baseline T cell subsets as defined in S1 Fig and Table 2. Power analysis reveals that the data set can predict significant correlations at the level of p>|0.4| with alpha = 0.05 and power = 0.8. (C) Scatter plots of significant correlations from (B) between the baseline frequency of CD4+ T cell subsets (x-axis) and KSHV infection of CD138+ plasma cells (y-axis). Blue lines indicate least means linear regression and grey shading is standard error. Colors indicate unique tonsil specimens and can be compared across panels within the figure.
Fig 6
Fig 6. Manipulation of T cell microenvironment alters KSHV tropism for B cell lineages.
Naïve B lymphocytes from 11 human tonsil specimens were infected with KSHV.219 as in Fig 2A, total lymphocytes added back following infection were either untreated or depleted of CD4+ or CD8+ T cells. At 3 days post-infection cells were collected. (A) T cell depletions were validated by flow cytometry and (B) Cells were stained for B cell lineages as shown in S1A Fig and Table 2 and analyzed flow cytometry for lineage frequencies and KSHV infection by GFP reporter expression to determine the change in GFP+ B lymphocytes (viable, CD19+) in CD4 or CD8 depleted samples compared to non-depleted controls. Colors indicate individual tonsil specimens (n = 11). Student’s T test reveals no statistically significant change in GFP+ B cell frequency between either CD4-depleted or CD8-depleted and non-depleted controls. (C) infection data for T cell depletion studies as in (A) plotted against the baseline (pre-infection) CD4/CD8 T cell ratio in the sample. (D) within-lineage infection frequency plotted against baseline (pre-infection) CD4/CD8 T cell ratio. For B and C linear regression of the data is shown as a blue line and Pearson correlation coefficients (r) are shown as red text within panels only for r with an absolute value ≥ 0.6. Statistical power analysis indicates that this dataset can predict correlations at the level of r > |0.7| with alpha = 0.05 and power = 0.8. Thus, r values ≥ 0.7 can be considered a statistically significant correlation for this data.

Similar articles

Cited by

References

    1. Chang Y, Cesarman E, Pessin MS, Lee F, Culpepper J, Knowles DM, et al. Identification of herpesvirus-like DNA sequences in AIDS-associated Kaposi's sarcoma. Science. 1994;266: 1865–1869. 10.1126/science.7997879 - DOI - PubMed
    1. Cesarman E, Chang Y, Moore PS, Said JW, Knowles DM. Kaposi's sarcoma-associated herpesvirus-like DNA sequences in AIDS-related body-cavity-based lymphomas. N Engl J Med. 1995;332: 1186–1191. 10.1056/NEJM199505043321802 - DOI - PubMed
    1. Soulier J, Grollet L, Oksenhendler E, Cacoub P, Cazals-Hatem D, Babinet P, et al. Kaposi“s sarcoma-associated herpesvirus-like DNA sequences in multicentric Castleman”s disease. Blood. 1995;86: 1276–1280. - PubMed
    1. Uldrick TS, Wang V, O'Mahony D, Aleman K, Wyvill KM, Marshall V, et al. An interleukin-6-related systemic inflammatory syndrome in patients co-infected with Kaposi sarcoma-associated herpesvirus and HIV but without Multicentric Castleman disease. CLIN INFECT DIS. 2010;51: 350–358. 10.1086/654798 - DOI - PMC - PubMed
    1. Powles T, Robinson D, Stebbing J, Shamash J, Nelson M, Gazzard B, et al. Highly Active Antiretroviral Therapy and the Incidence of Non-AIDS-Defining Cancers in People With HIV Infection. Journal of Clinical Oncology. 2009;27: 884–890. 10.1200/JCO.2008.19.6626 - DOI - PubMed

Publication types

MeSH terms