Clinical Trial
. 2021 Jan 4;218(1):e20200891.
doi: 10.1084/jem.20200891.

Phenotypic and functional characterization of first-trimester human placental macrophages, Hofbauer cells

Affiliations
Clinical Trial

Phenotypic and functional characterization of first-trimester human placental macrophages, Hofbauer cells

Jake R Thomas et al. J Exp Med. .

Abstract

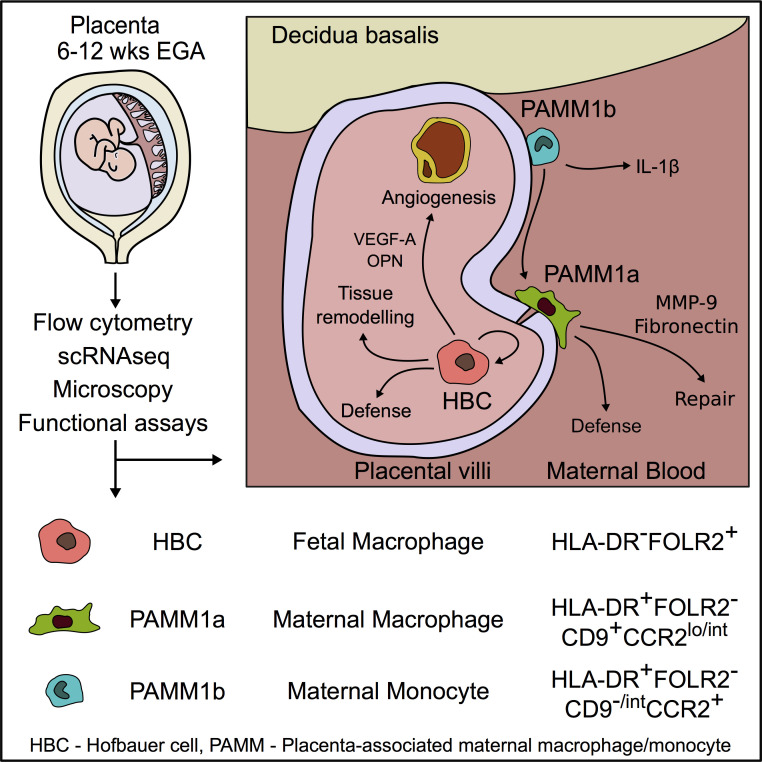
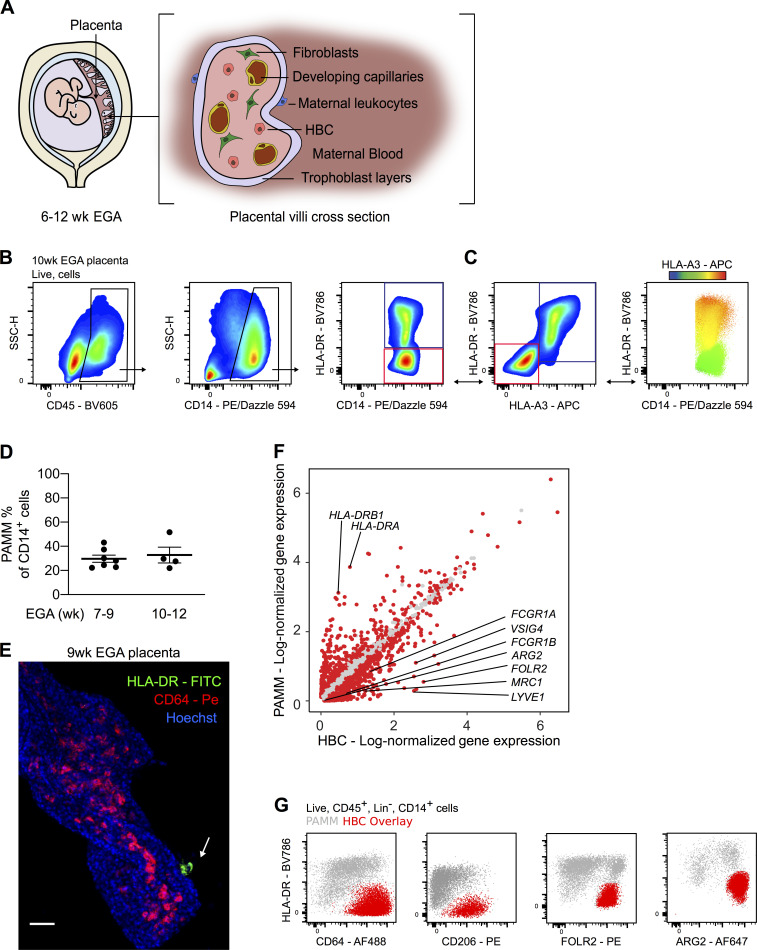
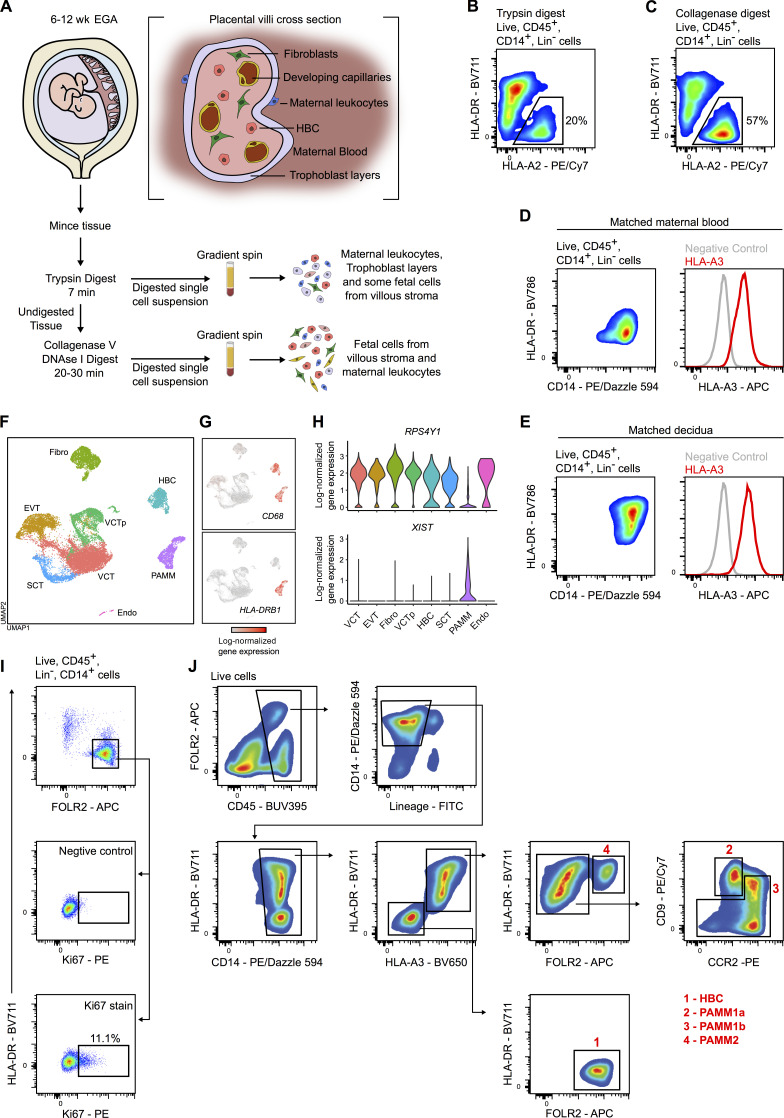
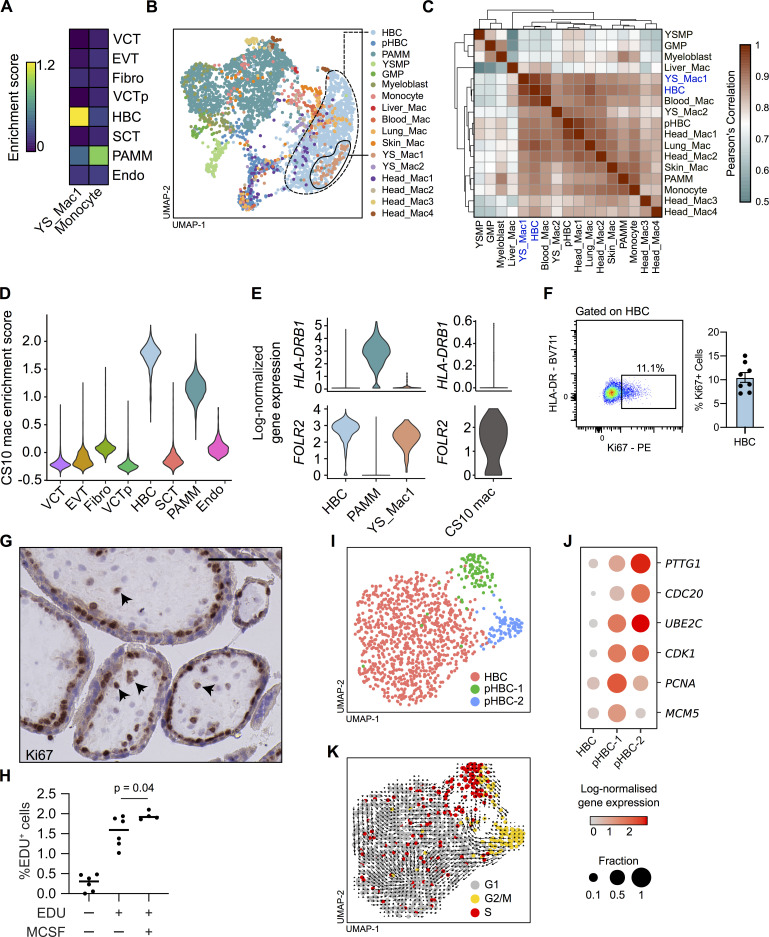
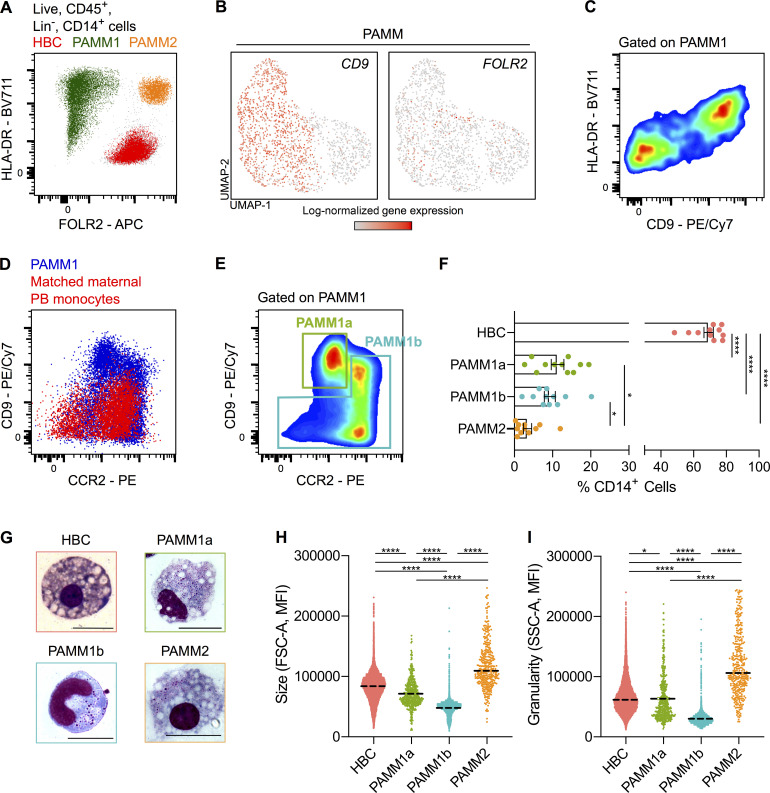
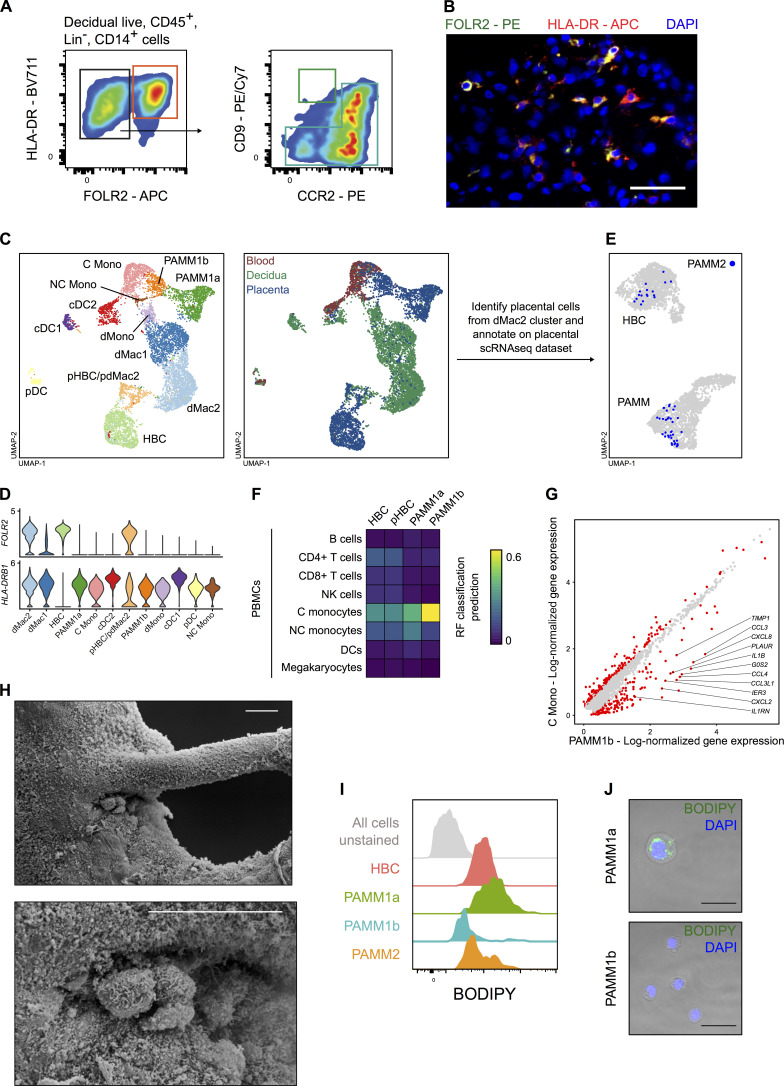
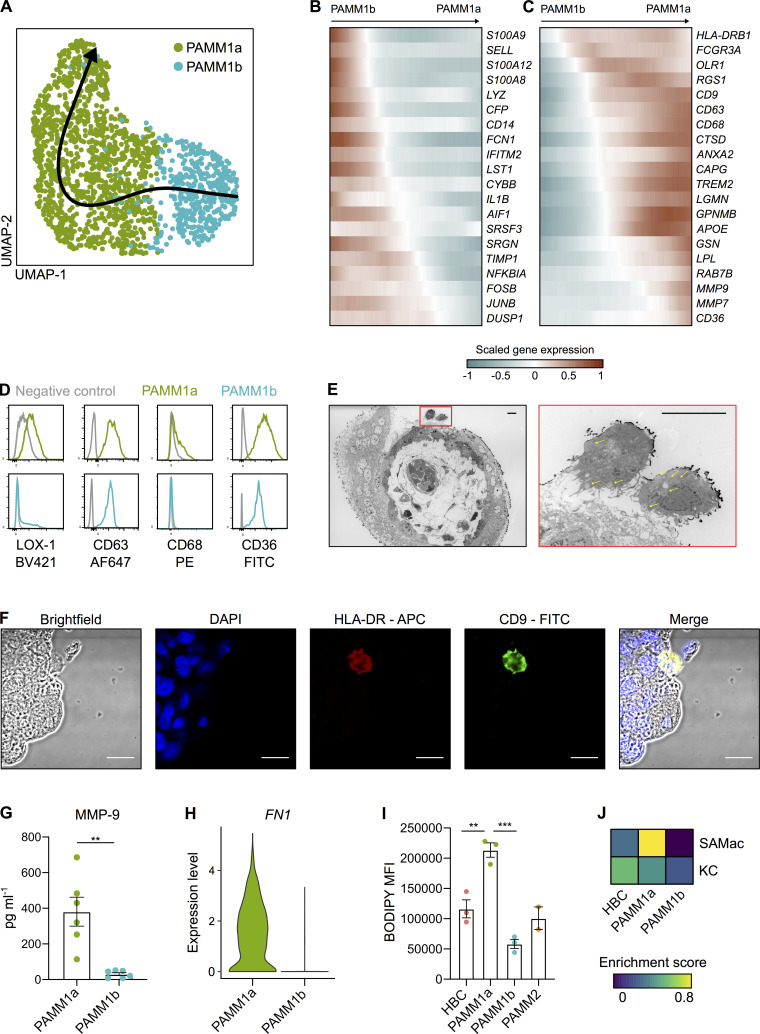
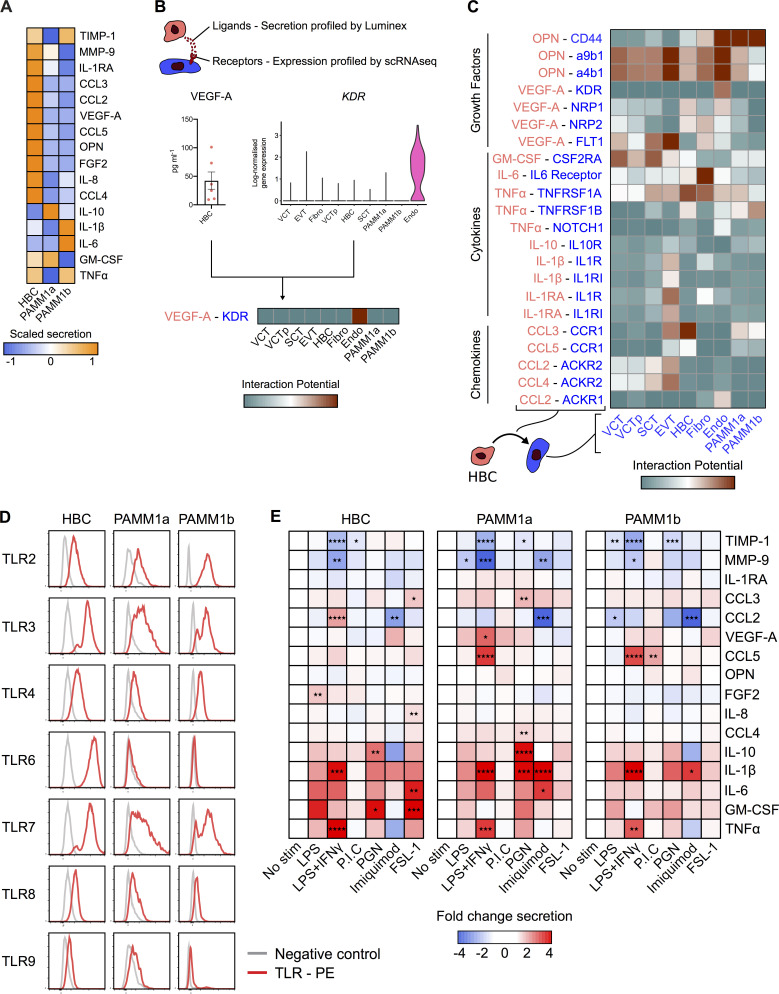
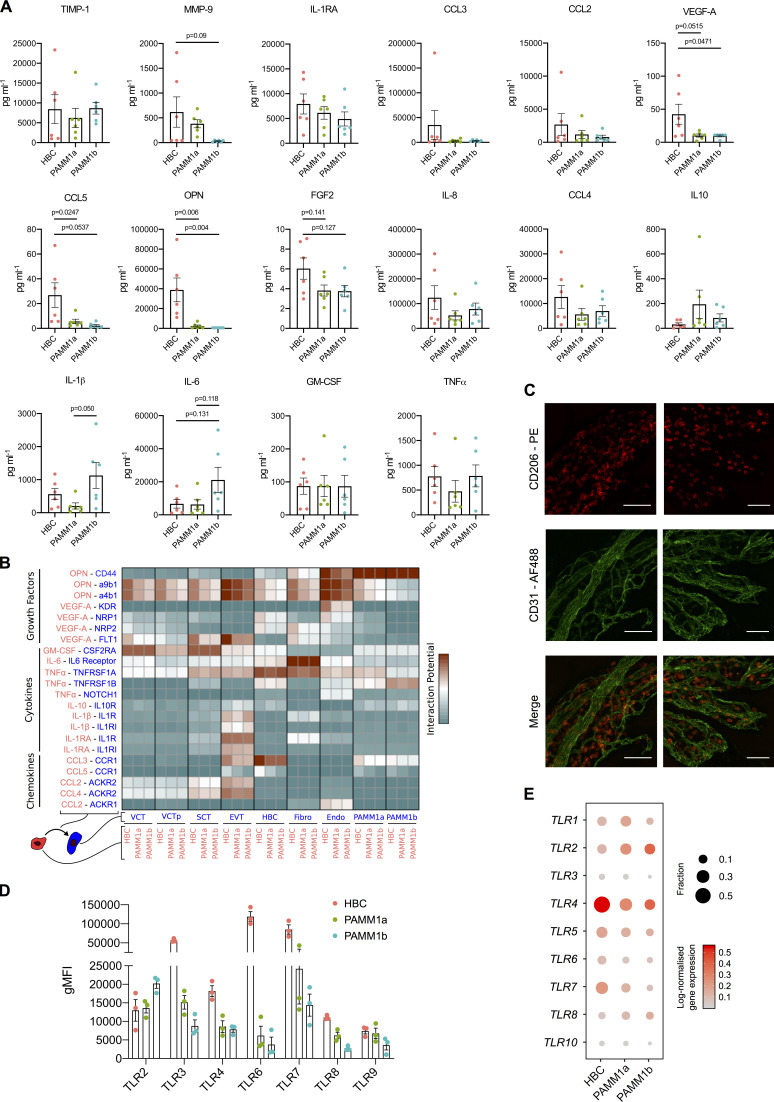
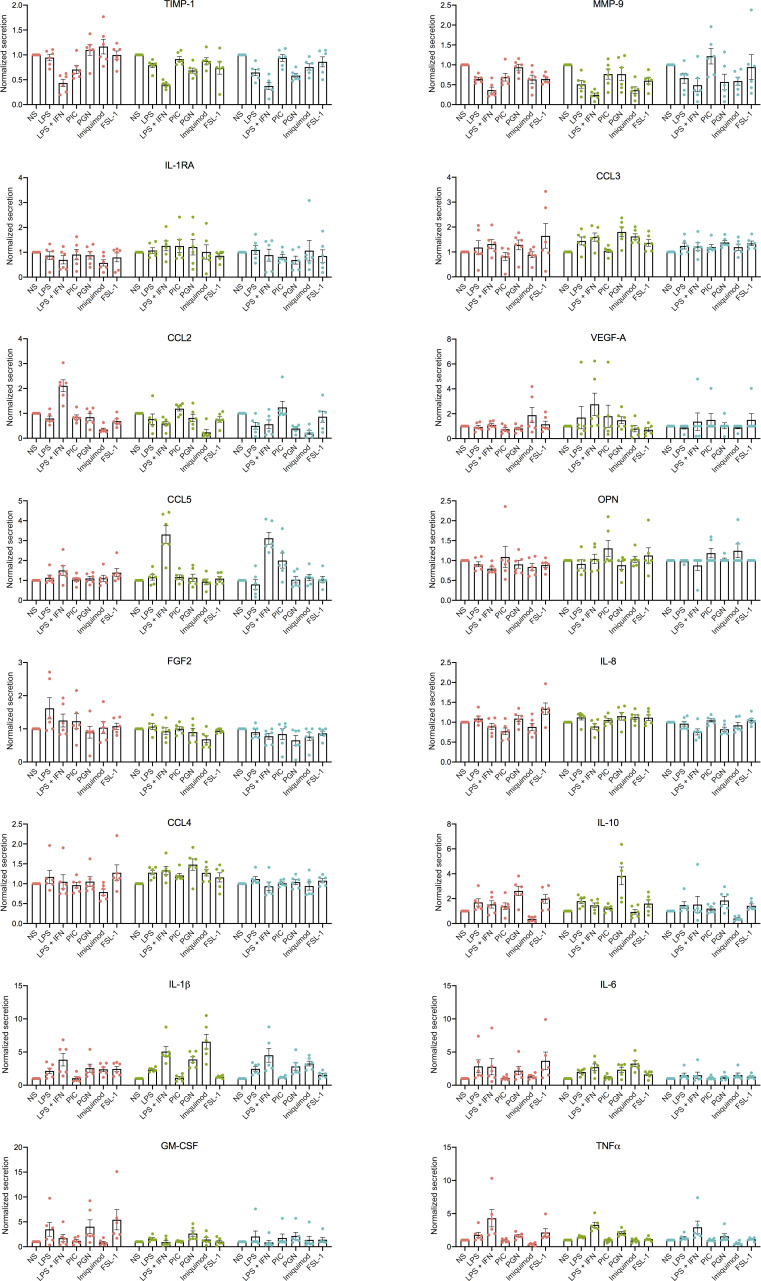
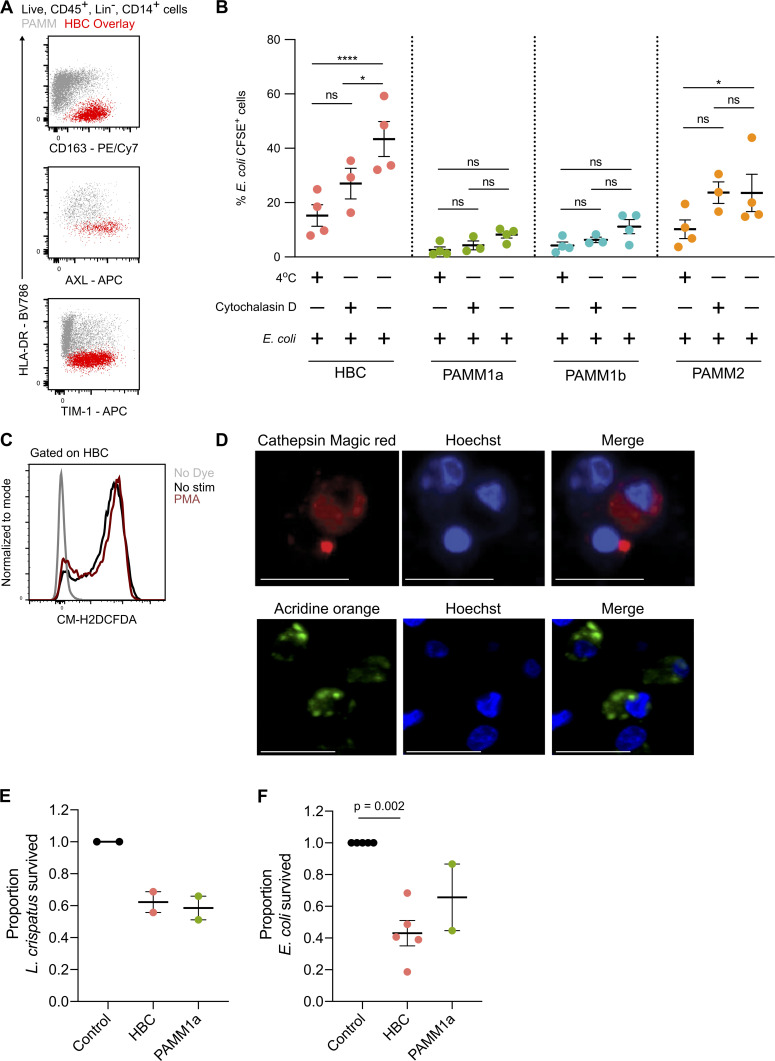
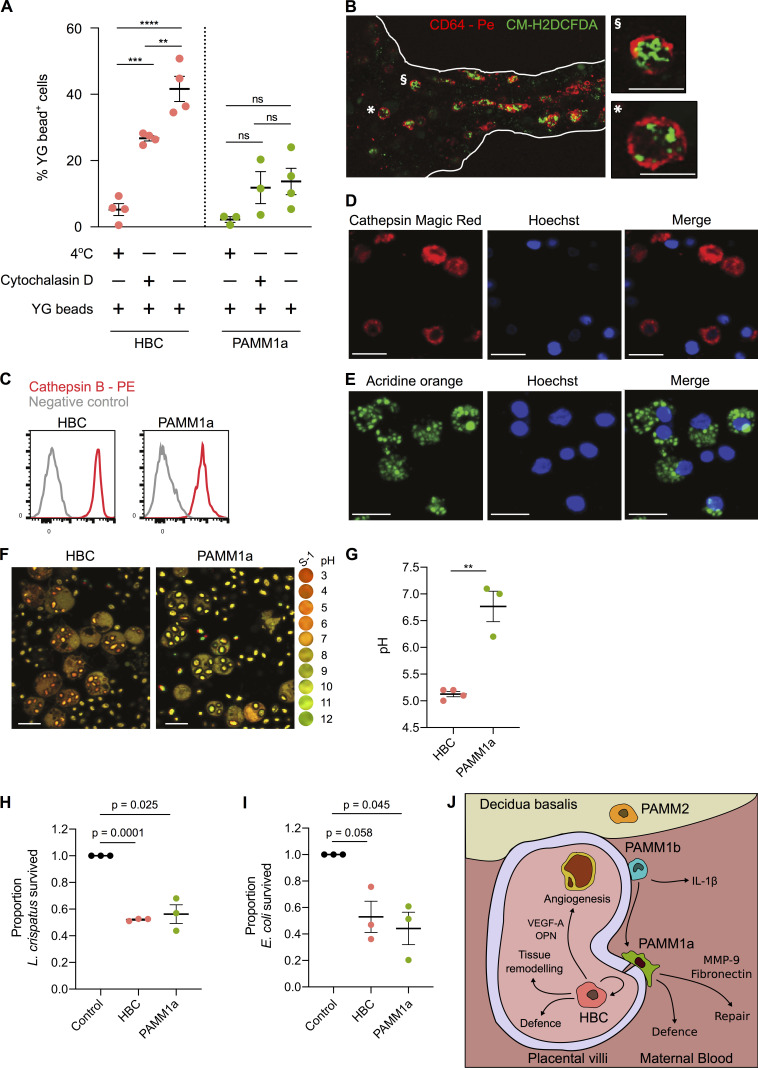
Hofbauer cells (HBCs) are a population of macrophages found in high abundance within the stroma of the first-trimester human placenta. HBCs are the only fetal immune cell population within the stroma of healthy placenta. However, the functional properties of these cells are poorly described. Aligning with their predicted origin via primitive hematopoiesis, we find that HBCs are transcriptionally similar to yolk sac macrophages. Phenotypically, HBCs can be identified as HLA-DR-FOLR2+ macrophages. We identify a number of factors that HBCs secrete (including OPN and MMP-9) that could affect placental angiogenesis and remodeling. We determine that HBCs have the capacity to play a defensive role, where they are responsive to Toll-like receptor stimulation and are microbicidal. Finally, we also identify a population of placenta-associated maternal macrophages (PAMM1a) that adhere to the placental surface and express factors, such as fibronectin, that may aid in repair.


Conflict of interest statement

Disclosures: The authors declare no competing interests exist.

Figures

None
Graphical abstract
Figure 1.
Figure 1.
Anti-HLA antibodies allow for the specific identification of HBCs by flow cytometry. (A) Schematic drawing of the human placenta and a villous cross section. (B) Representative flow cytometric gating strategy identifying two placental macrophage populations based on HLA-DR expression. Blue gate, HLA-DR+ macrophages. Red gate, HLA-DR macrophages. (C) Differential expression of HLA-A3 within the CD14+ macrophage gate, shown by biaxial plot and heatmap overlay. Maternal macrophages are indicated by the blue gate (HLA-DR+HLA-A3+), and fetal macrophages are indicated by the red gate (HLA-DRHLA-A3). Bidirectional arrows depict equivalent cells. (D) Quantification of the abundance of PAMM within CD14+ placental cell suspensions across the indicated EGA. Each data point indicates a separate donor (n = 11). (E) Whole-mount immunofluorescence of a placental villus, where HBCs stained with CD64 (red) are within villous stroma and PAMMs stained with HLA-DR (green, white arrow) are on the syncytial layer. Cell nuclei are stained with Hoechst (blue). Scale bar, 50 µm. Representative image of n = 3 experiments. (F) Scatterplot showing log-normalized gene expression of HBC (x axis) and PAMM (y axis) clusters derived from scRNA-seq data analysis. Red dots represent genes that are differentially expressed with an adjusted P value < 0.01 (Wilcoxon rank sum test). (G) Flow cytometric analysis of expression of indicated markers by HBCs (identified with anti-HLA antibodies in red overlay) and PAMMs (gray). Representative plots of n = 3 experiments. Data are represented as mean ± SEM (D). SSC-H, side scatter height.
Figure S1.
Figure S1.
Isolation and characterization of placental macrophage populations. (A) Schematic representation of a digestion protocol used to isolate placental cells (Tang et al., 2011). (B and C) Flow cytometric analysis of fetal myeloid cells (HLA-A2+) from the same sample digested with either trypsin alone (B) or trypsin and collagenase (C). HBCs (black gate) and PAMMs are identified in both steps of the digestion process. (D and E) Flow cytometric analysis of maternal peripheral blood monocytes (D) and decidual CD14+ cells (E), matched with the placental sample shown in Fig. 1, B and C. (F) UMAP visualization of 22,618 placental single-cell transcriptomes (Vento-Tormo et al., 2018). Endo, endothelial cells; EVT, extravillous trophoblast; Fibro, fibroblasts; VCT, villous cytotrophoblast; VCTp, proliferating villous cytotrophoblast. (G) UMAP visualization with overlays of CD68 and HLA-DRB1 log-normalized gene expression. (H) Violin plots showing log-normalized gene expression of RSP4Y1 and XIST for one male fetal donor from the scRNA-seq dataset. (I) Flow cytometric plots showing the gating strategy and representative Ki67 staining for HBCs (n = 8). (J) Representative flow cytometric plots for gating strategy used to isolate HBC and PAMM populations for phenotypic, morphological, and functional analysis. For the donor shown, maternal and fetal cells are HLA-A3+ and HLA-A3, respectively.
Figure 2.
Figure 2.
First-trimester HBCs are transcriptionally similar to primitive macrophages and proliferate in situ. (A) Heatmap of placental scRNA-seq cluster mean enrichment scores for extraembryonic YS macrophage and embryonic monocyte gene signatures (Bian et al., 2020). Endo, endothelial cells; EVT, extravillous trophoblast; Fibro, fibroblasts; VCT, villous cytotrophoblast; VCTp, proliferating villous cytotrophoblast. (B) UMAP visualization of 3,846 single-cell transcriptomes from first-trimester placenta and embryonic myeloid cells (Bian et al., 2020). GMP, granulocyte–monocyte progenitors; pHBC, proliferating HBCs; YS_Mac, YS macrophage; YSMP, YS-derived myeloid-biased progenitors. (C) Heatmap depicting transcriptomic similarity between annotated clusters. Clusters are ordered according to hierarchical clustering. HBCs and YS_Mac1s are highlighted in blue. (D) Violin plot of placental scRNA-seq cluster enrichment scores for primitive macrophages from a CS10 embryo (Zeng et al., 2019). (E) Violin plots of HLA-DRB1 and FOLR2 log-normalized gene expression in HBCs, PAMMs, YS_Mac1s, and CS10 macrophages. (F) Representative flow cytometric plot and quantification of Ki67 expression by HBCs (n = 8). (G) Representative immunohistochemistry analysis of Ki67 expression in placental tissue sections. Arrowheads indicate Ki67+ cells. Scale bar, 100 µm. (H) Incorporation of EdU into FACS-isolated HBCs after 18 h culture, with and without the addition of M-CSF (n ≥ 4); P value was calculated by one-way ANOVA. (I) UMAP visualization of 1,091 HBC single-cell transcriptomes identifying two proliferating HBC populations. (J) Dotplot heatmap of log-normalized gene expression of genes associated with stages of the cell cycle in HBC clusters. Dot size represents fraction of cells with nonzero expression. (K) UMAP visualization of HBCs with cells colored by predicted cell cycle state, as determined by cell cycle scoring, with RNA velocity vector field projection calculated from all genes in all cells (arrows) overlain. Data are represented as mean ± SEM (F) or mean alone (H).
Figure 3.
Figure 3.
PAMMs are a heterogeneous population comprised of three subsets based on their expression of FOLR2, CD9 and CCR2 expression. (A) Expression of FOLR2 and HLA-DR by flow cytometry reveals three major populations of placental macrophages: HBC (red), PAMM1 (green), and PAMM2 (orange). (B) UMAP visualization of 1,687 PAMM single-cell transcriptomes from first-trimester placenta, with overlays of CD9 and FOLR2 log-normalized gene expression. (C) Heterogeneous expression of CD9 within PAMM1 by flow cytometry. (D) Overlay flow cytometric plots of PAMM1 (blue) and peripheral blood (PB) monocytes from matched maternal blood (red) of CD9 and CCR2 expression. (E) Flow cytometric plot of CD9 and CCR2 expression within PAMM1s, showing representative gates for the identification of PAMM1a and PAMM1b. (F) Enumeration of HBC and PAMM populations as a percentage of total CD14+ cells from placental cell suspensions (n = 11). P values were calculated by one-way ANOVA with Tukey’s multiple-comparisons test. (G) Representative Giemsa-Wright–stained cytospins of HBC and PAMM subsets isolated by FACS. Scale bars, 20 µm. (H) Forward scatter (FSC-A) and (I) side scatter (SSC-A) mean fluorescence intensity (MFI) of HBC and PAMM subsets. P values were calculated by one-way ANOVA with Tukey’s multiple-comparisons test. Data are represented as mean ± SEM (F) or mean alone (H and I). *, P ≤ 0.05; ****, P ≤ 0.0001.
Figure S2.
Figure S2.
Identification of PAMM populations. (A) Flow cytometric analysis of decidual CD14+ cells. Cells with a phenotype consistent with PAMM2 (FOLR2+ HLA-DR+; red gate) and PAMM1b (blue gate) were readily identified. Cells with a phenotype consistent with PAMM1a were low in abundance (green gate). Representative flow cytometric plots from n = 3 experiments. (B) Identification of HLA-DR+ (red) FOLR2+ (green) macrophages in the decidua by fluorescence microscopy. Cell nuclei are stained with DAPI (blue). Scale bar, 50 µm. Representative image of n = 2 experiments. (C) UMAP visualization of 9,474 myeloid cells from placenta, decidua, and maternal blood (Vento-Tormo et al., 2018). Cells are colored and labeled by cluster identity (left panel) and tissue of origin (right panel). cDC1, conventional type 1 dendritic cells; cDC2, conventional type 2 dendritic cells; C mono, classical monocytes; dMac1, decidual macrophages 1; dMac2, decidual macrophages 2; dMono, decidual monocytes; NC Mono, nonclassical monocytes; pDC, plasmacytoid dendritic cells; pHBC/pdMac2, proliferating HBCs and dMac2s. (D) Violin plots showing log-normalized gene expression of FOLR2 and HLA-DRB1 in placental, decidual, and maternal blood myeloid cells. (E) Annotation of PAMM2 (placental cells within dMac2 cluster; blue) onto original UMAP embedding of HBCs and PAMMs from the placental scRNA-seq dataset (Fig. S1 F). (F) Heatmap of transcriptional similarity between placental macrophage/monocyte cell clusters and indicated PBMC populations, as determined using a random forest (RF) classification prediction. DC, dendritic cell; NK, natural killer; p-HBC, proliferating HBC. (G) Scatterplot showing log-normalized gene expression of PAMM1b (x axis) and maternal blood classical monocyte (y axis) clusters. Red dots represent genes that are differentially expressed with an adjusted P value < 0.01 (Wilcoxon rank sum test). (H) Scanning electron micrographs of PAMM1a on the surface of a first-trimester placenta, adhering to a site of damage on a branching villus. Scale bars, 20 µm. (I) Representative flow cytometric histograms of BODIPY staining within HBC and PAMM subsets compared with unstained cells (gray). (J) Images of BODIPY staining of FACS-isolated PAMM1a and PAMM1b. Scale bars, 20 µm. Representative images of n = 2 experiments.
Figure 4.
Figure 4.
PAMM1 undergo a monocyte-to-macrophage transition and adopt a tissue-repair phenotype on the placental surface. (A) UMAP visualization of 1,687 PAMM single-cell transcriptomes with Slingshot trajectory overlain. (B and C) Heatmaps of smoothed scaled gene expression of selected genes that are down-regulated (B) and up-regulated (C) during PAMM1b to PAMM1a differentiation, ordered according to Slingshot trajectory. (D) Relative surface expression of markers identified in C in PAMM1a (green) and PAMM1b (cyan), compared with fluorescence minus one (FMO) control (gray), measured by flow cytometry. Representative plots of n = 3. (E) Transmission electron microscopy of first-trimester placental villous cross section. PAMM1a can be observed on the placental surface, localized to sites of damage to the syncytial layer (red inset). PAMM1a’s are loaded with lipid droplets (arrows). Scale bars, 20 µm. (F) Identification of CD9+ (green) HLA-DR+ (red) PAMM1a cells on the surface of a 9-wk EGA placental sample by fluorescence microscopy. Representative image of n = 3 experiments. Cell nuclei are stained with DAPI (blue). Scale bars, 20 µm. (G) Secretion of MMP-9 by FACS-isolated PAMM1a and PAMM1b after overnight culture (n = 6). P value calculated by unpaired t test. (H) Log-normalized gene expression of fibronectin (FN1) in PAMM1a and PAMM1b clusters, as determined from scRNA-seq data. (I) Analysis of intracellular neutral lipid content by flow cytometry following staining with BODIPY; mean fluorescence intensity (MFI) of HBC and PAMM subsets is shown. P values calculated by one-way ANOVA with Tukey’s multiple-comparisons test. (J) Heatmap of placental macrophage mean enrichment scores for KC and SAMac gene signatures (Ramachandran et al., 2019). Data are represented as mean ± SEM. **, P ≤ 0.01; ***, P ≤ 0.001.
Figure 5.
Figure 5.
HBC and PAMM subsets display distinct cytokine secretion profiles at the steady state and in response to TLR stimulation. (A) Heatmap of average scaled cytokine, chemokine, and growth factor secretion from FACS-isolated HBCs, PAMM1a, and PAMM1b after overnight culture without stimulation (n = 6). (B) Schematic representation of inferred cell–cell interactions from Luminex and scRNA-seq data. Lower panel shows an example of predicted interactions between HBCs and other placental cells based on VEGF-A and kinase insert domain receptor (KDR). (C) Heatmap of predicted interactions between HBC (red) and other placental cell populations (blue). Interaction potentials were calculated from expression of ligands determined by protein secretion, and scRNA-seq expression of cognate receptors. (D) Relative flow cytometric expression of TLRs in HBCs, PAMM1a, and PAMM1b compared with FMO control (gray). Plots are representative of n = 3 experiments. (E) Heatmaps showing the fold change in cytokine secretion of FACS-isolated HBCs, PAMM1a, and PAMM1b cultured overnight with TLR stimulation relative to no stimulation (No stim; n = 6). PGN, peptidoglycan. P.I.C., polyinosinic-polycytidylic acid. P values were calculated by two-way ANOVA with Dunnett’s multiple-comparisons test. *, P ≤ 0.05; **, P ≤ 0.01; ***, P ≤ 0.001; ****, P ≤ 0.0001.
Figure S3.
Figure S3.
HBC, PAMM1a, and PAMM1b secretome analysis in steady-state and TLR expression. (A) Cytokine, chemokine, and growth factor secretion of FACS-isolated HBCs, PAMM1a, and PAMM1b after 18 h in culture without stimulation, profiled by Luminex (n = 6). P values were calculated by one-way ANOVA with Tukey’s multiple-comparisons test. Only significant P values and P values approaching significance are shown. (B) Heatmap of predicted interactions among HBCs, PAMM1a, and PAMM1b (red), and other placental cell populations (blue). Interaction potentials were calculated from expression of ligands determined by protein secretion and scRNA-seq expression of cognate receptors. Endo, endothelial cells; EVT, extravillous trophoblast; Fibro, fibroblasts; VCT, villous cytotrophoblast; VCTp, proliferating villous cytotrophoblast. (C) Whole-mount immunofluorescence of placental villi stained for CD206 (red) and CD31 (green). Images are from two independent donors, both at 9 wk EGA. Scale bar, 100 µm. (D) Quantification of expression of TLRs in HBCs, PAMM1a, and PAMM1b, as profiled by flow cytometry (n = 3). gMFI, geometric mean fluorescence intensity. (E) Dotplot heatmap of log-normalized gene expression of TLR genes in HBC and PAMM scRNA-seq clusters. Dot size represents fraction of cells with nonzero expression. TLR-9 was not detected in the analysis. Data are represented as mean ± SEM.
Figure S4.
Figure S4.
HBC, PAMM1a, and PAMM1b secretome analysis in response to TLR stimulation. Normalized cytokine, chemokine, and growth factor secretion of FACS-isolated HBCs, PAMM1a, and PAMM1b after 18 h in culture with TLR stimulation, relative to without stimulation (HBC, red; PAMM1a, green; PAMM1b, cyan). Profiled by Luminex (n = 6). Data are represented as mean ± SEM. NS, no stimulation control; PGN, peptidoglycan; P.I.C., polyinosinic-polycytidylic acid.
Figure S5.
Figure S5.
Phagocytic and antibacterial capacity of HBCs and PAMM1a. (A) Flow cytometric plots of scavenger receptor expression in HBCs (red) and PAMMs (gray). Representative plots of n = 3 experiments. (B) Phagocytosis of CFSE-labeled E. coli by HBC, PAMM1a, PAMM1b, and PAMM2 subsets measured by flow cytometry. P values were calculated by two-way ANOVA with Tukey’s multiple-comparisons test (n ≥ 3). (C) Representative flow cytometric plot of CM-H2DCFDA staining in FACS-isolated HBCs with no stimulation (black) and with PMA (red) relative to no stain (gray; representative plot from n = 3 experiments). (D) Cathepsin B activity, determined by cathepsin B Magic Red staining, and AO staining of lysosomes in FACS-isolated PAMM1a co-cultured with zymosan particles. Scale bars, 20 µm. Representative images of n = 3 experiments. (E and F) Rates of L. crispatus (E) and E. coli (F) killing by HBCs and PAMM1a after 1 h co-culture at an MOI of 10 relative to negative control, where no cells were added. P values were calculated by one sample t test (n ≥ 2). Data are represented as mean ± SEM. ns, not significant (P > 0.05); *, P ≤ 0.05; ****, P ≤ 0.0001.
Figure 6.
Figure 6.
HBCs are capable of mounting a microbicidal response. (A) Phagocytosis of Fluoresbrite Yellow Green Microspheres (YG beads) by FACS-isolated HBC and PAMM1a measured by flow cytometry. P values were calculated by two-way ANOVA with Tukey’s multiple-comparisons test (n ≥ 3). (B) Whole-mount immunofluorescence microscopy of a placental villus showing CD64 expression (red) and ROS-dependent probe CM-H2DCFDA (green). Edges of villus are indicated by white lines. Right panels show magnification of individual cells, denoted by symbols. Scale bars, 20 µm. Representative image of n = 3 experiments. (C) Relative expression of cathepsin B in HBCs and PAMM1a to FMO control (gray), measured by flow cytometry (n = 3). (D) Cathepsin B activity in FACS-isolated HBCs, co-cultured with zymosan particles, determined by cathepsin B Magic Red staining. Scale bars, 20 µm. Representative images of n = 3. (E) AO staining of lysosomes in FACS-isolated HBCs co-cultured with zymosan particles. Scale bars, 20 µm. Representative images of n = 3 experiments. (F and G) Comparison of the phagosomal pH of HBCs and PAMM1a. (F) Representative images of phagosomal pH of FACS-isolated HBCs and PAMM1a after co-culture with Carboxy S-1–labeled zymosan particles for 20 min. The cytosol is labeled with 5- (and 6-) carboxy S-1 acetoxymethyl (S-1-AM) ester, a cell-permeant pH indicator. Right panel shows the pH scale. (G) Quantification of phagosomal pH; each data point represents an average of >100 measurements per separate donor (n ≥ 3). P value was calculated by unpaired t test. (H and I) Rates of L. crispatus (H) and E. coli (I) killing by HBCs and PAMM1a after 1 h co-culture at an MOI of 1, relative to negative control, where no macrophages were added. P values were calculated by a one-sample t test (n = 3). (J) Schematic depicting locations and subset-specific roles of placental macrophages. Data are represented as mean ± SEM. ns, not significant (P > 0.05); **, P ≤ 0.01; ***, P ≤ 0.001; ****, P ≤ 0.0001.

Comment in

References

    1. Arany E., and Hill D.J.. 1998. Fibroblast growth factor-2 and fibroblast growth factor receptor-1 mRNA expression and peptide localization in placentae from normal and diabetic pregnancies. Placenta. 19:133–142. 10.1016/S0143-4004(98)90001-7 - DOI - PubMed
    1. Bian Z., Gong Y., Huang T., Lee C.Z.W., Bian L., Bai Z., Shi H., Zeng Y., Liu C., He J., et al. . 2020. Deciphering human macrophage development at single-cell resolution. Nature. 582:571–576. 10.1038/s41586-020-2316-7 - DOI - PubMed
    1. Böckle B.C., Sölder E., Kind S., Romani N., and Sepp N.T.. 2008. DC-sign+ CD163+ macrophages expressing hyaluronan receptor LYVE-1 are located within chorion villi of the placenta. Placenta. 29:187–192. 10.1016/j.placenta.2007.11.003 - DOI - PubMed
    1. Boyd J.D. and Hamilton W.J.. 1970. Stroma of villi. In The Human Placenta. Heffer, Cambridge.
    1. Bulmer J.N., Morrison L., and Smith J.C.. 1988. Expression of class II MHC gene products by macrophages in human uteroplacental tissue. Immunology. 63:707–714. - PMC - PubMed

Publication types