. 2021 Jan 25;60(4):2000-2006.
doi: 10.1002/anie.202008958. Epub 2020 Nov 23.

Closing the Gap for Electronic Short-Circuiting: Photosystem I Mixed Monolayers Enable Improved Anisotropic Electron Flow in Biophotovoltaic Devices

Affiliations

Closing the Gap for Electronic Short-Circuiting: Photosystem I Mixed Monolayers Enable Improved Anisotropic Electron Flow in Biophotovoltaic Devices

Panpan Wang et al. Angew Chem Int Ed Engl. .

Abstract

Well-defined assemblies of photosynthetic protein complexes are required for an optimal performance of semi-artificial energy conversion devices, capable of providing unidirectional electron flow when light-harvesting proteins are interfaced with electrode surfaces. We present mixed photosystem I (PSI) monolayers constituted of native cyanobacterial PSI trimers in combination with isolated PSI monomers from the same organism. The resulting compact arrangement ensures a high density of photoactive protein complexes per unit area, providing the basis to effectively minimize short-circuiting processes that typically limit the performance of PSI-based bioelectrodes. The PSI film is further interfaced with redox polymers for optimal electron transfer, enabling highly efficient light-induced photocurrent generation. Coupling of the photocathode with a [NiFeSe]-hydrogenase confirms the possibility to realize light-induced H2 evolution.

Keywords: Biophotovoltaics; Electrochemistry; Langmuir-Blodgett films; Photosystem I; Redox polymers.


Conflict of interest statement

The authors declare no conflict of interest.

Figures

Figure 1
Figure 1
a) Schematic representation of the electron transport pathway in PSI. The cofactors include chlorophyll molecules (P700, A0), phylloquinones (A1), and Fe–S clusters (FX, FA, FB). PsaA and PsaB: protein subunits. [14] b) Side view of the protein complex highlighting its hydrophobic core (green) and the two hydrophilic ends (red) where the terminal redox sites are located. c) PSI monolayer at the air/water interface and Langmuir–Blodgett film transfer onto the electrode surface. d) Top view of trimeric cyanobacterial PSI. PDB ID: 4FE1. [15] Protein images created using NLG viewer (https://doi.org/10.1093/bioinformatics/bty419), RCSB PDB (rcsb.org).
Figure 2
Figure 2
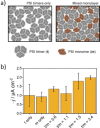
a) Schematic representation showing the proposed improvement in surface coverage with PSI monolayers comprised of a mixture of trimers and monomers in comparison with a monolayer constituted by trimeric complexes only. b) Mean photocurrent recorded for monolayers prepared using either PSI trimers (t), PSI monomers (m) or mixtures as indicated (ratios of μgChl used of each PSI preparation). PSI monolayers deposited on Au substrates. Transfer pressure for PSIt 42 mN m−1, for PSIm 29 mN m−1, for mixed monolayers 32 mN m−1. E app=210 mV vs. SHE. Illumination with red light at an incident power of 51 mW cm−2. Electrolyte: 2 mm MV2+ in air‐equilibrated 150 mm phosphate‐citrate buffer, pH 4.0. Error bars represent the standard deviation (N=3).
Figure 3
Figure 3
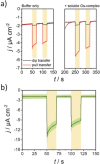
a) Photocurrent response for mixed monolayers on electrodes (the direction of monolayer transfer is indicated) before (left) and after (right) the addition of 125 μm soluble Os complex. b) Average photocurrent response for mixed monolayer deposited on Au substrates first modified with P‐Os. The green shaded region indicates the standard deviation of the measurements (N=3). For both panels: Electrolyte: 2 mm MV2+ in air‐equilibrated 150 mm phosphate‐citrate buffer, pH 4.0. E app=210 mV vs. SHE. Illumination with red light (51 mW cm−2) during the times indicated by the yellow boxes.
Figure 4
Figure 4
a) Energy level diagram for the cofactors involved in light‐induced charge separation and electron transfer at PSI and midpoint potentials of the redox polymers used in this study. b) Average photocurrent response for PSI‐LB/P‐Os/Au in the absence or presence of a top modification layer consisting of BPEI‐[CoCp2] (loading: 165 μg cm−2). The shaded regions indicate the standard deviation of the measurements (N=3). Electrolyte: air‐equilibrated 150 mm phosphate‐citrate buffer, pH 5.6. E app=210 mV vs. SHE. Illumination with red light (51 mW cm−2) during the times indicated by the yellow boxes. c) Photocurrent response for PSI‐LB/P‐Os/Au with a top H2ase/BPEI‐[CoCp2] layer, nominal loadings of embedded H2ase indicated in the Figure, redox polymer loading: 165 μg cm−2. Electrolyte: Ar‐saturated 150 mm phosphate‐citrate buffer, pH 5.6. E app=210 mV vs. SHE. Illumination with white light (113 mW cm−2) during the times indicated by the yellow boxes.

References

    1. None
    1. Zhang J. Z., Reisner E., Nat. Rev. Chem. 2020, 4, 6;
    1. Kornienko N., Zhang J. Z., Sakimoto K. K., Yang P., Reisner E., Nat. Nanotechnol. 2018, 13, 890; - PubMed
    1. Musazade E., Voloshin R., Brady N., Mondal J., Atashova S., Zharmukhamedov S. K., Huseynova I., Ramakrishna S., Najafpour M. M., Shen J.-R., et al., J. Photochem. Photobiol. C 2018, 35, 134;
    1. Saboe P. O., Conte E., Farell M., Bazan G. C., Kumar M., Energy Environ. Sci. 2017, 10, 14;

Publication types

Substances

LinkOut - more resources