Robust parametric modeling of Alzheimer's disease progression
- PMID: 33075562
- PMCID: PMC9068750
- DOI: 10.1016/j.neuroimage.2020.117460
Robust parametric modeling of Alzheimer's disease progression
Abstract
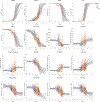
Quantitative characterization of disease progression using longitudinal data can provide long-term predictions for the pathological stages of individuals. This work studies the robust modeling of Alzheimer's disease progression using parametric methods. The proposed method linearly maps the individual's age to a disease progression score (DPS) and jointly fits constrained generalized logistic functions to the longitudinal dynamics of biomarkers as functions of the DPS using M-estimation. Robustness of the estimates is quantified using bootstrapping via Monte Carlo resampling, and the estimated inflection points of the fitted functions are used to temporally order the modeled biomarkers in the disease course. Kernel density estimation is applied to the obtained DPSs for clinical status classification using a Bayesian classifier. Different M-estimators and logistic functions, including a novel type proposed in this study, called modified Stannard, are evaluated on the data from the Alzheimer's Disease Neuroimaging Initiative (ADNI) for robust modeling of volumetric magnetic resonance imaging (MRI) and positron emission tomography (PET) biomarkers, cerebrospinal fluid (CSF) measurements, as well as cognitive tests. The results show that the modified Stannard function fitted using the logistic loss achieves the best modeling performance with an average normalized mean absolute error (NMAE) of 0.991 across all biomarkers and bootstraps. Applied to the ADNI test set, this model achieves a multiclass area under the ROC curve (AUC) of 0.934 in clinical status classification. The obtained results for the proposed model outperform almost all state-of-the-art results in predicting biomarker values and classifying clinical status. Finally, the experiments show that the proposed model, trained using abundant ADNI data, generalizes well to data from the National Alzheimer's Coordinating Center (NACC) with an average NMAE of 1.182 and a multiclass AUC of 0.929.
Keywords: Alzheimer’s disease; Bayesian classifier; Cerebrospinal fluid; Disease progression modeling; Generalized logistic function; Kernel density estimation; M-estimation; Magnetic resonance imaging; Positron emission tomography.
Copyright © 2020. Published by Elsevier Inc.
Conflict of interest statement
Declaration of Competing Interest M. Nielsen is a shareholder in Biomediq A/S and Cerebriu A/S. A. Pai is a shareholder in Cerebriu A/S. The remaining authors report no disclosures.
Figures


References
-
- Beekly DL, Ramos EM, Lee WW, Deitrich WD, Jacka ME, Wu J, Hubbard JL, Koepsell TD, Morris JC, Kukull WA, et al., 2007. The National Alzheimer’s Coordinating Center (NACC) database: the uniform data set. Alzheimer Dis. Assoc. Disord 21, 249–258. - PubMed
-
- Chai T, Draxler RR, 2014. Root mean square error (RMSE) or mean absolute error (MAE)? – Arguments against avoiding RMSE in the literature. Geosci. Model Dev 7, 1247–1250.
Publication types
MeSH terms
Substances
Grants and funding
- P50 AG005142/AG/NIA NIH HHS/United States
- P50 AG016573/AG/NIA NIH HHS/United States
- P50 AG047266/AG/NIA NIH HHS/United States
- P30 AG010161/AG/NIA NIH HHS/United States
- P50 AG025688/AG/NIA NIH HHS/United States
- P50 AG005133/AG/NIA NIH HHS/United States
- P50 AG005138/AG/NIA NIH HHS/United States
- P50 AG047366/AG/NIA NIH HHS/United States
- P30 AG010129/AG/NIA NIH HHS/United States
- P30 AG019610/AG/NIA NIH HHS/United States
- P30 AG028383/AG/NIA NIH HHS/United States
- P50 AG033514/AG/NIA NIH HHS/United States
- P30 AG013854/AG/NIA NIH HHS/United States
- P30 AG053760/AG/NIA NIH HHS/United States
- P30 AG010124/AG/NIA NIH HHS/United States
- P50 AG023501/AG/NIA NIH HHS/United States
- P50 AG005131/AG/NIA NIH HHS/United States
- P30 AG010133/AG/NIA NIH HHS/United States
- P50 AG016574/AG/NIA NIH HHS/United States
- P50 AG005146/AG/NIA NIH HHS/United States
- U24 AG072122/AG/NIA NIH HHS/United States
- U01 AG024904/AG/NIA NIH HHS/United States
- P30 AG035982/AG/NIA NIH HHS/United States
- P50 AG008702/AG/NIA NIH HHS/United States
- U01 AG016976/AG/NIA NIH HHS/United States
- P30 AG008051/AG/NIA NIH HHS/United States
- P50 AG005681/AG/NIA NIH HHS/United States
- P30 AG013846/AG/NIA NIH HHS/United States
- P50 AG047270/AG/NIA NIH HHS/United States
- P50 AG005136/AG/NIA NIH HHS/United States
- P30 AG049638/AG/NIA NIH HHS/United States
- P30 AG012300/AG/NIA NIH HHS/United States
- P50 AG005134/AG/NIA NIH HHS/United States
- P30 AG008017/AG/NIA NIH HHS/United States
LinkOut - more resources
Full Text Sources
Other Literature Sources
Medical

