. 2021;11(3):697-724.
doi: 10.1016/j.jcmgh.2020.10.006. Epub 2020 Oct 17.

S100A11 Promotes Liver Steatosis via FOXO1-Mediated Autophagy and Lipogenesis

Affiliations

S100A11 Promotes Liver Steatosis via FOXO1-Mediated Autophagy and Lipogenesis

Linqiang Zhang et al. Cell Mol Gastroenterol Hepatol. 2021.

Abstract

Background & aims: Nonalcoholic fatty liver disease (NAFLD) is becoming a severe liver disorder worldwide. Autophagy plays a critical role in liver steatosis. However, the role of autophagy in NAFLD remains exclusive and under debate. In this study, we investigated the role of S100 calcium binding protein A11 (S100A11) in the pathogenesis of hepatic steatosis.

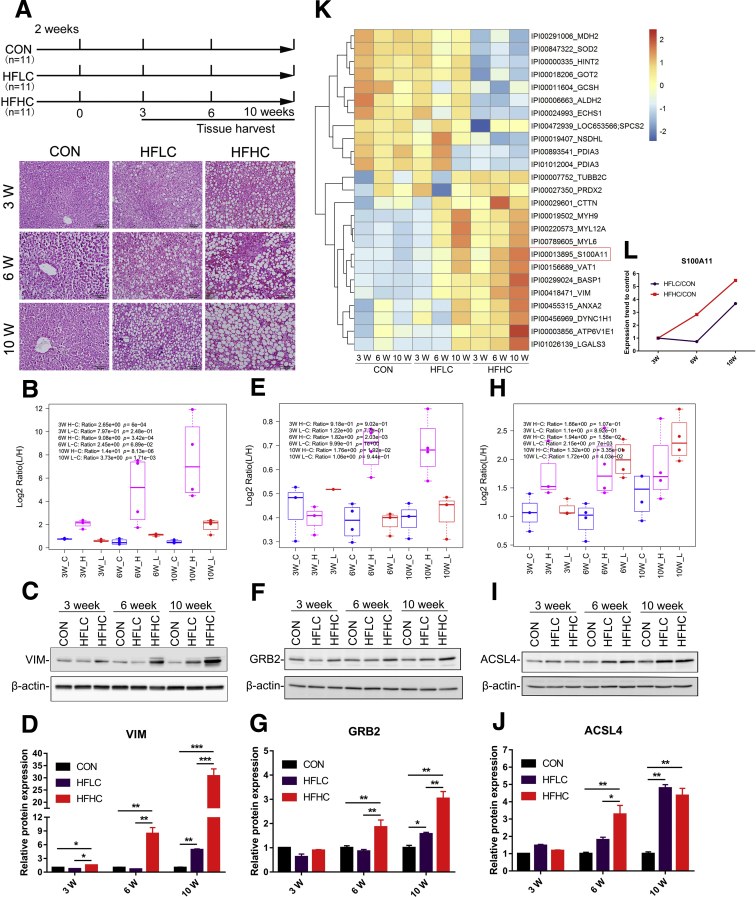
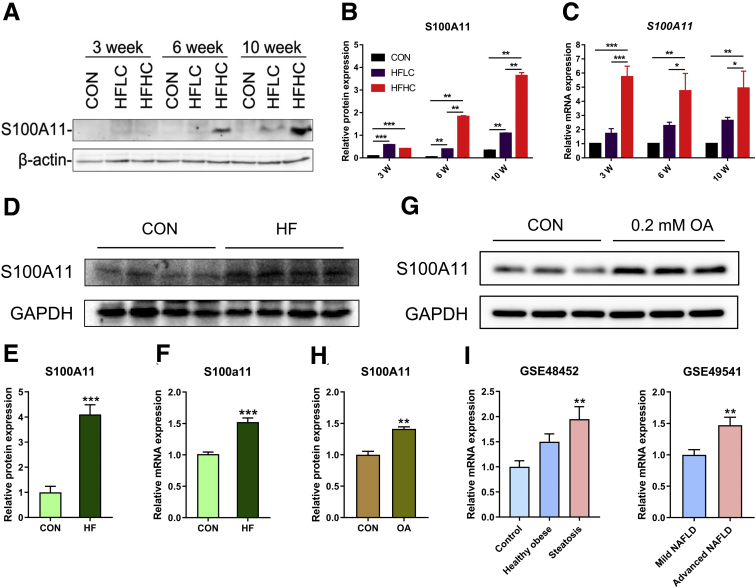
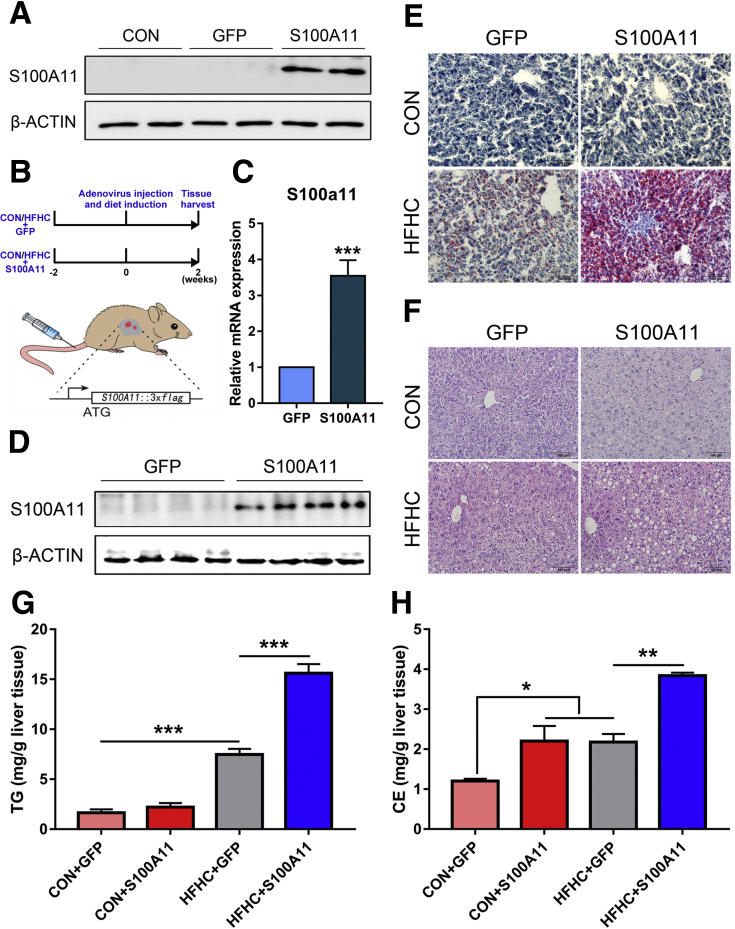
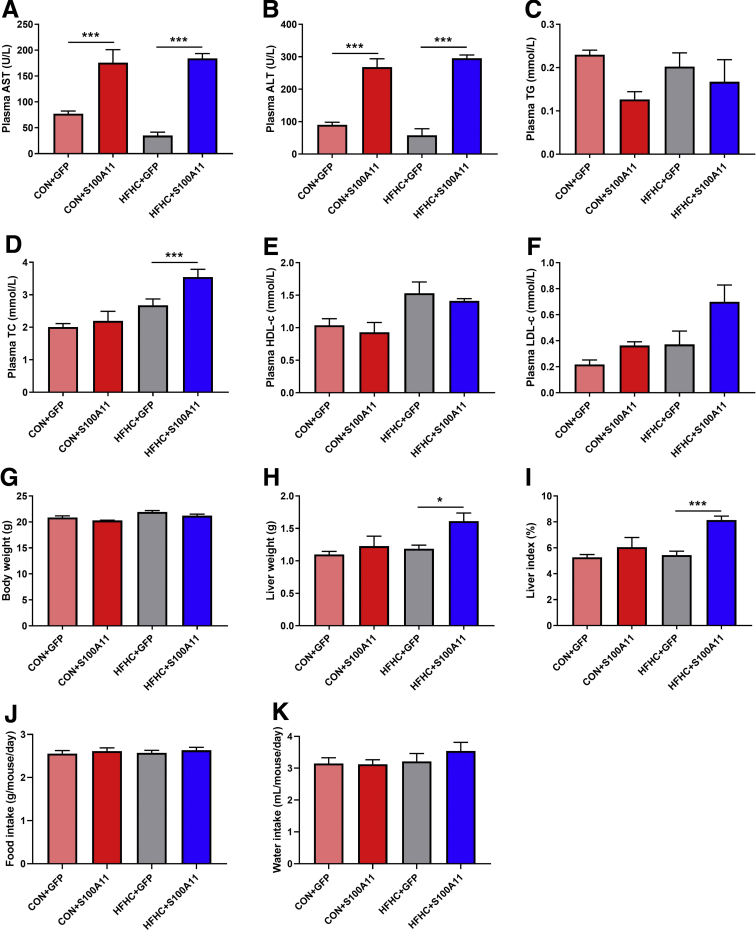
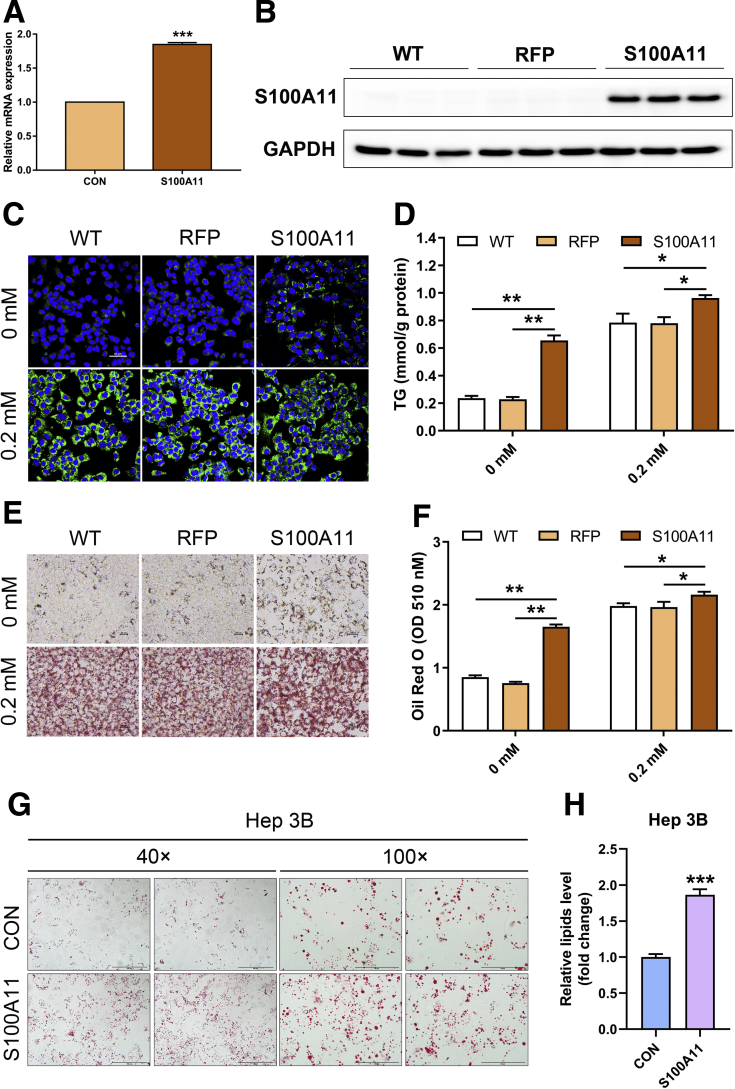
Methods: We performed liver proteomics in a well-established tree shrew model of NAFLD. The expression of S100A11 in different models of NAFLD was detected by Western blot and/or quantitative polymerase chain reaction. Liver S100A11 overexpression mice were generated by injecting a recombinant adenovirus gene transfer vector through the tail vein and then induced by a high-fat and high-cholesterol diet. Cell lines with S100a11 stable overexpression were established with a recombinant lentiviral vector. The lipid content was measured with either Bodipy staining, Oil Red O staining, gas chromatography, or a triglyceride kit. The autophagy and lipogenesis were detected in vitro and in vivo by Western blot and quantitative polymerase chain reaction. The functions of Sirtuin 1, histone deacetylase 6 (HDAC6), and FOXO1 were inhibited by specific inhibitors. The interactions between related proteins were analyzed by a co-immunoprecipitation assay and immunofluorescence analysis.

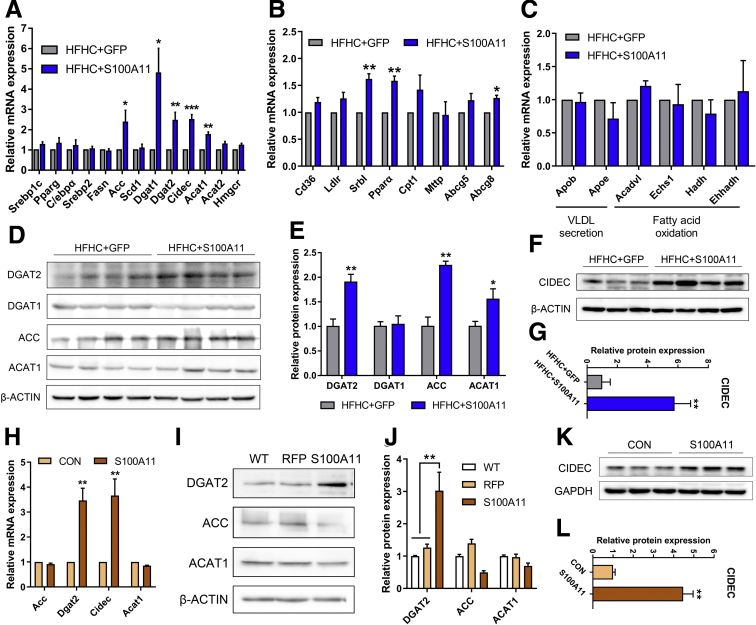
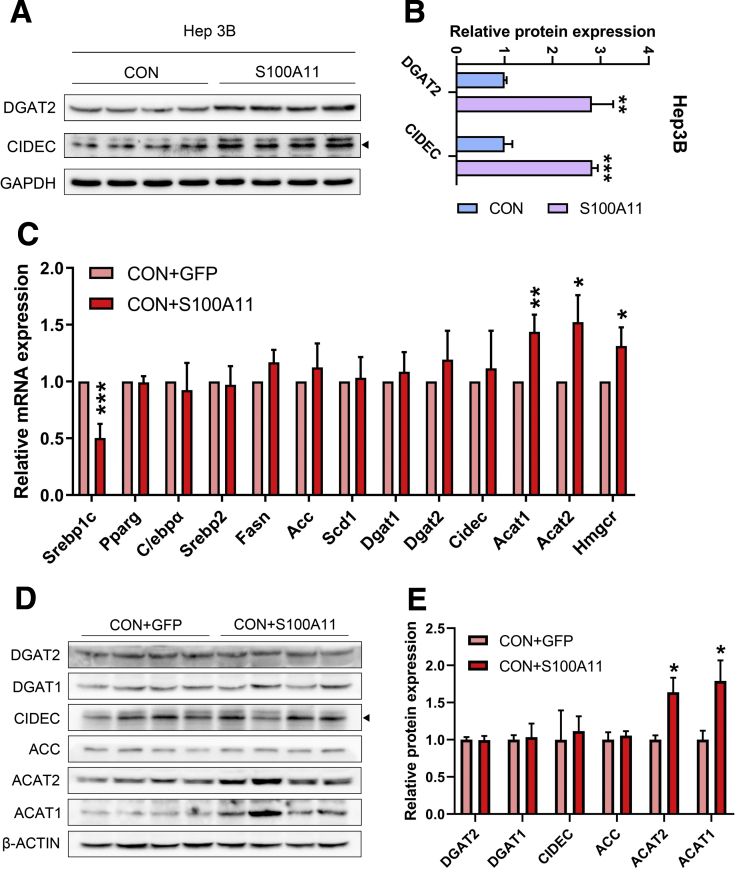
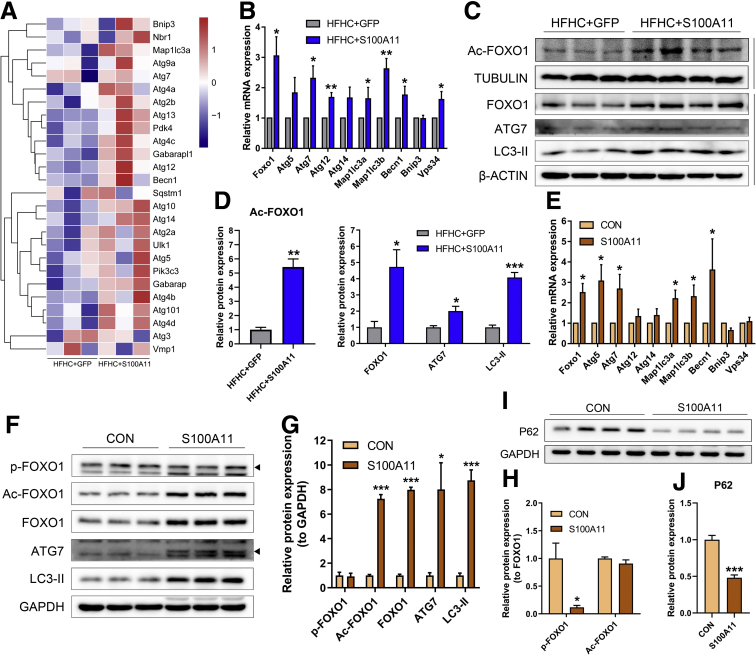
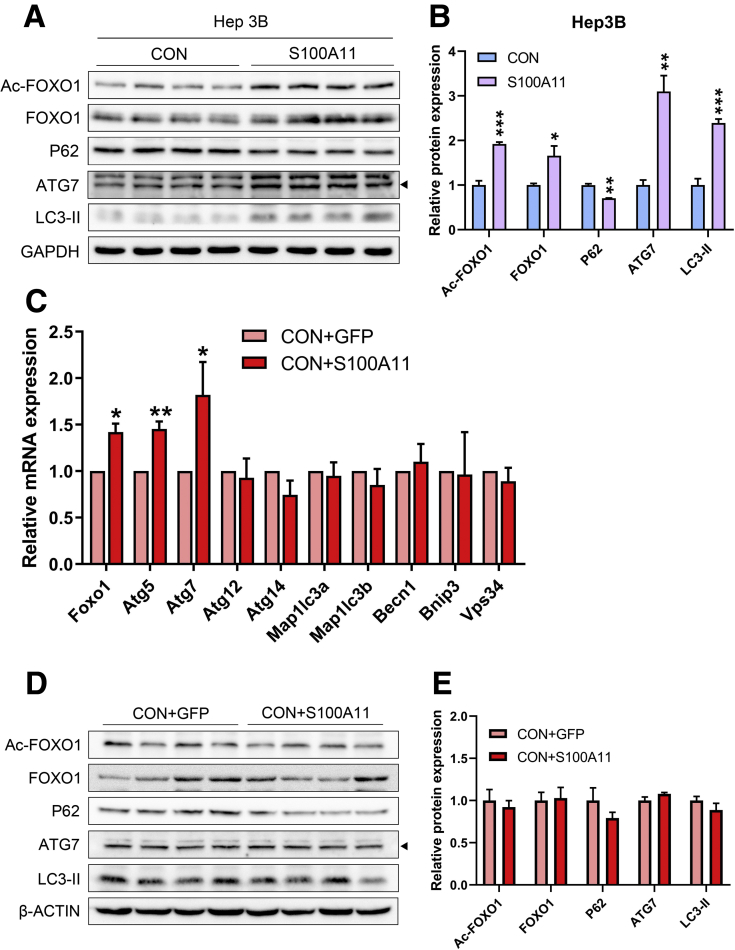
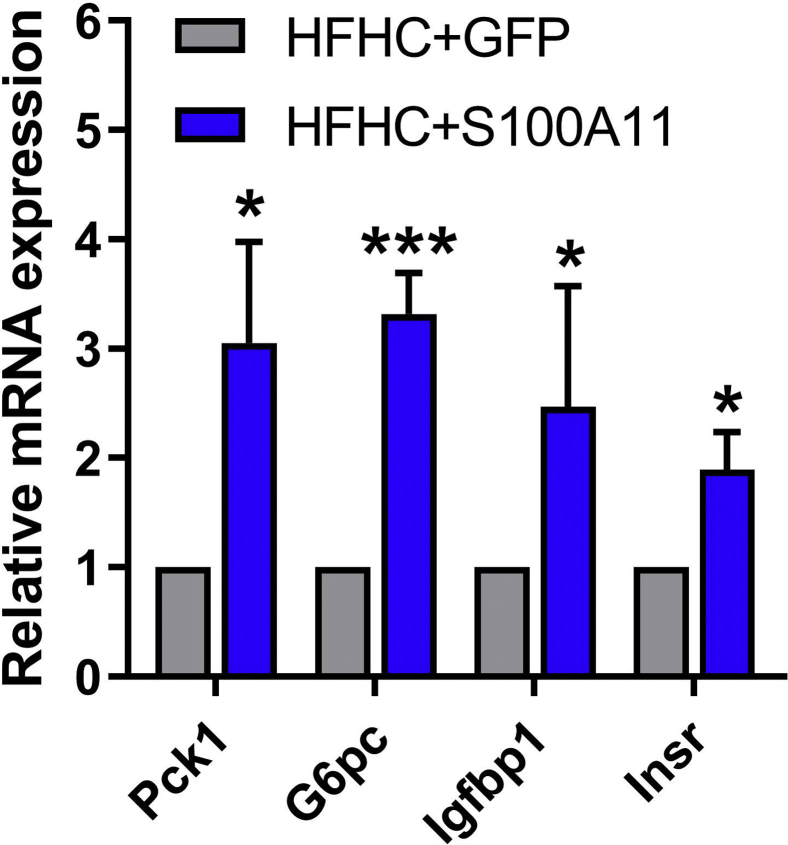
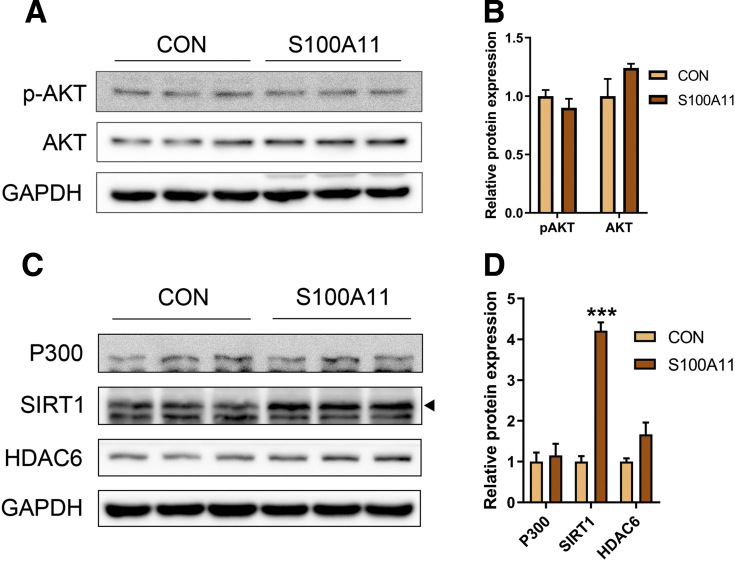
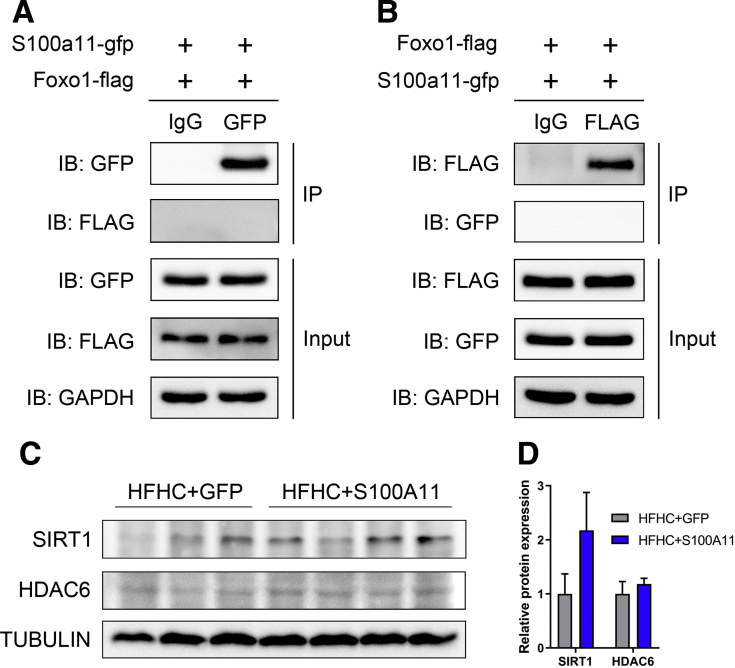
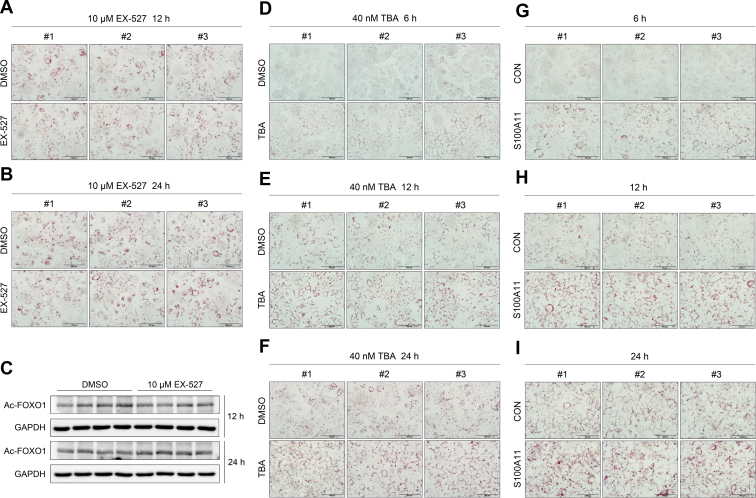
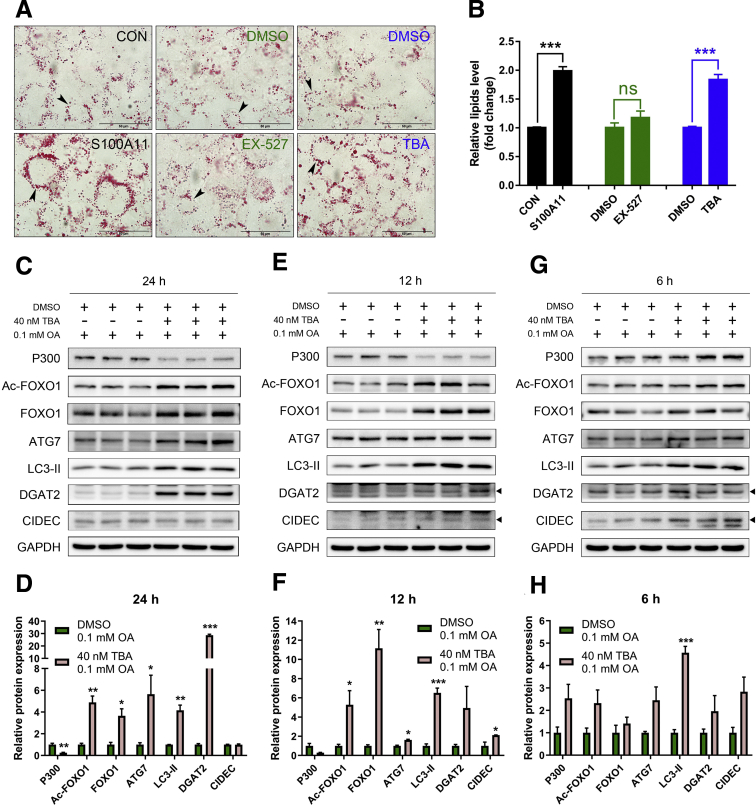
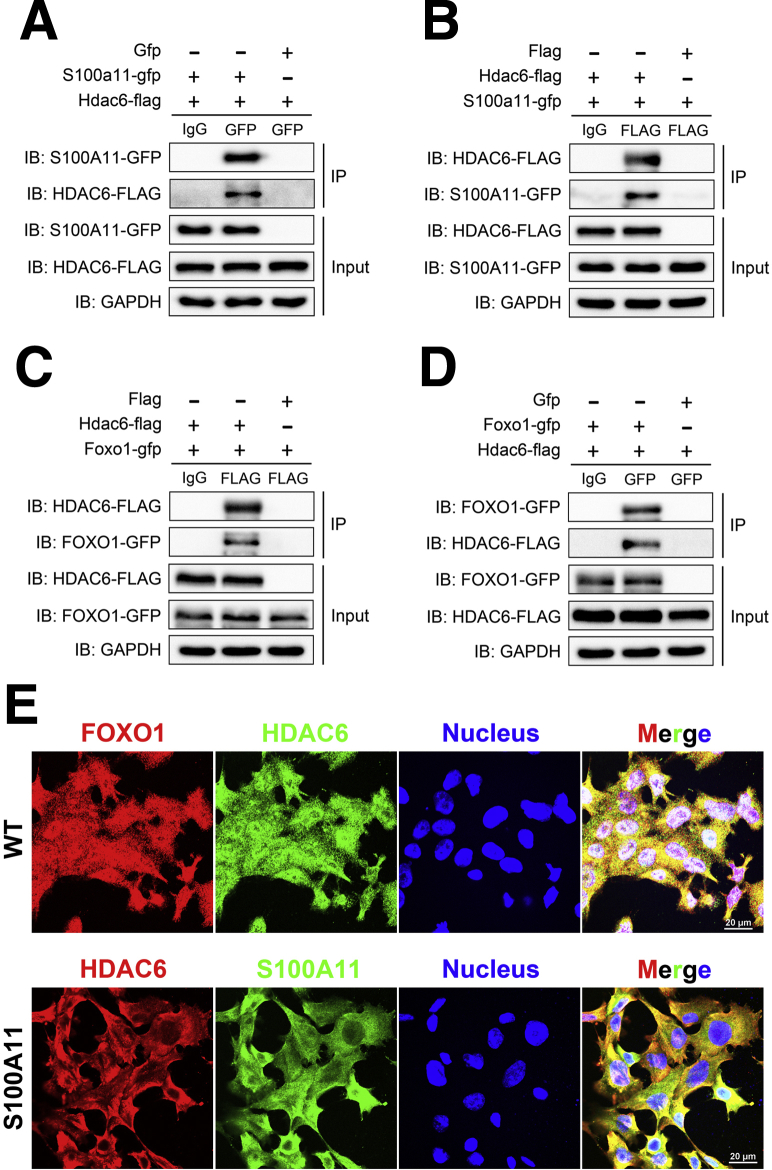
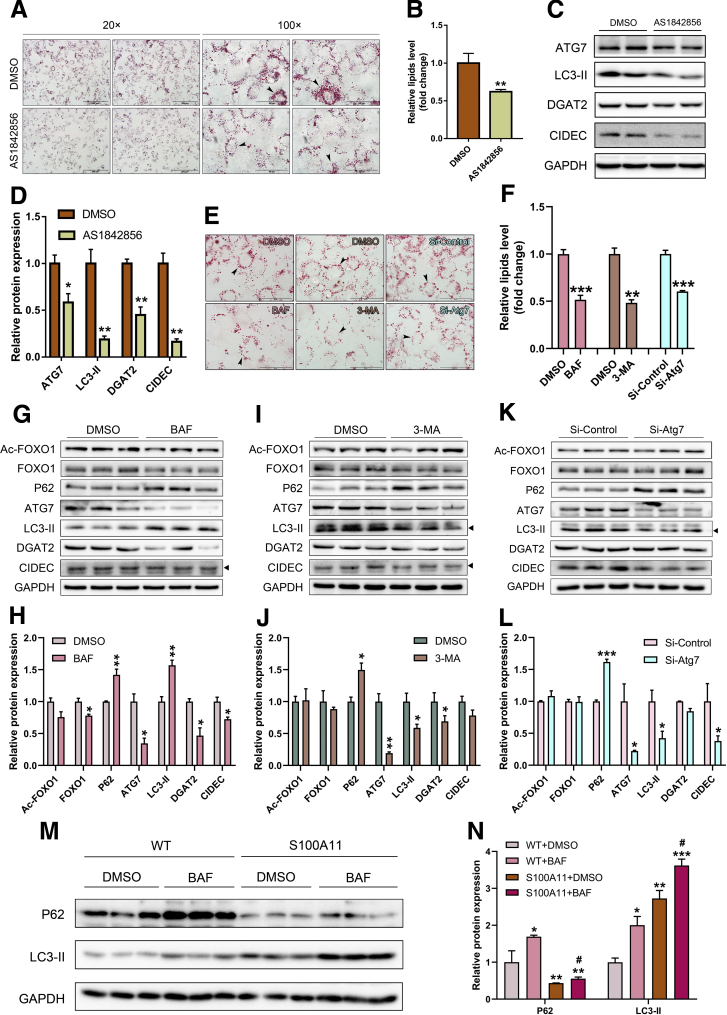
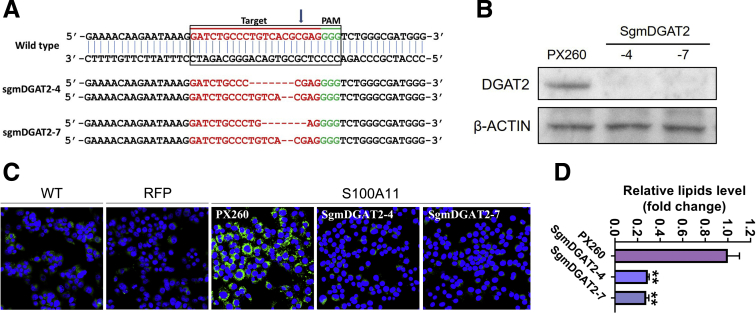
Results: The expression of S100A11 was up-regulated significantly in a time-dependent manner in the tree shrew model of NAFLD. S100A11 expression was induced consistently in oleic acid-treated liver cells as well as the livers of mice fed a high-fat diet and NAFLD patients. Both in vitro and in vivo overexpression of S100A11 could induce hepatic lipid accumulation. Mechanistically, overexpression of S100A11 activated an autophagy and lipogenesis process through up-regulation and acetylation of the transcriptional factor FOXO1, consequently promoting lipogenesis and lipid accumulation in vitro and in vivo. Inhibition of HDAC6, a deacetylase of FOXO1, showed similar phenotypes to S100A11 overexpression in Hepa 1-6 cells. S100A11 interacted with HDAC6 to inhibit its activity, leading to the release and activation of FOXO1. Under S100A11 overexpression, the inhibition of FOXO1 and autophagy could alleviate the activated autophagy as well as up-regulated lipogenic genes. Both FOXO1 and autophagy inhibition and Dgat2 deletion could reduce liver cell lipid accumulation significantly.

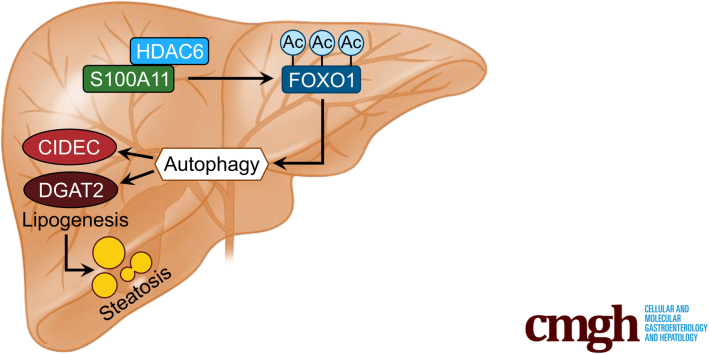
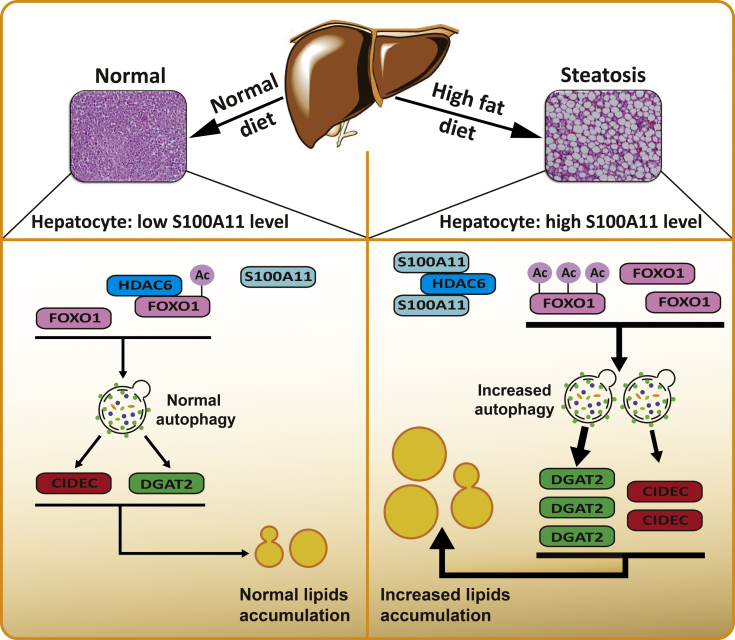
Conclusions: A high-fat diet promotes liver S100A11 expression, which may interact with HDAC6 to block its binding to FOXO1, releasing or increasing the acetylation of FOXO1, thus activating autophagy and lipogenesis, and accelerating lipid accumulation and liver steatosis. These findings indicate a completely novel S100A11-HDAC6-FOXO1 axis in the regulation of autophagy and liver steatosis, providing potential possibilities for the treatment of NAFLD.

Keywords: Autophagy; FOXO1; Lipid Metabolism; NAFLD; S100A11.


Figures

None
Graphical abstract
Figure 1
Figure 1
Liver proteomics analysis and its validation in a tree shrew model of NAFLD and the screening of S100A11 from liver proteomics. (A) Experimental design (top panel), H&E staining of tree shrew liver after 10 weeks of a HFLC and HFHC diet (bottom panel). Original magnification: 20×. Scale bars: 100 μm. (B–D) Validation of vimentin (VIM). (E–G) Validation of GRB2. (H–J) Validation of long-chain acyl-CoA synthetase 4 (ACSL4). Top panel: proteomics results, C, CON; L, HFLC; and H, HFHC groups. Middle panel: Western blot results of tree shrew liver proteins. Bottom panel: quantification of Western blot results from the middle panel. The target proteins were normalized to β-actin. n = 3–4 individual animals. (K) Heatmap generated by the proteins with continuously decreased or increased expression in the HFLC and HFHC groups from 3 to 10 weeks. (L) The expression tendency of S100A11 protein. ∗P < .05, ∗∗P < .01, and ∗∗∗P < .001.
Figure 2
Figure 2
Up-regulation of the calcium-binding protein S100A11 in in vitro and in vivo models of NAFLD. (A) S100A11 expression detected by Western blot in tree shrew liver. (B) Quantification of Western blot results from panel A. The target protein was normalized to β-actin. n = 4 individual animals for each group. (C) Relative mRNA expression of S100A11 in tree shrew liver detected by qPCR. β-actin was used as an internal control. n = 4 individual animals for each group. (D) Protein expression of S100A11 detected by Western blot in mouse liver induced by the HFD. (E) Quantification of Western blot results from panel D. The target protein was normalized to glyceraldehyde-3-phosphate dehydrogenase (GAPDH). n = 4 individual animals for each group. (F) mRNA expression of S100A11 in mouse liver detected by qPCR. GAPDH was used as an internal control. n = 4 individual animals for each group. (G) S100A11 expression detected by Western blot in Hepa 1–6 cells induced for 24 hours by 0.2 mmol/L OA. (H) Quantification of Western blot results from panel G. The target protein was normalized to GAPDH. (I) The GSE data showed the expression of liver S100A11 in human NAFLD. ∗P < .05, ∗∗P < .01, and ∗∗∗P < .001. GSE, series records of Gene Expression Omnibus database.
Figure 3
Figure 3
Overexpression of S100A11 in the liver exacerbated liver lipid deposition in mice fed the HFHC diet. (A) Infection efficiency of packaged adenovirus was tested by Western blot in vitro. (B) Schematic diagram of the experimental timeline and adenovirus injection into the veins of the mice tails. (C) qPCR and (D) Western blot detection of S100A11 adenovirus expression efficiency in mice liver. Glyceraldehyde-3-phosphate dehydrogenase (GAPDH) was used as an internal control to normalize the S100a11 gene expression. n = 4 individual animals for each group. (E and F) Representative figures of Oil Red O and H&E staining of mice liver. Original magnification: 20×. Scale bars: 100 μm. (G and H) Quantification of liver TG and CE contents through gas chromatography. n = 3–4 individual animals for each group. ∗P < .05, ∗∗P < .01, and ∗∗∗P < .001.
Figure 4
Figure 4
Plasma biochemical indicators, body weight, liver weight, and food and water intake of the mice treated with S100A11 overexpression and CON or HFHC diets. (A) The plasma level of aspartate aminotransferase (AST). (B) The plasma level of alanine aminotransferase (ALT). (C) The plasma level of TGs. (D) The plasma level of total cholesterol (TC). (E) The plasma level of high-density lipoprotein cholesterol (HDL-c). (F) The plasma level of LDL-c. (G) Body weight. (H) Liver weight. (I) Liver index (liver weight/body weight × 100%). (J and K) Food and water intake. n = 4–6 individual animals. ∗P < .05 and ∗∗∗P < .001.
Figure 5
Figure 5
S100A11 overexpression induced lipid accumulation in Hepa 1–6 and Hep 3B cells. (A and B) qPCR and Western blot detection of the S100A11 expression in Hepa 1–6 stable cell lines by puromycin selection for 2 weeks. Glyceraldehyde-3-phosphate dehydrogenase (GAPDH) was used as an internal control. (C) Bodipy staining of the S100A11 overexpression Hepa 1–6 cells treated with or without 0.2 mmol/L OA for 24 hours. Original magnification: 20×. (D) TG measurement in the S100A11 overexpression Hepa 1–6 cells treated with or without 0.2 mmol/L OA for 24 hours. (E) Oil Red O staining of the S100A11 overexpression Hepa 1–6 cells treated with or without 0.2 mmol/L OA for 24 hours. Original magnification: 20×. (F) Quantification of Oil Red O staining from panel E. (G) Oil Red O staining of the S100A11 overexpression Hep 3B cells treated with 0.1 mmol/L OA for 12 hours. Original magnification: 40× (left two panels) and 100× (right two panels). (H) Quantification of Oil Red O staining from panel G. ∗P < .05, ∗∗P < .01, and ∗∗∗P < .001.
Figure 6
Figure 6
In vivo and in vitro S100A11 overexpression increased the expression of neutral lipid synthesis genes and LD fusion factors. (A–C) mRNA level of genes involved in lipid synthesis, LD fusion, VLDL secretion, and fatty acid oxidation in mice liver detected by qPCR. β-actin was used as an internal control. n = 4 individual animals for each group. (D and E) Protein level and quantification in mice liver by Western blot. The target proteins were normalized to β-actin. n = 4 individual animals for each group. (F and G) Protein level and quantification of CIDEC in mice liver by Western blot. The CIDEC protein was normalized to β-actin. n = 3–4 individual animals for each group. (H) mRNA level of genes in Hepa 1–6 cells detected by qPCR. Glyceraldehyde-3-phosphate dehydrogenase (GAPDH) was used as an internal control. (I and J) Protein level and quantification in the Hepa 1–6 cells detected by Western blot. The target proteins were normalized to β-actin. (K and L) Protein level and quantification of the CIDEC in the Hepa 1–6 cells detected by Western blot. The CIDEC protein was normalized to GAPDH. ∗P < .05, ∗∗P < .01, and ∗∗∗P < .001. VLDL, very-low-density lipoprotein.
Figure 7
Figure 7
In vitro Western blot detection of proteins related to lipogenesis in S100A11 overexpression Hep 3B cells and in vivo qPCR and Western blot detection of lipogenic genes and proteins in the liver of the CON + GFP and CON + S100A11 mice groups. (A) Protein level of the lipogenic proteins in the S100A11 stable overexpression Hep 3B cells treated with 0.1 mmol/L OA for 12 hours. (B) Quantification of the related proteins from panel A. The target proteins were normalized to glyceraldehyde-3-phosphate dehydrogenase (GAPDH). (C) mRNA expression of lipogenic genes detected by qPCR. n = 4 individual animals. β-actin was used as an internal control. (D and E) Western blot detection and quantification of related proteins. The target proteins were normalized to β-actin. n = 4 individual animals. ∗P < .05, ∗∗P < .01, and ∗∗∗P < .001.
Figure 8
Figure 8
Overexpression of S100A11 promoted FOXO1 and autophagy marker expression in vivo and in vitro. (A) Heatmap generated by RNA sequencing data indicated that autophagy was up-regulated in the mice liver treated by S100A11 overexpression and the HFHC diet for 2 weeks. n = 3 individual animals for each group. (B) mRNA expression of FOXO1 and autophagy marker genes in vivo detected by qPCR. β-actin was used as an internal control. n = 4 individual animals for each group. (C and D) Western blot and quantification of Ac-FOXO1, FOXO1, ATG7, and LC3-II in the liver of the hepatic S100A11 overexpression and HFHC diet–treated mice. The target proteins were normalized to tubulin or β-actin as indicated. n = 3–4 individual animals. (E) mRNA expression of FOXO1 and autophagy marker genes in vitro detected by qPCR. Glyceraldehyde-3-phosphate dehydrogenase (GAPDH) was used as an internal control. (F) Western blot detection of phosphorylated, acetylated, and unphosphorylated FOXO1, ATG7, and LC3-II in the S100A11 overexpression Hepa 1–6 cells. (G) Quantification of Western blot results from panel F. The target proteins were normalized to GAPDH. (H) Quantification of Western blot results from panel F. p-FOXO1 and Ac-FOXO1 were normalized to FOXO1. (I and J) Protein level and quantification of P62 in the S100A11 overexpression Hepa 1–6 cells detected by Western blot. The target protein was normalized to GAPDH. ∗P < .05, ∗∗P < .01, and ∗∗∗P < .001. p-FOXO1, phosphorylated forkhead box O1.
Figure 9
Figure 9
In vitro Western blot detection of proteins related to autophagy in S100A11 overexpression Hep 3B cells and in vivo qPCR and Western blot detection of autophagic genes and proteins in the liver of the CON + GFP and CON + S100A11 mice groups. (A) Protein level of the autophagic proteins in the S100A11 stable overexpression Hep 3B cells treated with 0.1 mmol/L OA for 12 hours. (B) Quantification of the related proteins from panel A. The target proteins were normalized to glyceraldehyde-3-phosphate dehydrogenase (GAPDH). (C) mRNA expression of autophagic genes detected by qPCR. n = 4 individual animals. β-actin was used as an internal control. (D and E) Western blot detection and quantification of related proteins. The target proteins were normalized to β-actin. n = 4 individual animals. ∗P < .05, ∗∗P < .01, and ∗∗∗P < .001.
Figure 10
Figure 10
qPCR analysis of target genes of FOXO1. mRNA expression of FOXO1 target genes in the S100A11 overexpression mouse livers treated by the HFHC diet. n = 4 individual animals. β-actin was used as an internal control. ∗P < .05 and ∗∗∗P < .001.
Figure 11
Figure 11
Western blot analysis of phosphorylation and acetylation modification-related protein expression in the S100A11 overexpression Hepa 1–6 cells. (A) Western blot results of phosphorylated protein kinase B and AKT. (B) Quantification of Western blot results from panel A. The target proteins were normalized to glyceraldehyde-3-phosphate dehydrogenase (GAPDH). (C) Western blot results of P300, SIRT1, and HDAC6 in the S100A11 overexpression Hepa 1–6 cells. (D) Quantification of Western blot results from panel C. The target proteins were normalized to GAPDH. ∗∗∗P < .001.
Figure 12
Figure 12
Co-IP assays of S100A11 and FOXO1 proteins in 293T cells and Western blot analysis of acetylation modification-related protein expression in mice liver. The indicated recombinant plasmids were co-expressed in 293T cells for 48 hours and then the cell lysates were analyzed by Co-IP assays. (A) S100A11 did not interact with FOXO1. (B) FOXO1 did not interact with S100A11. (C) Western blot results of SIRT1 and HDAC6 in the HFHC-fed S100A11 overexpression mice liver. (D) Quantification of Western blot results from panel C. The target proteins were normalized to tubulin. n = 3–4 individual animals. GAPDH, glyceraldehyde-3-phosphate dehydrogenase.
Figure 13
Figure 13
Oil Red O staining of wild-type and S100A11 overexpression Hepa 1–6 cells, and Western blot analysis of wild-type Hepa 1–6 cells treated with EX-527. (A) Results of wild-type Hepa 1–6 cells treated with 0.1 mmol/L OA and 10 μmol/L EX-527 for 12 hours. (B) Results of wild-type Hepa 1–6 cells treated with 0.1 mmol/L OA and 10 μmol/L EX-527 for 24 hours. Original magnification: 40×. Scale bars: 100 μm. (C) Western blot detection of Ac-FOXO1 in wild-type Hepa 1–6 cells treated with 0.1 mmol/L OA and 10 μmol/L EX-527 for 12 and 24 hours. (D-F) Results of wild-type Hepa 1–6 cells treated with 0.1 mmol/L OA and 40 nmol/L TBA for 6, 12, and 24 hours, respectively. Original magnification: 40×. Scale bars: 100 μm. (G–I) Results of S100A11 overexpression Hepa 1–6 cells treated with 0.1 mmol/L OA for 6, 12, and 24 hours, respectively. Original magnification: 40×. Scale bars: 100 μm. DMSO, dimethyl sulfoxide; GAPDH, glyceraldehyde-3-phosphate dehydrogenase.
Figure 14
Figure 14
Overexpression of S100A11 or inhibition of HDAC6 increased lipid accumulation in hepatocytes. (A) Oil Red O staining of stable S100A11 overexpression Hepa 1–6 cells treated with 0.1 mmol/L OA (left panel), wild-type Hepa 1–6 cells treated with 10 μmol/L EX-527 and 0.1 mmol/L OA (middle panel), and wild-type Hepa 1–6 cells treated with 40 nmol/L TBA and 0.1 mmol/L OA (right panel). All cells were treated for 24 hours. Original magnification: 100×. Scale bars: 50 μm. (B) Quantification of the results from panel A by ImageJ. Western blot detection and quantification of P300, Ac-FOXO1, FOXO1, ATG7, LC3-II, DGAT2, and CIDEC in the wild-type Hepa 1–6 cells treated with 0.1 mmol/L OA and 40 nmol/L TBA for (C and D) 24 hours, (E and F) 12 hours, and (G and H) 6 hours. The target proteins were normalized to GAPDH. ∗P < .05, ∗∗P < .01, and ∗∗∗P < .001. DMSO, dimethyl sulfoxide; GAPDH, glyceraldehyde-3-phosphate dehydrogenase.
Figure 15
Figure 15
Co-IP and immunofluorescence analysis. (A and B) Co-IP assays of S100A11 and HDAC6 interactions as well as (C and D) HDAC6 and FOXO1 interactions in 293T cells. In all of the co-IP experiments, the cells were transfected with the indicated plasmids for 48 hours and the cell lysates were immunoprecipitated and detected with the indicated antibodies. (E) Immunofluorescent staining of FOXO1 and HDAC6 in the wild-type Hepa 1–6 cells (upper panel) and HDAC6 and S100A11 in the S100A11 overexpression Hepa 1–6 cells (lower panel). Original magnification: 100×. Scale bars: 20 μm. GAPDH, glyceraldehyde-3-phosphate dehydrogenase; IB, immunoblotting; WT, wild-type.
Figure 16
Figure 16
Inhibition of FOXO1 and autophagy decreased lipid content and the level of proteins related to the autophagy process in the S100A11 overexpression Hepa 1–6 cells. (A) Oil Red O staining of the S100A11 overexpression Hepa 1–6 cells after treatment with FOXO1 inhibitor (0.25 μmol/L AS1842856) for 6 hours. Left four images: Original magnification, 20×; scale bars: 200 μm. Right four images: Original magnification: 100×; scale bars: 50 μm. (B) Quantification of the results from panel A by ImageJ. (C and D) Results of Western blot detection and the quantification of related proteins in the Hepa 1–6 cells after treatment with AS1842856 (0.25 μmol/L) for 6 hours. The target proteins were normalized to glyceraldehyde-3-phosphate dehydrogenase (GAPDH). (E) Oil Red O staining of stable S100A11 overexpression Hepa 1–6 cells treated with 10 nmol/L bafilomycin A1 (BAF) (left panel), 2 mmol/L 3-methyladenine (3-MA) (middle panel), and RNA interference of Atg7 (right panel). Original magnification: 100×; scale bars: 50 μm. (F) Quantification of the results from panel E by ImageJ. Western blot detection and quantification of related proteins in the S100A11 overexpression Hepa 1–6 cells treated with (G and H) 10 nmol/L BAF, (I and J) 2 mmol/L 3-MA, and (K and L) RNA interference of Atg7, respectively. The target proteins were normalized to GAPDH. ∗P < .05, ∗∗P < .01, and ∗∗∗P < .001. For the autophagy-inhibitor treatment, all cells were cultured with a medium containing 0.1 mmol/L OA and the related inhibitor for 12 hours. For the RNA interference of Atg7, the cells were first treated with a small interfering (si) RNA of Atg7 for 48 hours and then incubated with 0.1 mmol/L OA for 12 hours. (M) Autophagy flux data. All cells were treated with dimethyl sulfoxide (DMSO) or 10 nmol/L BAF for 12 hours. (N) Quantification of the related proteins in panel M. The target proteins were normalized to GAPDH. Significant difference between the control (WT + DMSO) and a specific treatment (WT + BAF, S100A11 + DMSO, and S100A11 + BAF): ∗P < .05, ∗∗P < .01, and ∗∗∗P < .001. Significant difference between the S100A11 + DMSO and S100A11 + BAF: #P < .05.
Figure 17
Figure 17
Deletion of Dgat2 decreased lipid content in the S100A11 overexpression Hepa 1–6 cells. (A) Sequencing of Dgat2 knockout using the CRISPR/Cas9 system. Dgat2 was amplified by genomic PCR and then sequenced to verify the changes in gene sequences. (B) Western blot detection of Dgat2 deletion in the S100A11 overexpression Hepa 1–6 cells using the CRISPR/Cas9 method. (C and D) Bodipy staining and quantification by ImageJ of the Hepa 1–6 cells with S100A11 overexpression and Dgat2 deletion. WT, wild-type. ∗∗P < .01.
Figure 18
Figure 18
A working model of S100A11 for promoting autophagy and lipid accumulation in hepatocytes.

Comment in

Similar articles

Cited by

References

    1. Khan R., Bril F., Cusi K., Newsome P.N. Modulation of insulin resistance in NAFLD. Hepatology. 2019;70:711–724. - PubMed
    1. Younossi Z.M. Non-alcoholic fatty liver disease – a global public health perspective. J Hepatol. 2019;70:531–544. - PubMed
    1. Younossi Z.M., Koenig A.B., Abdelatif D., Fazel Y., Henry L., Wymer M. Global epidemiology of nonalcoholic fatty liver disease-meta-analytic assessment of prevalence, incidence, and outcomes. Hepatology. 2016;64:73–84. - PubMed
    1. Sanyal A.J., Brunt E.M., Kleiner D.E., Kowdley K.V., Chalasani N., Lavine J.E., Ratziu V., McCullough A. Endpoints and clinical trial design for nonalcoholic steatohepatitis. Hepatology. 2011;54:344–353. - PMC - PubMed
    1. Loomba R., Sanyal A.J. The global NAFLD epidemic. Nat Rev Gastroenterol Hepatol. 2013;10:686–690. - PubMed

Publication types