. 2020 Oct 15;21(20):7617.
doi: 10.3390/ijms21207617.

Calcium-Sensing Receptor in Adipose Tissue: Possible Association with Obesity-Related Elevated Autophagy

Affiliations

Calcium-Sensing Receptor in Adipose Tissue: Possible Association with Obesity-Related Elevated Autophagy

Pamela Mattar et al. Int J Mol Sci. .

Abstract

Autophagy is upregulated in adipose tissue (AT) from people with obesity. We showed that activation of the calcium-sensing receptor (CaSR) elevates proinflammatory cytokines through autophagy in preadipocytes. Our aim is to understand the role of CaSR on autophagy in AT from humans with obesity. We determined mRNA and protein levels of CaSR and markers of autophagy by qPCR and western blot in human visceral AT explants or isolated primary preadipocytes (60 donors: 72% female, 23-56% body fat). We also investigated their association with donors' anthropometric variables. Donors' % body fat and CaSR mRNA expression in AT were correlated (r = 0.44, p < 0.01). CaSR expression was associated with mRNA levels of the autophagy markers atg5 (r = 0.37, p < 0.01), atg7 (r = 0.29, p < 0.05) and lc3b (r = 0.40, p < 0.01). CaSR activation increased becn and atg7 mRNA expression in AT. CaSR activation also upregulated LC3II by ~50%, an effect abolished by the CaSR inhibitor. Spermine (CaSR agonist) regulates LC3II through the ERK1/2 pathway. Structural equation model analysis suggests a link between donors' AT CaSR expression, AT autophagy and expression of Tumor Necrosis Factor alpha TNF-α. CaSR expression in visceral AT is directly associated with % body fat, and CaSR activation may contribute to obesity-related disruption in AT autophagy.

Keywords: autophagy; calcium-sensing receptor; obesity; visceral adipose tissue.


Conflict of interest statement

The authors declare that they have no conflict of interest.

Figures
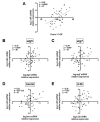
Figure 1
Figure 1
Whole adipose tissue calcium-sensing receptor (CaSR) mRNA content positively correlates with donors’ body fat percentage and mRNA of autophagy markers. Pearson’s correlation coefficient was calculated for the association between CaSR mRNA and (A) body fat percentage (%BF), (B) atg5, (C) atg7, (D) becn and (E) lc3b. All mRNA values were log transformed. Each graph depicts the r, and p values, as well as the number of explants analyzed (1 explant = 1 donor) (n). * Significant and ns = non-significant.
Figure 2
Figure 2
Expression (mRNA) of the autophagy genes becn, atg7 and lc3a is upregulated by CaSR activators in whole adipose tissue explants. mRNA content was determined by qPCR after 6 h treatment with (A) 2 μM cinacalcet or (B) 100 μM spermine. mRNA expression is expressed normalized by the internal reference gene GAPDH and presented as a fold of vehicle-treated controls (dotted line, 1). * p < 0.05 for the difference from 1, Wilcoxon signed rank test, n = 13 independent donors’ explants. The insets show the individual experimental data.
Figure 3
Figure 3
Autophagy flux is modulated by cinacalcet or spermine in human adipose tissue explants. LC3II and p62 protein expression was determined after 2, 6 and 24 h of (AC) 2 μM cinacalcet or (DF) 100 μM spermine with or without chloroquine (CQ) to determine the protein levels under autophagy flux inhibition or basal conditions, respectively. LC3 and p62 abundance was normalized by β-actin. Differences between vehicle and treated conditions were determined by two-way ANOVA and Holm–Sidak’s multiple comparison post-hoc test. The symbols “&” (−CQ) and “#” (+CQ) represent p < 0.05 compared to the respective vehicle condition, n = 4–6 independent experiments.
Figure 4
Figure 4
Cinacalcet- and spermine-induced elevation in autophagy is abolished by CaSR inhibition in visceral adipose tissue explants. Protein expression was determined after 6 h exposure to 2 μM cinacalcet or 100 μM spermine with or without 10 μM calhex 231 preincubation (1 h) and presence thereafter. All conditions were exposed to 20 μM chloroquine (CQ) during the last 2–3 h to determine the protein levels under autophagy flux inhibition. Expression of protein abundance was normalized by β-actin. Differences between vehicle and treated conditions were determined by two-way ANOVA and Holm–Sidak’s multiple comparison post-hoc test. # p < 0.05 and the dots represent each independent experiment (n = 5), corresponding to a different adipose tissue (AT) explant donor. The two parts of the membrane represent the same experiment and were processed in a single western blot.
Figure 5
Figure 5
CaSR activation by spermine elevates autophagy through ERK1/2 in primary preadipocytes. (A) pERK/ERK and (B) LC3II levels were evaluated with or without pre-exposure to the upstream (MAPK) ERK1/2 phosphorylation inhibitor U0126 (10 μM) in primary isolated human preadipocytes treated with the CaSR activators cinacalcet (2 μM) or spermine (100 μM) or vehicle. The images show representative blots for each condition, and graphs summarize the densitometry analysis. Bars represent mean ± SEM, * p < 0.05 for two-way ANOVA versus vehicle or vehicle + U0126 and Holm–Sidak’s multiple comparison post-hoc test, n = 4–5.
Figure 6
Figure 6
Standardized solution for SEM analysis and proposed model. (A) Solid and dashed arrows indicate the evaluated significant (p < 0.05) and non-significant associations, respectively. Numbers indicate significant standardized effects (from −1 to 1). Labels in italics represent latent variables (see methods section). %BF: body fat percentage. Variances for each variable can be found in Supplementary Materials (Table S5). (B) Proposed schematic model based on our findings.

References

    1. Ost A., Svensson K., Ruishalme I., Brannmark C., Franck N., Krook H., Sandstrom P., Kjolhede P., Stralfors P. Attenuated mTOR signaling and enhanced autophagy in adipocytes from obese patients with type 2 diabetes. Mol. Med. 2010;16:235–246. doi: 10.2119/molmed.2010.00023. - DOI - PMC - PubMed
    1. Kovsan J., Bluher M., Tarnovscki T., Kloting N., Kirshtein B., Madar L., Shai I., Golan R., Hatman-Boehm I., Schon M.R., et al. Altered autophagy in human adipose tissues in obesity. J. Clin. Endocrinol. Metab. 2011;96:268–277. doi: 10.1210/jc.2010-1681. - DOI - PubMed
    1. Mattar P., Bravo-Sagua R., Tobar N., Fuentes C., Tronsoco R., Breitwieser G., Lavandero S., Cifuentes M. Autophagy mediates calcium-sensing receptor-induced TNFalpha production in human preadipocytes. Biochim. Biophys. Acta Mol. Basis Dis. 2018;1864:3585–3594. doi: 10.1016/j.bbadis.2018.08.020. - DOI - PubMed
    1. Singh R., Xiang Y., Wang Y., Baikati K., Cuervo A.M., Luu Y.K., Tang Y., Pessin J.E., Schwartz G.J., Czaja M.J. Autophagy regulates adipose mass and differentiation in mice. J. Clin. Investig. 2009;119:3329–3339. doi: 10.1172/JCI39228. - DOI - PMC - PubMed
    1. Yang L., Li P., Fu S., Calay E.S., Hotamisligil G.S. Defective Hepatic autophagy in obesity promotes ER Stress and causes insulin resistance. Cell Metab. 2010;11:467–478. doi: 10.1016/j.cmet.2010.04.005. - DOI - PMC - PubMed

MeSH terms