. 2020 Oct 15;12(10):1165.
doi: 10.3390/v12101165.

A Cell-Based Capture Assay for Rapid Virus Detection

Affiliations

A Cell-Based Capture Assay for Rapid Virus Detection

Elad Milrot et al. Viruses. .

Abstract

Routine methods for virus detection in clinical specimens rely on a variety of sensitive methods, such as genetic, cell culture and immuno-based assays. It is imperative that the detection assays would be reliable, reproducible, sensitive and rapid. Isolation of viruses from clinical samples is crucial for deeper virus identification and analysis. Here we introduce a rapid cell-based assay for isolation and detection of viruses. As a proof of concept several model viruses including West Nile Virus (WNV), Modified Vaccinia Ankara (MVA) and Adenovirus were chosen. Suspended Vero cells were employed to capture the viruses following specific antibody labeling which enables their detection by flow cytometry and immuno-fluorescence microscopy assays. Using flow cytometry, a dose response analysis was performed in which 3.6e4 pfu/mL and 1e6 pfu/mL of MVA and WNV could be detected within two hours, respectively. When spiked to commercial pooled human serum, detection sensitivity was slightly reduced to 3e6 pfu/mL for WNV, but remained essentially the same for MVA. In conclusion, the study demonstrates a robust and rapid methodology for virus detection using flow cytometry and fluorescence microscopy. We propose that this proof of concept may prove useful in identifying future pathogens.

Keywords: Adenovirus; Modified Vaccinia Ankara; West Nile Virus; flow cytometry; immuno-fluorescence assay; transmission electron microscopy.


Conflict of interest statement

The authors declare no conflict of interest.

Figures

Figure 1
Figure 1
A schematic representation of the cell-based immuno-assay. Vero cells are harvested from cell culture flasks using trypsin (~15 min). The cells are then suspended in 2%FBS-MEM and aliquoted to tubes (step 1). The viruses are then added to the cells and incubated at 4 °C with shaking to allow adsorption to the cells surface (1 h) (step 2). After attachment to the cells, a specific fluorescent antibody is added (step 3, ~40 min) and the cells are analyzed in FACS or fluorescence microscopy.
Figure 2
Figure 2
Optimization of cell number used for the cell-based immuno-assay in flow cytometry. The cells were harvested and diluted to achieve 20,000, 100,000 and 450,000 cells per tube. WNV were added at 9 × 10⁶ pfu/mL, MVA and Adenovirus were added at 1e6 pfu/mL for one hour with shaking at 4 °C to allow attachment. The cells were then immuno-labeled with the relevant fluorescent antibody and analyzed in FACS. The results shown represent average values of positive staining ± SEM from 3 independent experiments in biological duplicates for each of the viruses.
Figure 3
Figure 3
Negative staining TEM imaging of MVA and Adenovirus after capture and release from Vero cells. MVA and Adenovirus spiked in 2% FBS-MEM were added to Vero cells for one hour to allow attachment. After one hour, the cells (containing adsorbed viruses) were pelleted and then sonicated to release the bound viruses. The viruses were then added to TEM girds, fixed and stained with 1% PTA. (A,B) The traditional “brick” shape structure of MVA was seen among cell debris. (C,D) The icosahedral Adenovirus particles could be observed among cell debris. Representative images are from two experiment in biological duplicates. Insets shows high magnification of the viruses marked with two white arrows in panel (C,D).
Figure 4
Figure 4
Dose response analysis of MVA and West Nile Virus after capture by Vero cells. (A,B) The cells were harvested and diluted to achieve 20,000 cells per tube. WNV and MVA (diluted in 2% FBS-MEM) were added at the indicated concentrations for one hour with shaking at 4 °C to allow attachment. The cells were then immuno-labeled with a relevant fluorescent antibody and analyzed by FACS. Dashed black line represents the limit of detection of the assay (2.12% of positive staining for WNV and 0.8% for MVA) which was determined by 3 times the mean value of background noise from non-infected cells. The results shown represent average values ± SEM from 3 independent experiments in biological duplicates for each of the viruses.
Figure 5
Figure 5
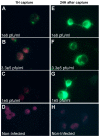
Fluorescence microscopy imaging of MVA after capture with Vero cells. (AD) Suspended Vero cells were mixed with MVA at the indicated concentrations for one hour with shaking to allow attachment. After capture, the cells were pelleted and processed directly to IFA. The cells are labeled with purple color and viruses are in green. (A,B) Numerous viral particles could be observed on the cells surface after an hour of incubation with the cells. (C) Few MVA particles were seen on the cells surface. (D) No virus bound cells were observed in the control cells. (EG) Suspended Vero cells were mixed with MVA at the indicated concentrations for one hour with shaking at 4 °C to allow attachment and then seeded in Labtek dishes for additional 24 h to allow virus replication. The cells were then processed to IFA. Intensive cellular staining was noted at all virus doses. (H) No cellular staining was observed in non-infected cells after 24 h of incubation.
Figure 6
Figure 6
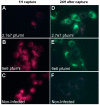
Fluorescence microscopy imaging of WNV after capture with Vero cells. (AC) Suspended Vero cells were mixed with WNV at the indicated concentrations for one hour with shaking to allow attachment. After capture, the cells were pelleted and processed to IFA. Cells were labeled with purple color and viruses are in green. (A,B) Multiple viral particles could be observed on the cells surface. (C) Non-infected cells did not show any staining. (D,E) Suspended Vero cells were mixed with WNV at the indicated concentrations for one hour with shaking to allow attachment. After capture the cells were pelleted and seeded in Labtek dishes for additional 24 h to allow virus replication. Intensive cellular staining was noted at 2.7 × 10⁷ pfu/mL and 9 × 10⁶ pfu/mL virus concentrations. (F) No cellular staining was observed in non-infected cells after 24 h of incubation.
Figure 7
Figure 7
Adaption of the capture assay to commercial human serum. (A) Cells were harvested and diluted to achieve 20,000 cells per tube. WNV was spiked at the indicated concentrations into human serum or diluted serum. Next, the viruses were added to Vero cells and incubated for one hour with shaking at 4 °C to allow attachment. The cells were then immuno-labeled with anti-WNV:FITC antibody and analyzed by FACS. The results shown are average values of positive staining ± SEM from one experiment in biological duplicates. (B) WNV was spiked at 9 × 10⁶ pfu/mL and 2.7 × 10⁷ pfu/mL into commercial human serum. After spiking, the serum containing virus was diluted with PBS and then added to the cells for one hour with shaking at 4 °C to allow attachment. The cells were then immuno-labeled with anti-WNV:FITC antibody and analyzed by FACS. The results shown are from two experiments in biological duplicates. (*) Statistical significance was determined by 2 tailed unpaired student’s t-test. p value ≤ 0.05 was considered to be significant.
Figure 8
Figure 8
Dose response analysis of MVA and West Nile virus spiked to fourfold-diluted human serum after capture with Vero cells. (A,B) The cells were harvested and diluted to achieve 20,000 cells per tube. Next, WNV or MVA spiked to fourfold diluted human serum were added to the cells and incubated for one hour with shaking at 4 °C to allow attachment. The cells were then immuno-labeled with a relevant fluorescent antibody and analyzed by FACS. The results shown are average values of positive staining ± SEM from 3 and 4 experiments in biological duplicates for MVA and WNV, respectively.

References

    1. Boonham N., Kreuze J., Winter S., Van Der Vlugt R., Bergervoet J., Tomlinson J., Mumford R. Methods in virus diagnostics: From ELISA to next generation sequencing. Virus Res. 2014;186:20–31. doi: 10.1016/j.virusres.2013.12.007. - DOI - PubMed
    1. Vemula S.V., Zhao J., Liu J., Wang X., Biswas S., Hewlett I. Current Approaches for Diagnosis of Influenza Virus Infections in Humans. Viruses. 2016;8:96. doi: 10.3390/v8040096. - DOI - PMC - PubMed
    1. Lippé R. Flow Virometry: A Powerful Tool to Functionally Characterize Viruses. J. Virol. 2017;92:e01765-17. doi: 10.1128/JVI.01765-17. - DOI - PMC - PubMed
    1. Lonsdale R., Pau M., Oerlemans M., Ophorst C., Vooys A., Havenga M., Goudsmit J., UytdeHaag F., Marzio G. A rapid method for immunotitration of influenza viruses using flow cytometry. J. Virol. Methods. 2003;110:67–71. doi: 10.1016/S0166-0934(03)00102-2. - DOI - PubMed
    1. Lambeth C.R., White L.J., Johnston R.E., De Silva A.M. Flow Cytometry-Based Assay for Titrating Dengue Virus. J. Clin. Microbiol. 2005;43:3267–3272. doi: 10.1128/JCM.43.7.3267-3272.2005. - DOI - PMC - PubMed

Publication types