. 2020 Oct 15;10(10):1450.
doi: 10.3390/biom10101450.

Nonhistone Proteins HMGB1 and HMGB2 Differentially Modulate the Response of Human Embryonic Stem Cells and the Progenitor Cells to the Anticancer Drug Etoposide

Affiliations

Nonhistone Proteins HMGB1 and HMGB2 Differentially Modulate the Response of Human Embryonic Stem Cells and the Progenitor Cells to the Anticancer Drug Etoposide

Alireza Jian Bagherpoor et al. Biomolecules. .

Abstract

HMGB1 and HMGB2 proteins are abundantly expressed in human embryonic stem cells (hESCs) and hESC-derived progenitor cells (neuroectodermal cells, hNECs), though their functional roles in pluripotency and the mechanisms underlying their differentiation in response to the anticancer drug etoposide remain to be elucidated. Here, we show that HMGB1 and/or HMGB2 knockdown (KD) by shRNA in hESCs did not affect the cell stemness/pluripotency regardless of etoposide treatments, while in hESC-derived neuroectodermal cells, treatment resulted in differential effects on cell survival and the generation of rosette structures. The objective of this work was to determine whether HMGB1/2 proteins could modulate the sensitivity of hESCs and hESC-derived progenitor cells (hNECs) to etoposide. We observed that HMGB1 KD knockdown (KD) and, to a lesser extent, HMGB2 KD enhanced the sensitivity of hESCs to etoposide. Enhanced accumulation of 53BP1 on telomeres was detected by confocal microscopy in both untreated and etoposide-treated HMGB1 KD hESCs and hNECs, indicating that the loss of HMGB1 could destabilize telomeres. On the other hand, decreased accumulation of 53BP1 on telomeres in etoposide-treated HMGB2 KD hESCs (but not in HMGB2 KD hNECs) suggested that the loss of HMGB2 promoted the stability of telomeres. Etoposide treatment of hESCs resulted in a significant enhancement of telomerase activity, with the highest increase observed in the HMGB2 KD cells. Interestingly, no changes in telomerase activity were found in etoposide-treated control hNECs, but HMGB2 KD (unlike HMGB1 KD) markedly decreased telomerase activity in these cells. Changes in telomerase activity in the etoposide-treated HMGB2 KD hESCs or hNECs coincided with the appearance of DNA damage markers and could already be observed before the onset of apoptosis. Collectively, we have demonstrated that HMGB1 or HMGB2 differentially modulate the impact of etoposide treatment on human embryonic stem cells and their progenitor cells, suggesting possible strategies for the enhancement of the efficacy of this anticancer drug.

Keywords: HMGB1 and HMGB2; apoptosis; etoposide; human embryonic stem cells; neuroectodermal cells; telomerase.


Conflict of interest statement

The authors declare no conflict of interest

Figures
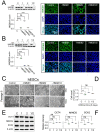
Figure 1
Figure 1
The morphology of human embryonic stem cells (hESCs) remains unchanged after knockdown of HMGB1 and/or HMGB2 while maintaining self-renewal and pluripotency in culture. (A and B) Left panels: The level of Dox-inducible HMGB1 and HMGB2 knockdown in hESCs as determined by Western blotting. Bar graphs represent the quantification of Western blots. All data on HMGB expression were normalized to β-actin. Knockdown of HMGB1 or HMGB2 in control hESCs (empty vector transfected) was set as 1. Right panels: Immunostaining of HMGB1 and/or HMGB2 in stably transfected hESC clones with inducible HMGB knockdown. Anti-HMGB1 or anti-HMGB2 (green) antibodies were used. DNA was stained with 4,6-diamidino-2-phenylindole (DAPI, blue). (C) Normal morphology of hESCs in the absence (−) or presence (+) of doxycycline (Dox) under standard culture media for 5 passages. (D) Relative number of hESCs upon HMGB1 and/or HMGB2 knockdown (results are normalized to empty vector-transfected cells). Levels of the pluripotency markers OCT4, NANOG, and SOX2 upon HMGB1 and/or HMGB2 knockdown in hESCs, as revealed by Western blotting (E) or densitometric quantification (F) of the Western blots. Description: “C”, cells transfected with empty vector; “−1”, cells with HMGB1 knockdown; “−2”, cells with HMGB2 knockdown; “−1/2”, cells with HMGB1 and HMGB2 knockdown. All calculations were normalized against β-actin. The expression level of pluripotency markers in the control (empty vector transfected) cells was set as 1. Data represent the mean and standard deviation (SD) of three independent experiments. Data were analyzed using Tukey’s multiple comparison test (p > 0.05 = not significant, ns; * p < 0.05; ** p < 0.01; *** p < 0.0001). Scale bars = 50, 200 μm.
Figure 2
Figure 2
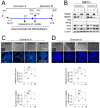
The distinct impact of HMGB1/2 silencing on the cell survival and differentiation efficiency of neuroectodermal cells. (A) Two scenarios for the differentiation of hESCs into the neuroectodermal lineage. Scenario A: Undifferentiated hESCs were treated with doxycycline (Dox) for at least 3 days and subsequently induced to differentiate (D1) into neuroectodermal cells for 12 days in the continuous presence of Dox in differentiation media. On day 12 (D12), the cells were harvested for analysis. Scenario B: Undifferentiated hESCs were induced to differentiate to human neuroectodermal cells (hNECs) for 12 days. At that point (D12), Dox was added to the differentiation media, and the hNECs were allowed to grow for another 7 days in the presence of Dox. On day 19 (D19), the cells were harvested for analysis. (B) Expression of the pluripotency markers OCT4 and NANOG and the differentiation-associated proteins SOX2 and PAX6 as determined by Western blotting of cellular lysates from hNECs prepared either by Scenario A or Scenario B. Equal loading of samples was verified using the anti-β-actin antibody. Description: “C”, cells transfected with empty vector; “1”, cells upon HMGB1 knockdown; “2”, cells upon HMGB2 knockdown; “1/2”, cells upon HMGB1 and HMGB2 knockdown. (C,D) Morphology of neural rosettes as visualized by phase contrast microscopy using an Image Xpress XL automated microscope (Molecular Devices, San Jose, CA, USA; top panels). Bar graphs indicate the relative number of hNECs and quantification of rosette structure formation upon HMGB1 and/or HMGB2 knockdown (lower panels; results are normalized to empty vector-transfected cells). Data were analyzed using Tukey’s multiple comparison test (p > 0.05 = not significant, ns; * p < 0.05; ** p < 0.01; *** p < 0.0001) and represent the mean and SD of three independent experiments. Scale bars = 50, 200 μm.
Figure 3
Figure 3
HMGB1/2 knockdown (KD) can differentially modulate the cell viability of hESCs and hNECs treated with the anticancer drug etoposide. (A) hESCs were treated with increasing concentrations of etoposide (0.17, 0.68, 1.7, 3.4, and 17 μM) for 24 h, and the growth curves were recorded by measuring the absorbance of crystal violet at 570 nm (results were normalized against untreated control cells, which were set as 1). (B) Cleavage of caspase-3 in etoposide-treated hESCs as revealed by Western blotting. Cellular lysates from control (empty vector-transfected) hESCs were treated with increasing concentrations of etoposide (0.17‒3.4 μM) for 3, 4, or 6 h. Equal loading of samples was verified using anti-β-actin antibody. (C) Relative cell count of 3.4 μM etoposide-treated hESCs and hNECs (prepared by Scenarios A or B) was measured using the Cedex automated cell counting system (Roche Diagnostics, Mannheim, Germany) at 0, 6, 12, and 24 h (left to right). Data were analyzed using Bonferroni post hoc test and represent the mean and SD of three independent experiments (* p < 0.05; ** p < 0.001; *** p < 0.001).
Figure 4
Figure 4
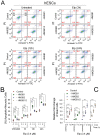
Distinct impact of HMGB KD on apoptosis of hESCs treated with etoposide. (A) Representative dot plots showing Annexin V/propidium iodide (PI) binding assays in etoposide-treated hESCs upon HMGB1 and/or HMGB2 KD, as analyzed by flow cytometry. Q1 (Annexin V−/PI+), dead cells; Q2 (Annexin V+/PI+), late apoptotic and necrotic cells; Q3 (Annexin V−/PI−), viable cells; Q4 (Annexin V+/PI−), early apoptotic cells. Values in red represent percentages of cells in Q1–Q4. (B) Percentage of apoptotic + necrotic cells in hESCs from (A). (C) Relative fold change of total cell death among populations of control or HMGB KD hESCs compared to untreated cells. Error bars represent the mean and SD of three independent experiments. Data were analyzed using either Bonferroni post hoc test for the (percentage of apoptotic + necrotic cells) or Tukey’s multiple comparison test for analysis of the relative fold change of dead cells (p > 0.05 = not significant, ns; * p < 0.05; ** p < 0.01; *** p < 0.001). “C”, cells transfected with empty vector; “HMGB1”, cells upon HMGB1 knockdown; “HMGB2”, cells upon HMGB2 knockdown; “HMGB1/2”, cells upon HMGB1 and HMGB2 knockdown. “1”, cells upon HMGB1 knockdown; “2”, cells upon HMGB2 knockdown; “1/2”, cells upon HMGB1 and HMGB2 knockdown.
Figure 5
Figure 5
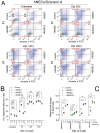
The impact of HMGB1/2 KD on the apoptosis of etoposide-treated hNECs prepared according to Scenario A. (A) Representative dot plots showing Annexin V/propidium iodide (PI) binding assays in hNECs upon HMGB1 and/or HMGB2 KD, followed by etoposide treatment for 0‒24 h, as analyzed by flow cytometry. (B) Percentage of apoptotic/necrotic cells in hESCs from (A). (C) Relative fold change of total cell death among populations of control or HMGB KD hNECs (control cells from each of the cell types were set as 1). Error bars represent the mean and SD of three independent experiments. Data were analyzed using either a Bonferroni post hoc test for the (percentage of apoptotic + necrotic cells) or Tukey’s multiple comparison test for analysis of the relative fold change of dead cells (p > 0.05 = not significant, ns; * p < 0.05; ** p < 0.01; *** p < 0.001). “C”, cells transfected with empty vector; “HMGB1”, cells upon HMGB1 knockdown; “HMGB2”, cells upon HMGB2 knockdown; “HMGB1/2”, cells upon HMGB1 and HMGB2 knockdown. “1”, cells upon HMGB1 knockdown; “2”, cells upon HMGB2 knockdown; “1/2”, cells upon HMGB1 and HMGB2 knockdown.
Figure 6
Figure 6
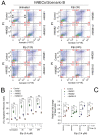
The impact of HMGB1/2 KD on apoptosis of etoposide-treated hNECs prepared according to Scenario B. (A) Representative dot plots showing Annexin V/propidium iodide (PI) binding assays in hNECs upon HMGB1 and/or HMGB2 KD, followed by etoposide treatment for 0‒24 h, as analyzed by flow cytometry. (B) Percentage of apoptotic + necrotic cells in hESCs from (A). (C) Relative fold change of total cell death among populations of control or HMGB KD hNECs compared to untreated cells. Error bars represent the mean and SD of three independent experiments. Data were analyzed using either Bonferroni post hoc test for the (percentage of apoptotic + necrotic cells) or Tukey’s multiple comparison test for analysis of the relative fold change of dead cells (p > 0.05 = not significant, ns; * p < 0.05; ** p < 0.01; *** p < 0.001). “C”, cells transfected with empty vector; “HMGB1”, cells upon HMGB1 knockdown; “HMGB2”, cells upon HMGB2 knockdown; “HMGB1/2”, cells upon HMGB1 and HMGB2 knockdown. “1”, cells upon HMGB1 knockdown; “2”, cells upon HMGB2 knockdown; “1/2”, cells upon HMGB1 and HMGB2 knockdown.
Figure 7
Figure 7
HMGB1 and HMGB2 differentially affect Casp3/PARP cleavage in etoposide-treated hESCs or hNECs. (A‒C) Western blotting of total cellular lysates from hESCs and hNECs prepared by Scenario A or B. Equal loading of samples was verified using anti-β-actin antibody. “C”, cells transfected with empty vector; “1”, cells upon HMGB1 knockdown; “2”, cells upon HMGB2 knockdown; “1/2”, cells upon HMGB1 and HMGB2 knockdown. C-Casp3, cleaved caspase-3; C-PARP, cleaved PARP (poly (ADP-ribose) polymerase); C-RIP, cleaved RIP (receptor-interacting protein kinase).
Figure 8
Figure 8
Accumulation of 53BP1 on telomeres in etoposide-treated cells with deregulated expression of HMGB1/2. (A) hESCs or (B) hESC-derived neuroectodermal cells (hNECs) prepared according to Scenario A. Left panels: Following etoposide exposure (3.4 μM/3 h), control cells and HMGB1- and/or HMGB2-depleted cells were processed for immunofluorescence using antibodies against TRF1 (green) and 53BP1 (red) and staining of DNA (blue). Right panels: bar graphs indicate cells with ≥4 colocalization events of 53BP1 with telomeres (TRF1) as number of TIFs (Telomere Dysfunction-Induced Foci) relative to control cells per nucleus. The number of TIFs per nucleus in control cells was arbitrarily set as 1. In each of the cell lines, ~200 nuclei were analyzed using CellProfiler modular image analysis software (https://cellprofiler.org). Colocalization of 53BP1 with telomeres is indicated by circles, and some colocalization events (enlarged) are circled. “C”, cells transfected with empty vector. Statistical differences among samples were evaluated using one-way ANOVA analysis of variance followed by Tukey’s multiple comparison test; p-value < 0.05 was considered to indicate significance (p > 0.05 = not significant, ns; * p < 0.05, and *** p < 0.001). Scale bar = 5 μm.
Figure 9
Figure 9
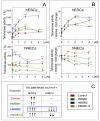
Modulation of telomerase activity by HMGB1 and/or HMGB2 in etoposide-treated hESCs or hNECs. Telomerase activity was determined in hESCs or hESC-derived neuroectodermal cells (hNECs) by qPCR telomeric repeat amplification protocol (TRAP) assay, as detailed in [17]. Cells were treated with etoposide at 0, 0.1, 0.5, 1, 2, or 4 μM for 24 h. (A) Telomerase activity relative to etoposide-untreated control cells (set as 100%). (B) A recalculation of telomerase activity from (A), where both untreated control and HMGB KD cells were set as 1. Red line, control cells transfected with empty vector (no HMGB KD); green line, HMGB1 KD; blue line, HMGB2 KD; dark yellow, HMGB1 and HMGB2 KD; ns, not significant. (C) A summary of the impact of HMGB KD on telomerase activity in etoposide-treated cells. “−”, no change in telomerase activity before and after etoposide treatment; ↑, increased telomerase activity; ↓, decreased telomerase activity (number of arrows indicate the relative strength of impact). Statistical differences among samples were evaluated by one-way ANOVA, followed by Tukey’s multiple comparison test. Values of p < 0.05 were considered significant (* p < 0.05, ** p < 0.01, *** p < 0.001, **** p < 0.0001).

References

    1. Thomson J.A., Itskovitz-Eldor J., Shapiro S.S., Waknitz M.A., Swiergiel J.J., Marshall V.S., Jones J.M. Embryonic stem cell lines derived from human blastocysts. Science. 1998;282:1145–1147. doi: 10.1126/science.282.5391.1145. - DOI - PubMed
    1. Shroff G. Therapeutic potential of human embryonic stem cells in type 2 diabetes mellitus. World J. Stem Cells. 2016;8:223–230. doi: 10.4252/wjsc.v8.i7.223. - DOI - PMC - PubMed
    1. Filion T.M., Qiao M., Ghule P.N., Mandeville M., van Wijnen A.J., Stein J.L., Lian J.B., Altieri D.C., Stein G.S. Survival responses of human embryonic stem cells to DNA damage. J. Cell. Physiol. 2009;220:586–592. doi: 10.1002/jcp.21735. - DOI - PMC - PubMed
    1. Štros M. HMGB proteins: Interactions with DNA and chromatin. Biochim Biophys Acta. 2010;1799:101–113. doi: 10.1016/j.bbagrm.2009.09.008. - DOI - PubMed
    1. Tripathi A., Shrinet K., Kumar A. HMGB1 protein as a novel target for cancer. Toxicol. Rep. 2019;6:253–261. doi: 10.1016/j.toxrep.2019.03.002. - DOI - PMC - PubMed

Publication types

MeSH terms