. 2020 Oct;13(10):e010586.
doi: 10.1161/CIRCIMAGING.120.010586. Epub 2020 Oct 20.

Imaging Cardiovascular and Lung Macrophages With the Positron Emission Tomography Sensor 64Cu-Macrin in Mice, Rabbits, and Pigs

Affiliations

Imaging Cardiovascular and Lung Macrophages With the Positron Emission Tomography Sensor 64Cu-Macrin in Mice, Rabbits, and Pigs

Matthias Nahrendorf et al. Circ Cardiovasc Imaging. 2020 Oct.

Abstract

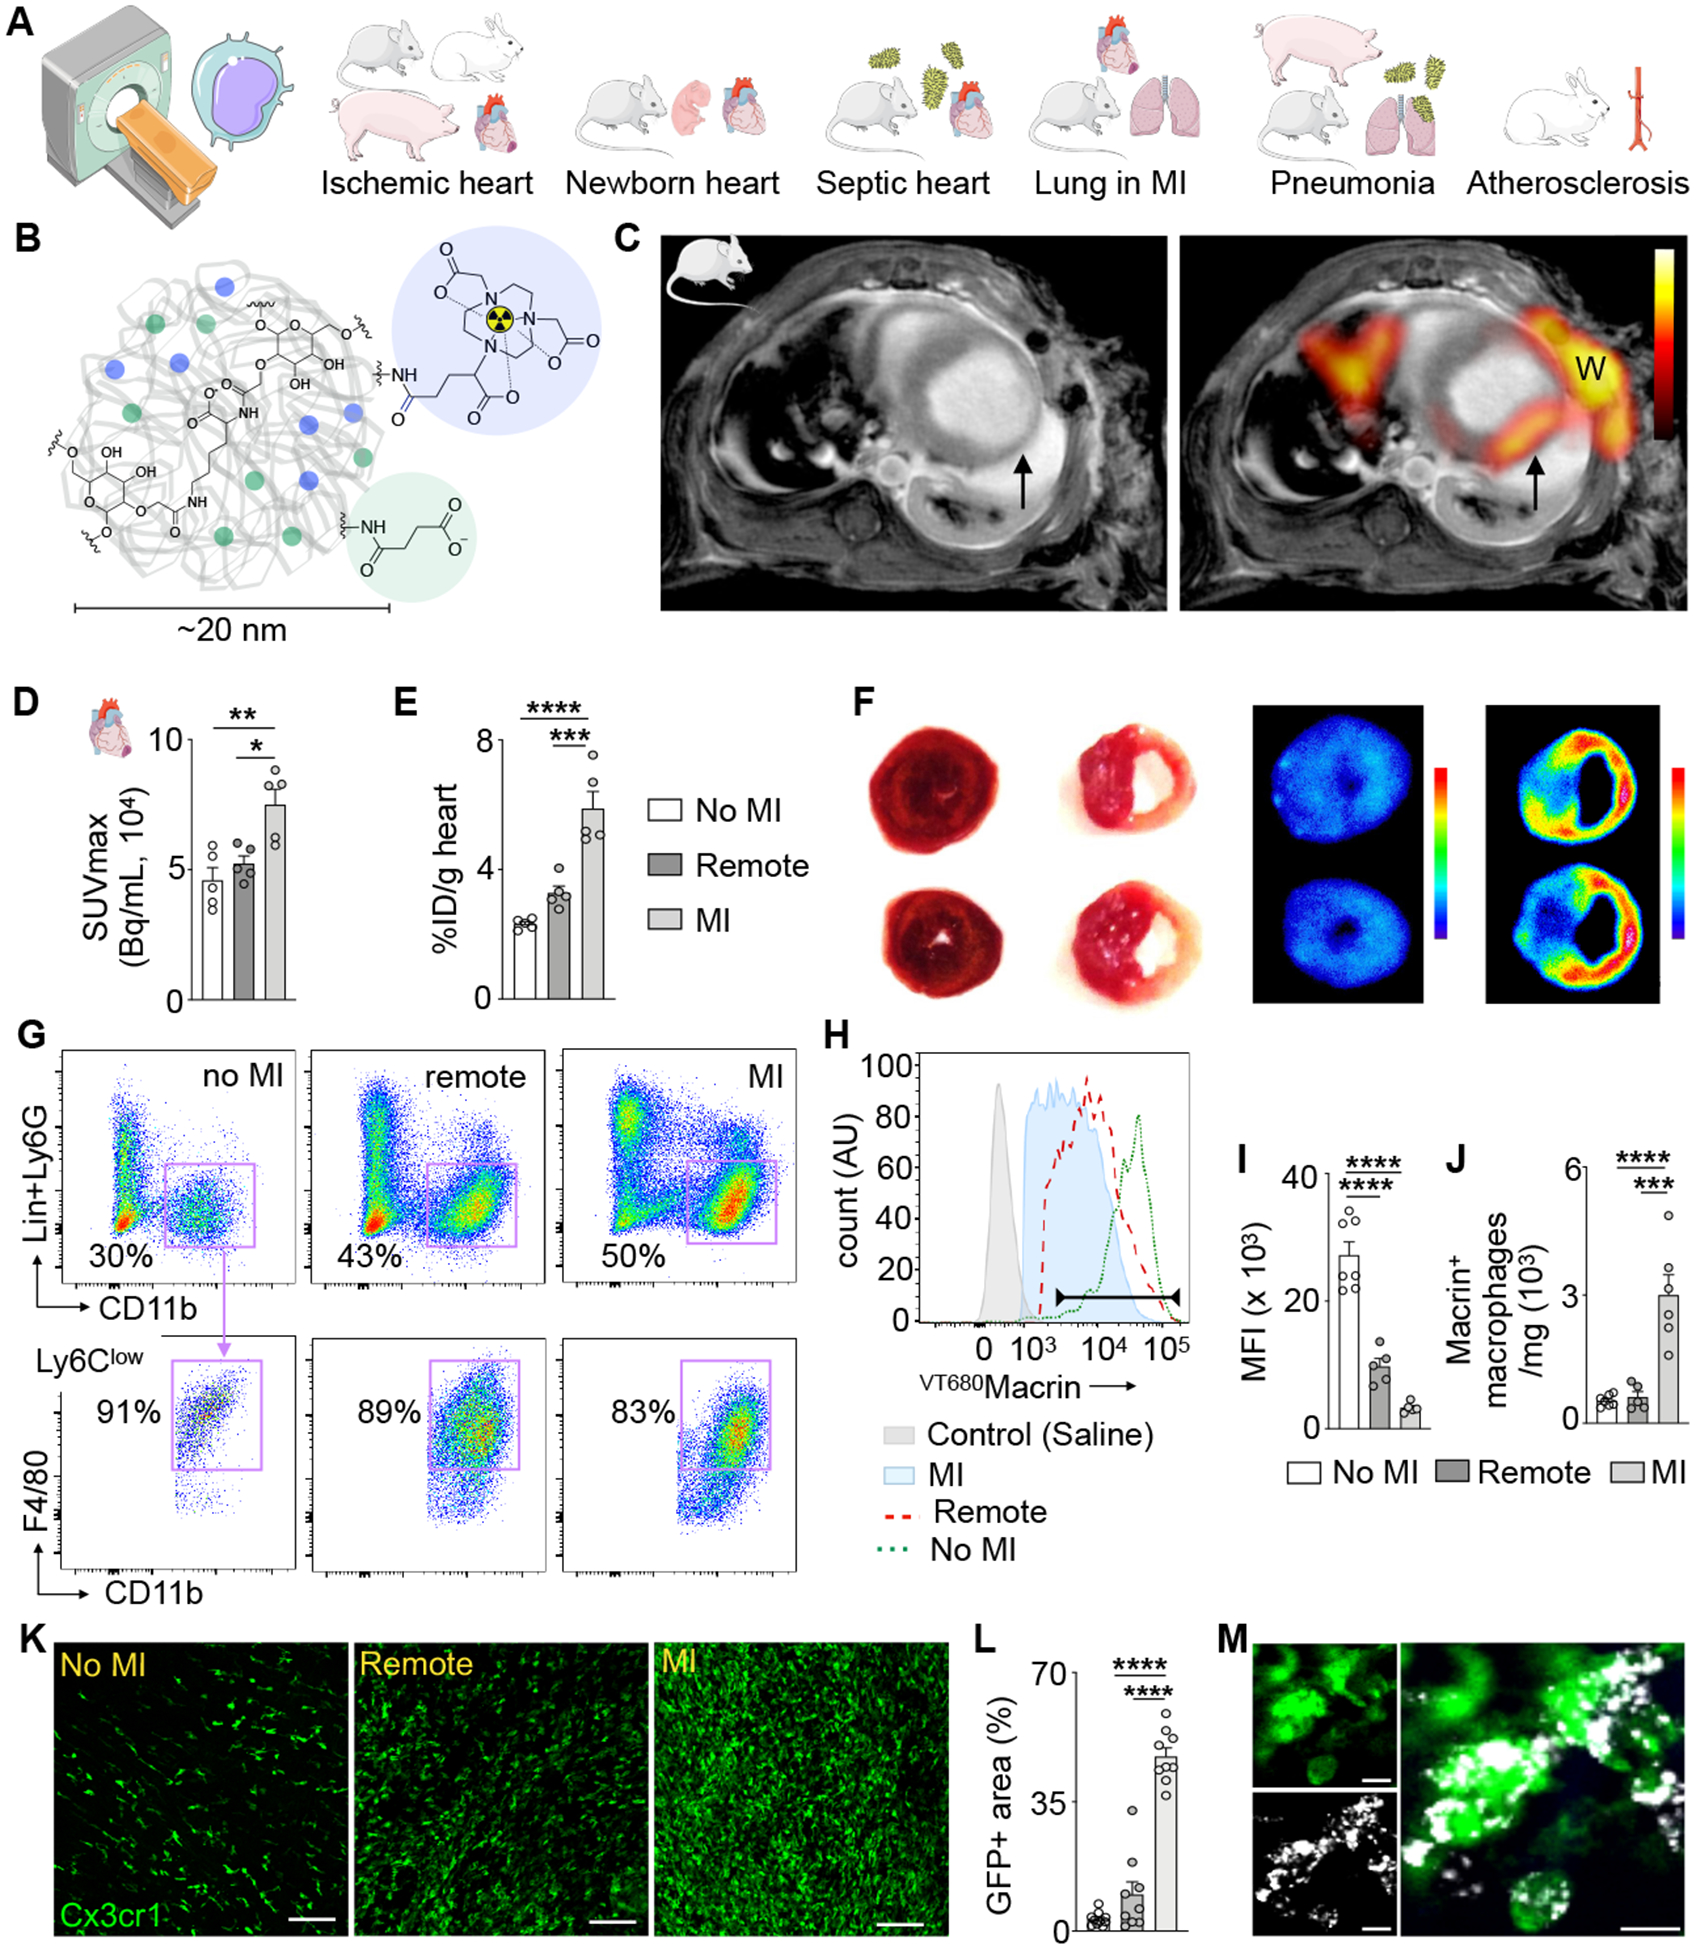
Background: Macrophages, innate immune cells that reside in all organs, defend the host against infection and injury. In the heart and vasculature, inflammatory macrophages also enhance tissue damage and propel cardiovascular diseases.

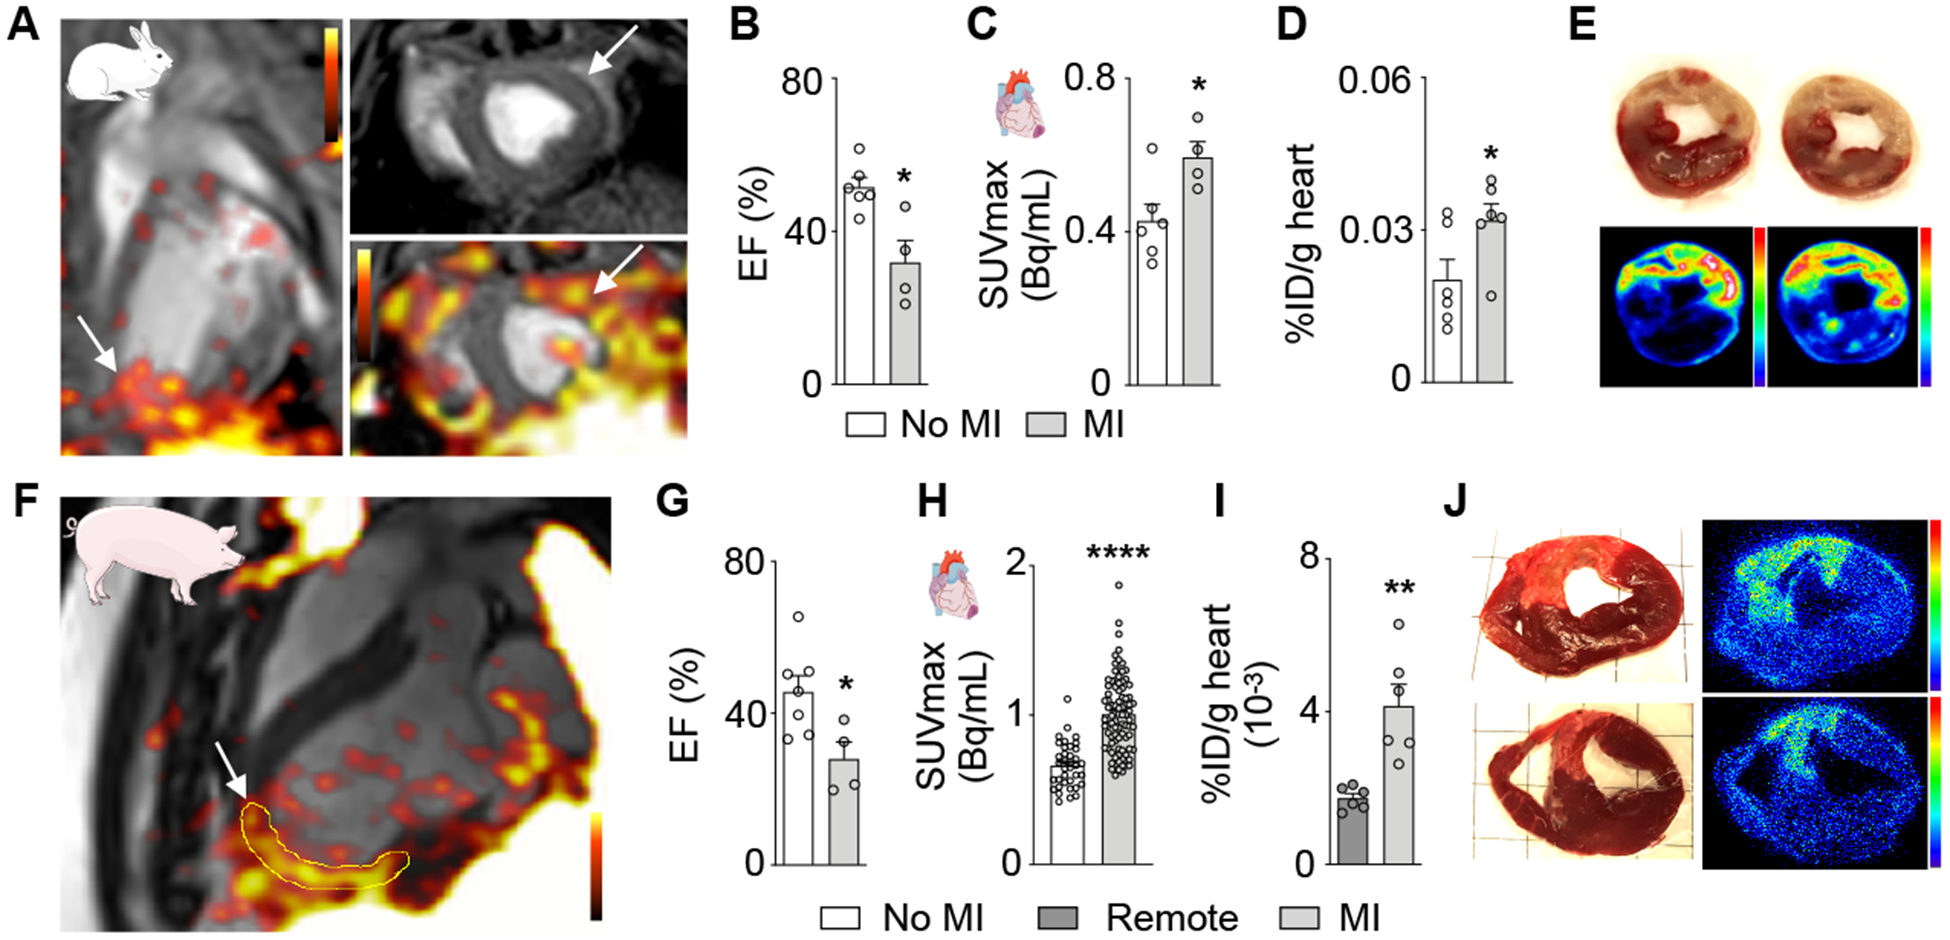
Methods: We here use in vivo positron emission tomography (PET) imaging, flow cytometry, and confocal microscopy to evaluate quantitative noninvasive assessment of cardiac, arterial, and pulmonary macrophages using the nanotracer 64Cu-Macrin-a 20-nm spherical dextran nanoparticle assembled from nontoxic polyglucose.

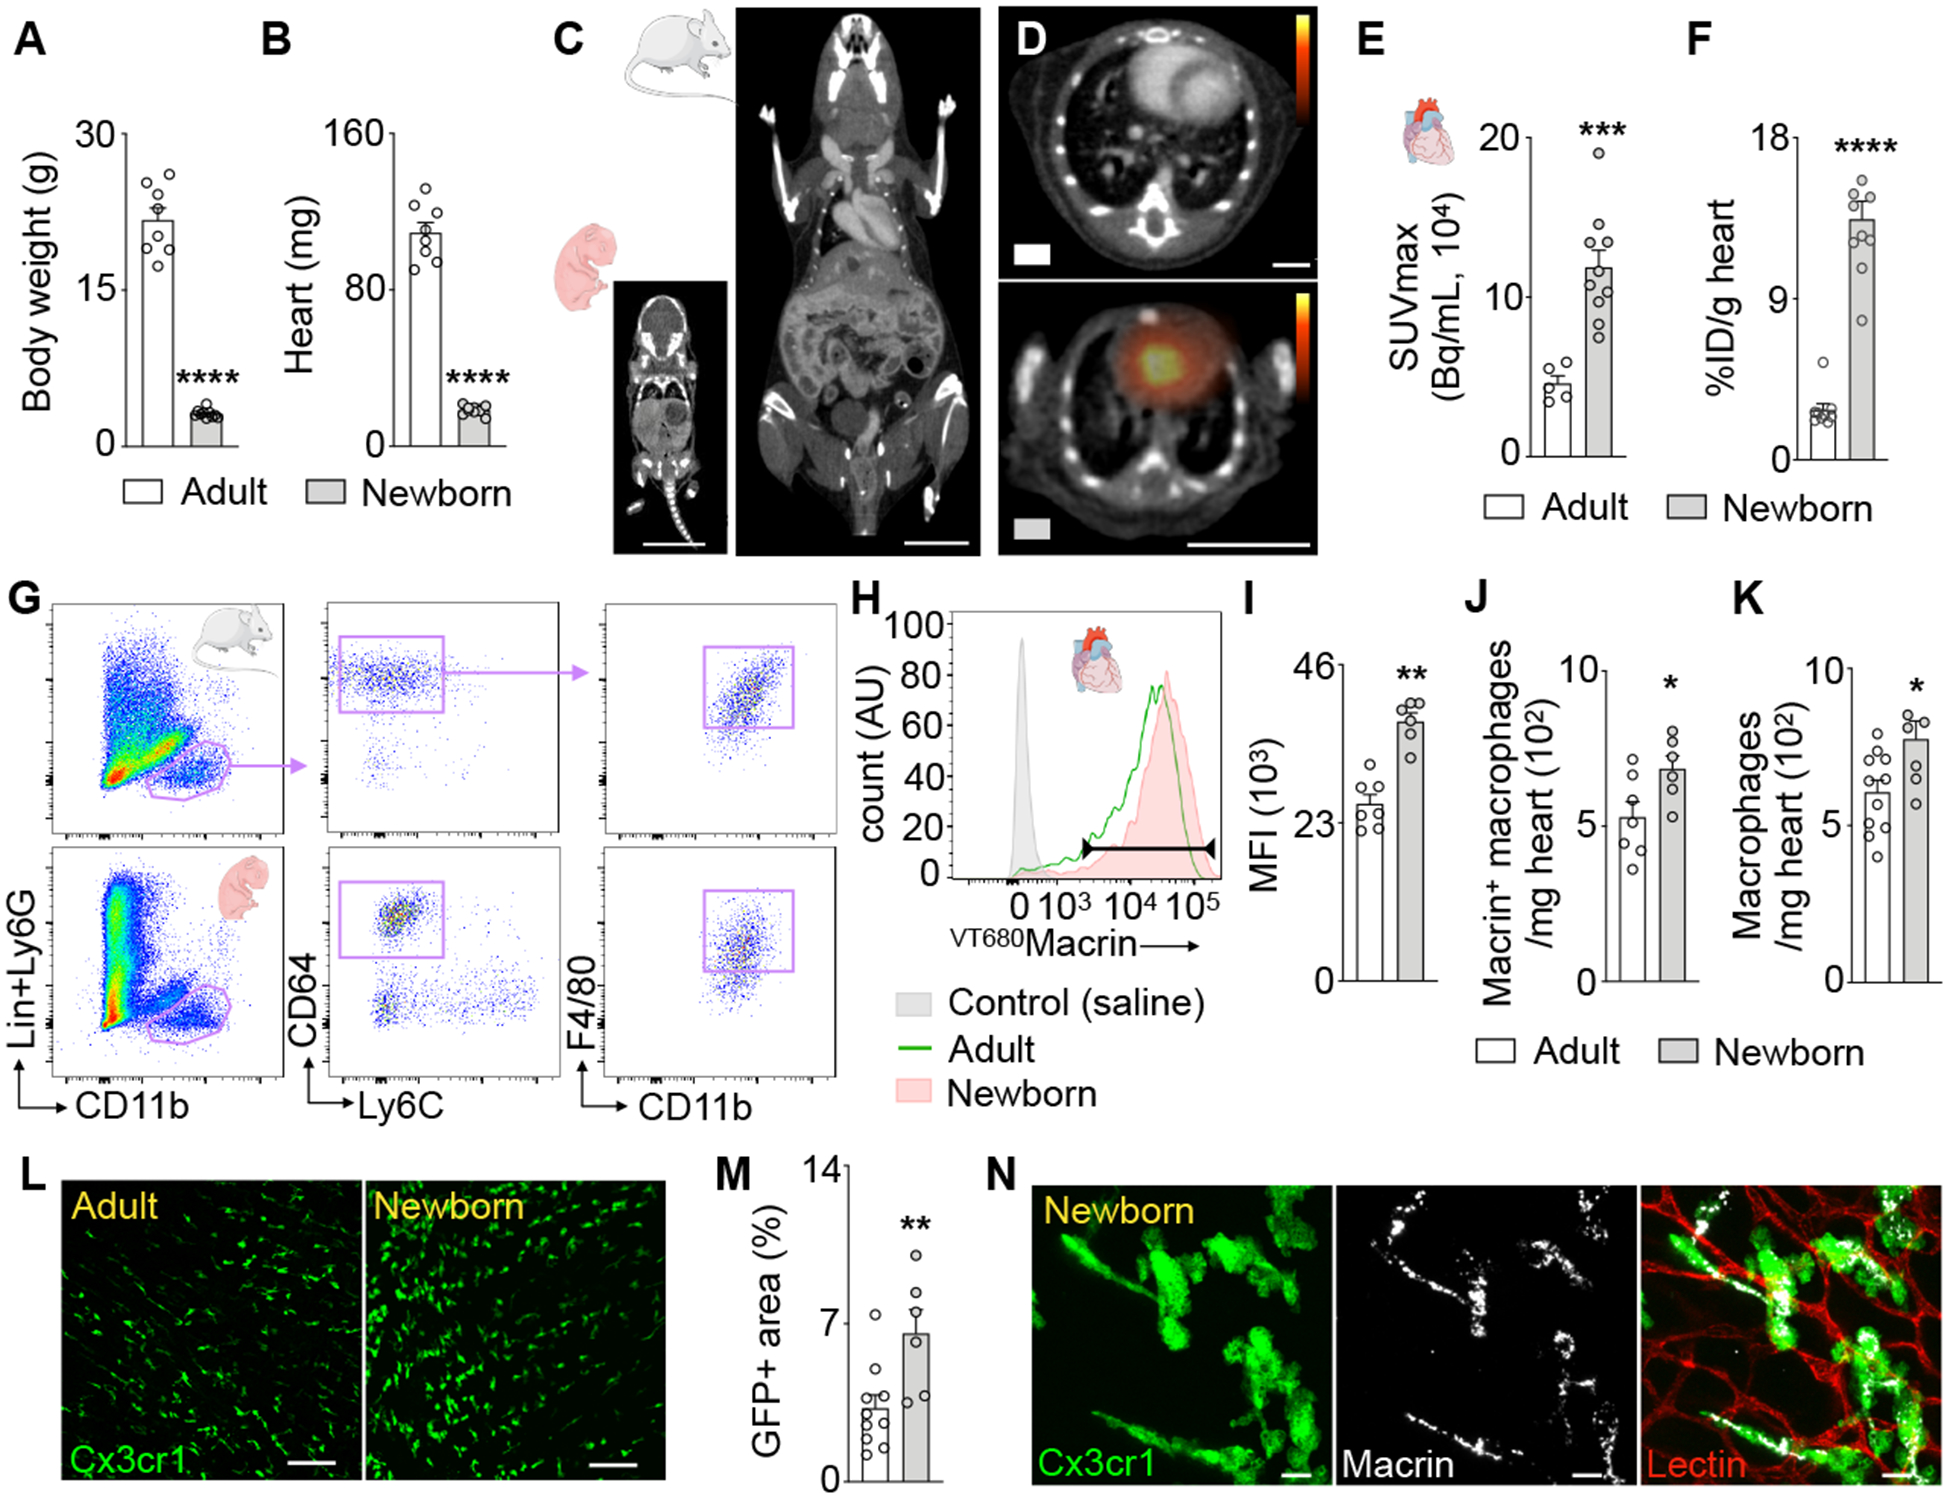
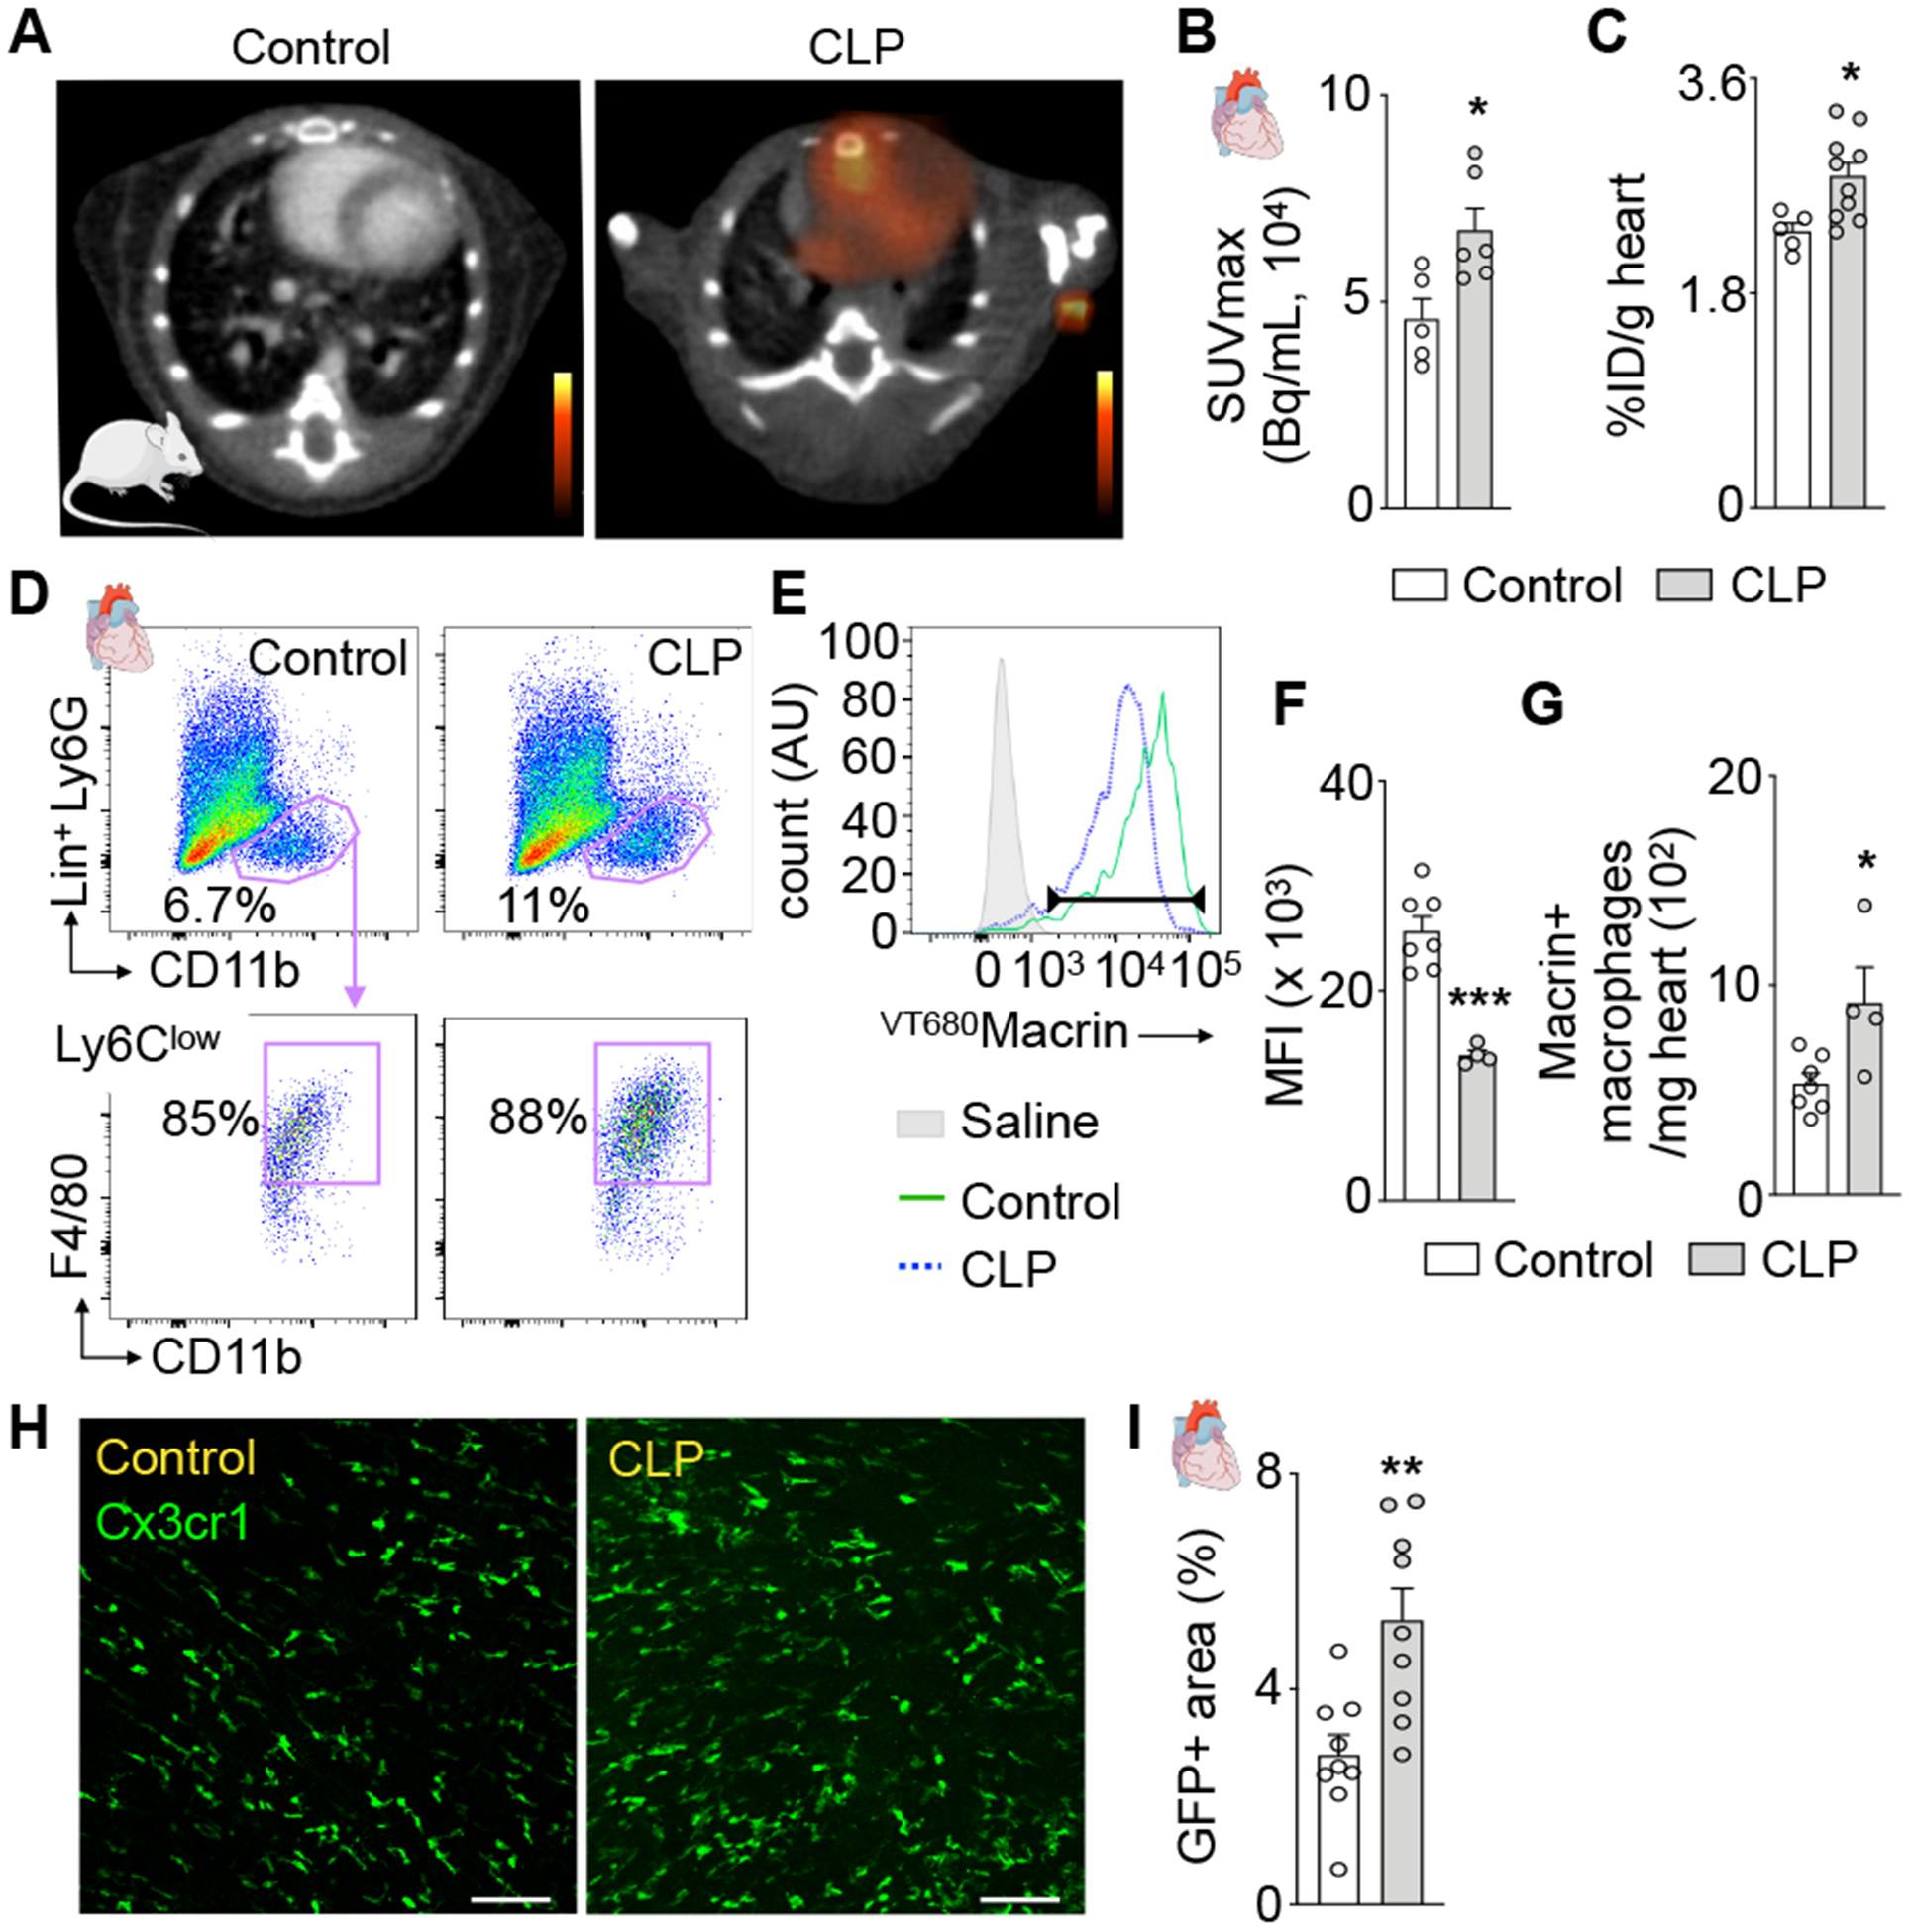
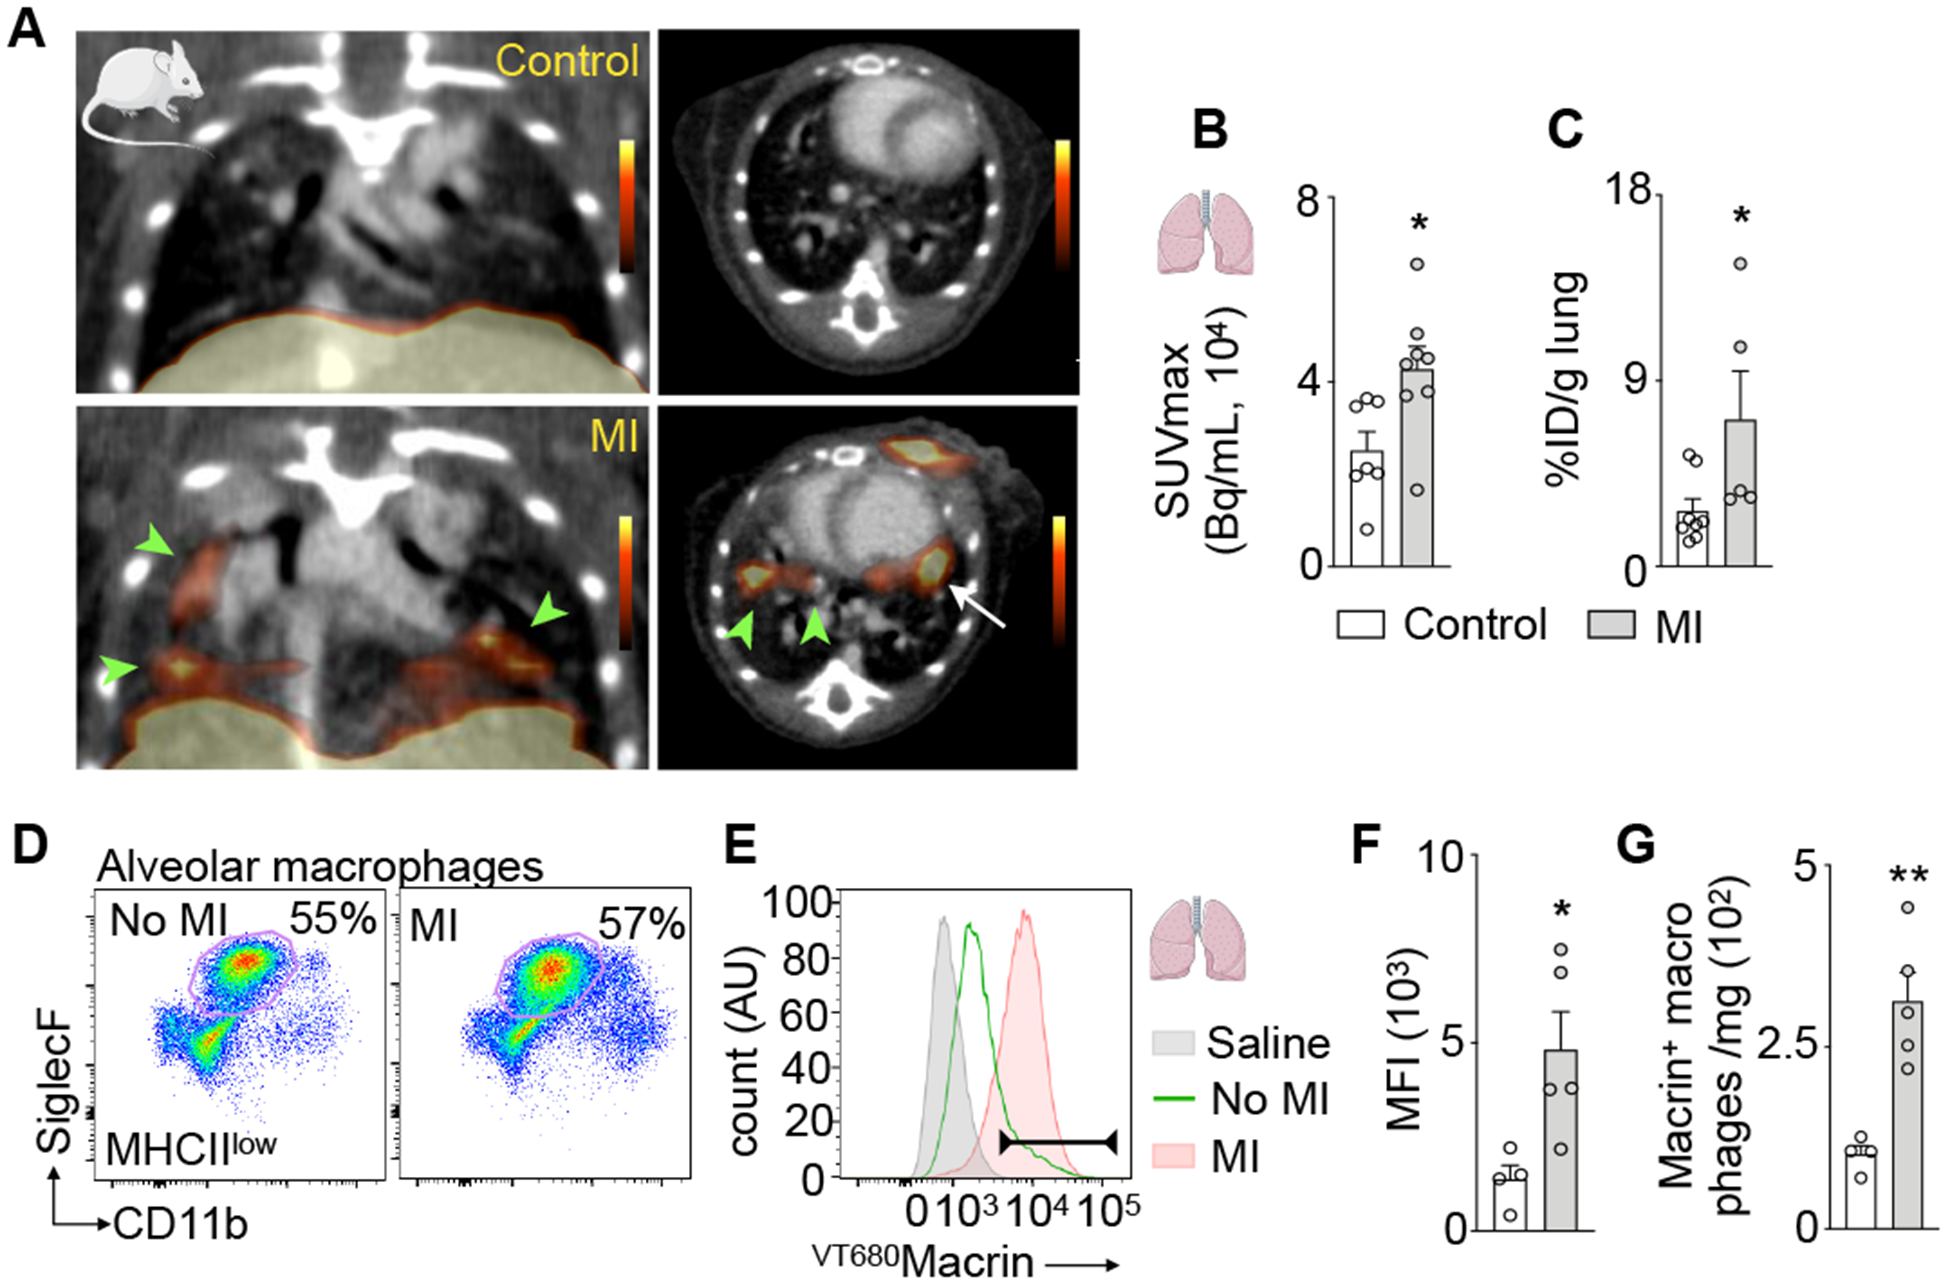
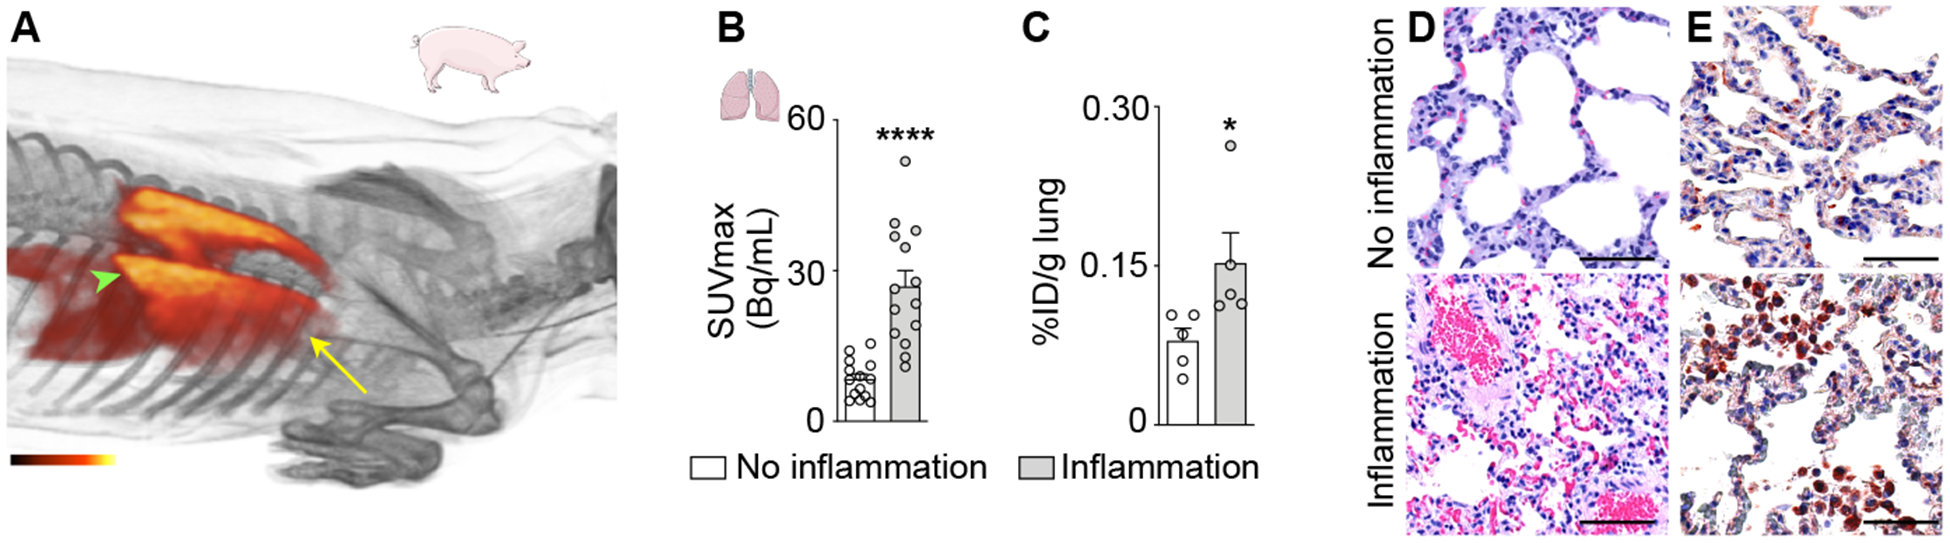
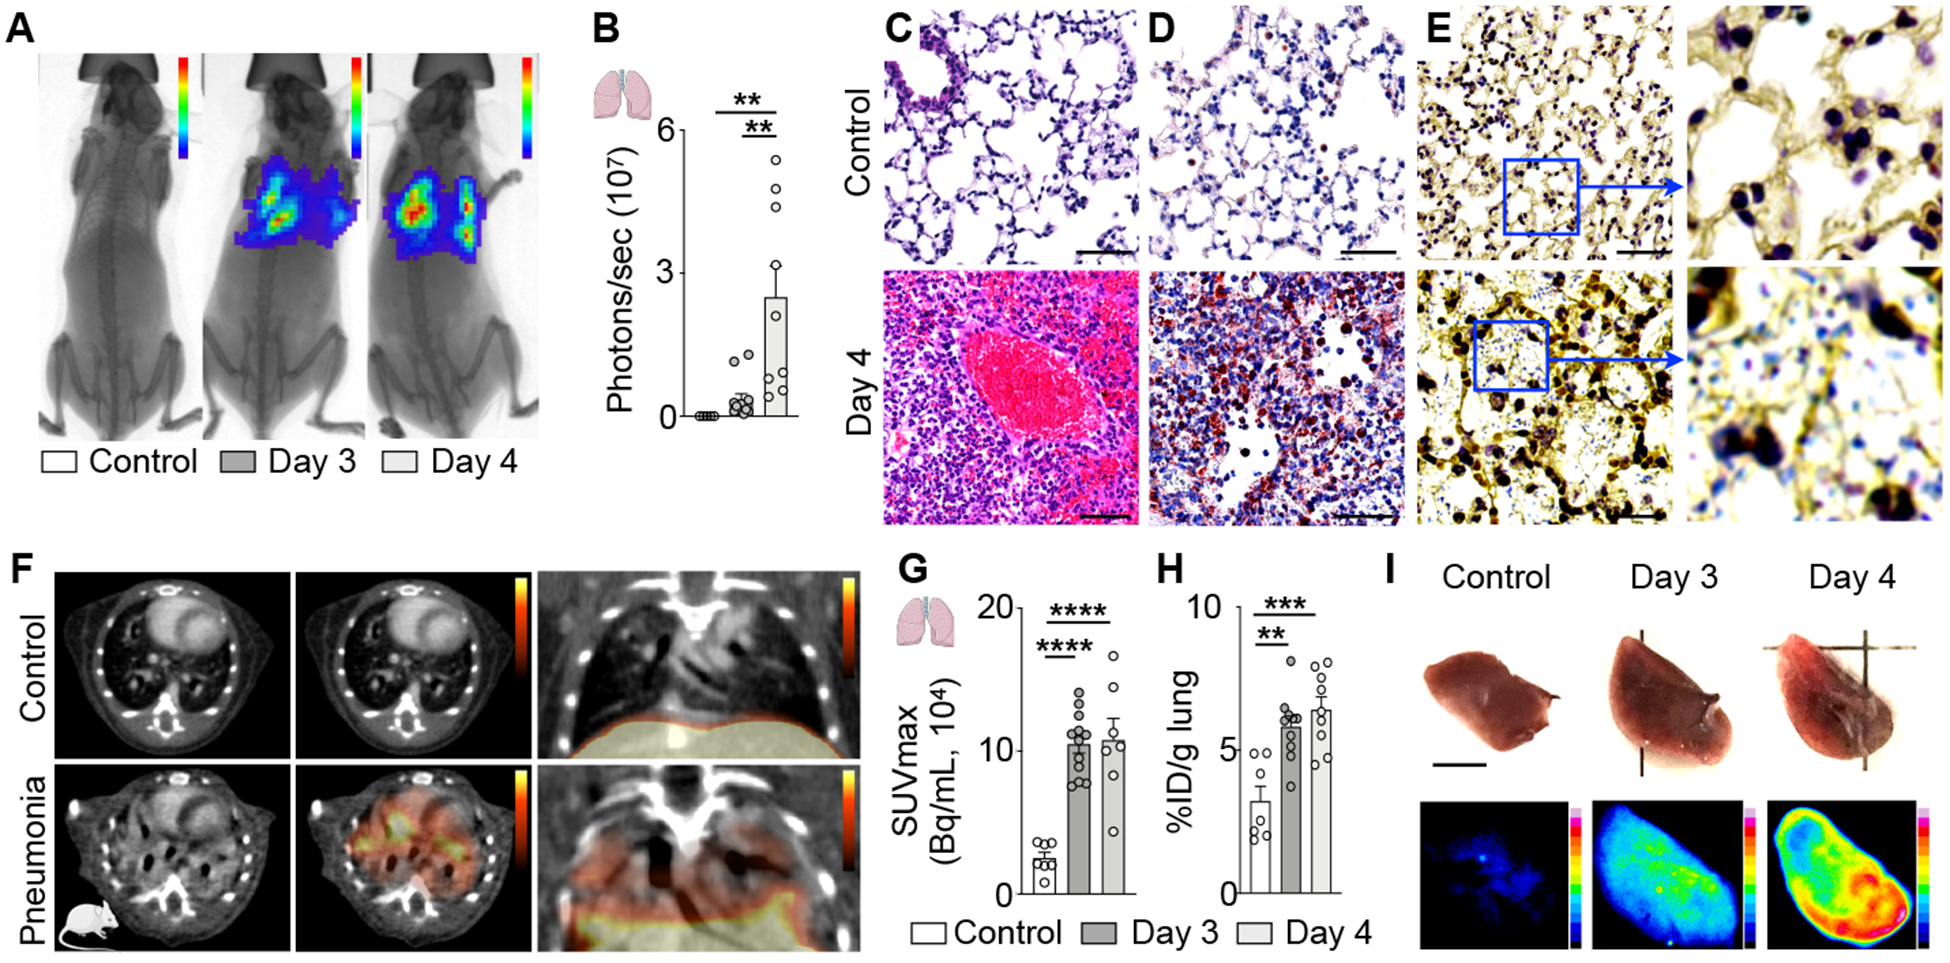
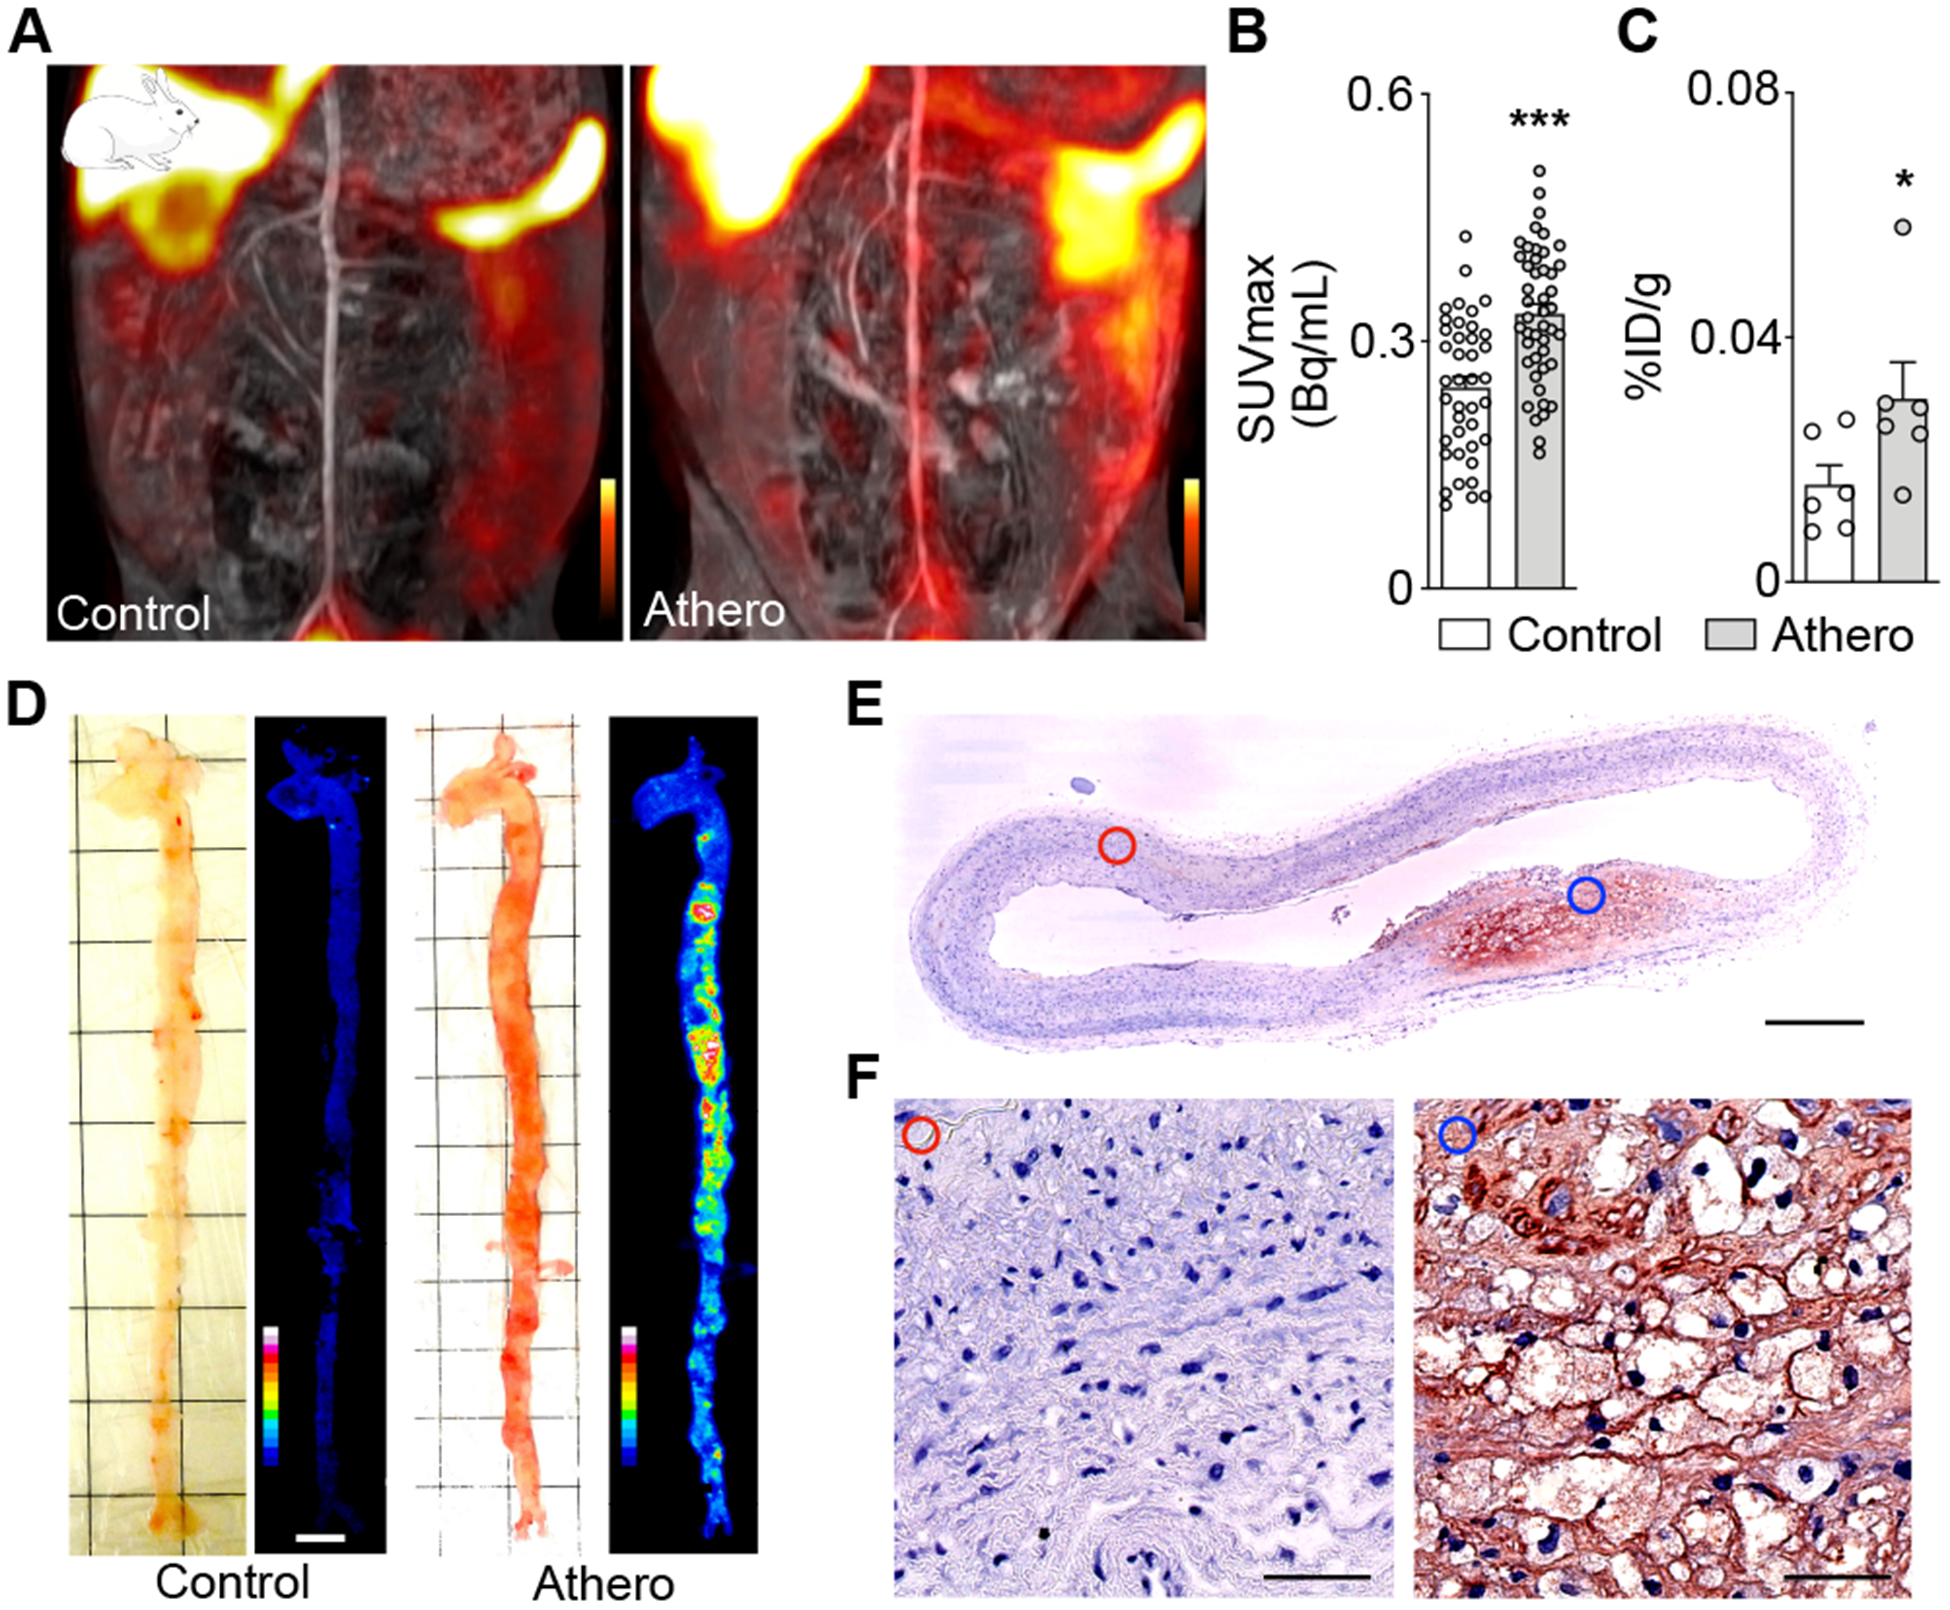
Results: PET imaging using 64Cu-Macrin faithfully reported accumulation of macrophages in the heart and lung of mice with myocardial infarction, sepsis, or pneumonia. Flow cytometry and confocal microscopy detected the near-infrared fluorescent version of the nanoparticle (VT680Macrin) primarily in tissue macrophages. In 5-day-old mice, 64Cu-Macrin PET imaging quantified physiologically more numerous cardiac macrophages. Upon intravenous administration of 64Cu-Macrin in rabbits and pigs, we detected heightened macrophage numbers in the infarcted myocardium, inflamed lung regions, and atherosclerotic plaques using a clinical PET/magnetic resonance imaging scanner. Toxicity studies in rats and human dosimetry estimates suggest that 64Cu-Macrin is safe for use in humans.

Conclusions: Taken together, these results indicate 64Cu-Macrin could serve as a facile PET nanotracer to survey spatiotemporal macrophage dynamics during various physiological and pathological conditions. 64Cu-Macrin PET imaging could stage inflammatory cardiovascular disease activity, assist disease management, and serve as an imaging biomarker for emerging macrophage-targeted therapeutics.

Keywords: heart; macrophages; myocardial infarction; nanoparticles; pneumonia.


Figures

Figure 1.
Figure 1.. 64Cu-Macrin PET imaging detects cardiac macrophage expansion following acute myocardial infarction in mice.
(A) Outline of macrophage imaging basket trial. (B) Schematic view of 64Cu-Macrin polyglucose nanoparticle. (C) Short axis PET fused to MRI of mouse heart on day 5 after myocardial infarction (MI, arrow; W, surgical wound). Left image shows delayed enhancement MRI only, right is fused with PET. (D) In vivo PET signal, calculated as SUVmax in naive controls (no MI) and in the infarct (MI) and non-infarcted myocardium of mice with MI (remote). (E) Macrin accumulation in heart tissue by ex vivo scintillation counting and expressed as a percent injected dose per gram tissue (%ID/g). (F) TTC staining (left) and autoradiography (right) of mouse short axis rings from naive control and mouse with MI (right, infarct tissue is pale). (G) Flow plots of cardiac macrophages from control mice and from remote and infarcted myocardium from mice with MI. Hearts were excised 24 h after IV injection of VT680Macrin. (H) Histogram of VT680Macrin uptake by cardiac macrophages in saline-injected naive controls (shaded grey), control (no MI, dotted green line), ischemic myocardium (MI, red dashed line) and remote myocardium in mice with MI (shaded blue). (I) VT680Macrin mean fluorescent intensity in cardiac macrophages and (J) VT680Macrin+ macrophage numbers. (K) Confocal microscopy of GFP expressing macrophages in Cx3cr1GFP/+ mice on day 5 after MI (scale bar, 100 μm). (L) Quantitation of GFP+ area in groups as depicted in (D). (M) High-magnification confocal image of VT680Macrin (grey) and green macrophages (scale bar, 10 μm). Data are mean ± SEM. *P<0.05, **P<0.01, ***P<0.001, ****P<0.0001.
Figure 2.
Figure 2.. 64Cu-Macrin PET imaging detects cardiac macrophage expansion following acute myocardial infarction in rabbits and pigs.
(A) PET/MR image of rabbit heart on day 3 after MI (arrows) and 24 h post injection of 64Cu-Macrin. (B) Left ventricular ejection fraction (EF), assessed by MRI (n=4–6 rabbits per cohort). (C) In vivo 64Cu-Macrin PET signal in rabbit hearts. (D) Ex vivo 64Cu-Macrin uptake in rabbit heart (%ID/g). (E) TTC-stained rabbit heart tissue (upper row) shows pale infarcts with high activity on autoradiography exposure (bottom). (F) Long axis PET/MR image of a pig 3 days after MI (arrow), 24 h post administration of 64Cu-Macrin. (G) EF in pigs assessed by MRI before and after MI (n=4–7 per cohort). (H) PET signal in infarcted and non-infarcted control myocardium. Each dot represents a myocardial segment of the AHA circumferential polar plot (n=4–7 pigs per cohort). (I) Ex vivo 64Cu-Macrin uptake in pig hearts by scintillation counting (%ID/g). (J) TTC images (left) and autoradiography exposure (right) of infarcted pig heart. Data are mean ± SEM. *P<0.05, **P<0.01, ***P<0.001, ****P<0.0001.
Figure 3.
Figure 3.. In vivo assessment of cardiac macrophages in newborn mice using 64Cu-Macrin PET.
(A) Body and (B) heart weight of adult (9–10 weeks) and 5-day-old mice. (C) CT images of newborn and adult mouse (scale bar, 1cm). (D) PET/CT images visualize 64Cu-Macrin uptake in adult (top) and newborn mouse heart (scale bar, 1cm). (E) 64Cu-Macrin PET quantified as SUVmax and (F) ex vivo scintillation counting. (G) Flow cytometry gating for cardiac macrophages in adult and newborn mice. (H) Histogram showing VT680Macrin uptake in cardiac macrophages. Controls injected with saline (shaded grey), adult (solid green) and newborn mice (shaded orange). (I) Mean fluorescence intensity (MFI) in heart macrophages. (J) Number of VT680Macrin+ macrophages in the heart. (K) Macrophage numbers assessed by flow cytometry. (L) Confocal images of myocardium in Cx3cr1GFP/+ mice (scale bar, 100 μm). (M) GFP+ area in hearts of Cx3cr1GFP/+ mice by confocal microscopy. (N) VT680Macrin (grey) co-localizes with GFP+ macrophages in the heart of a newborn Cx3cr1GFP/+ mouse (scale bar, 10μm). Data are mean ± SEM. *P<0.05, **P<0.01, ***P<0.001, ****P<0.0001.
Figure 4.
Figure 4.. 64Cu-Macrin PET detects cardiac macrophage dynamics in sepsis.
(A) PET/CT of the heart in a control mouse and a mouse after cecal ligation and puncture (CLP). (B) 64Cu-Macrin uptake in myocardium by in vivo PET and (C) ex vivo scintillation counting. (D) Flow cytometry of cardiac macrophages in controls and mice after CLP. (E) Histogram of VT680Macrin uptake in cardiac macrophages. Saline-injected control group without CLP (shaded grey), control mice injected with VT680Macrin (solid green) and after CLP (dotted blue). (F) VT680Macrin mean fluorescent intensity (MFI) in cardiac macrophages. (G) Number of VT680Macrin+ cardiac macrophages. (H) Confocal microscopy of control and after CLP in Cx3cr1GFP/+ mice (scale bar, 100 μm). (I) GFP-positive area in confocal heart images. Data are mean ± SEM. *P<0.05, **P<0.01, ***P<0.001.
Figure 5.
Figure 5.. 64Cu-Macrin PET detects lung macrophage dynamics after MI.
(A) Coronal and axial PET/CT images from control mouse (top) and mouse on day 5 after MI (bottom). Areas with high uptake in lung are indicated with arrowheads. Arrow indicates MI. (B) 64Cu-Macrin signal in lung quantified by PET and (C) ex vivo scintillation counting. (D) Flow plots of alveolar macrophages in controls and mice after MI. (E) VT680Macrin fluorescence of alveolar macrophages; saline-injected controls (shaded grey), VT680Macrin injected control mice (solid green) and MI (shaded orange). (F) VT680Macrin mean fluorescence intensity (MFI) in alveolar macrophages. (G) Number of Macrin+ alveolar macrophages. Data are mean ± SEM. *P<0.05, **P<0.01, ***P<0.001.
Figure 6.
Figure 6.. 64Cu-Macrin PET imaging detects lung inflammation in pigs.
(A) 3-dimensional PET/MRI reconstruction of pig thorax 24 h post injection of 64Cu-Macrin. Arrowhead indicates basal lung region with high PET signal; arrow indicates apical lung region with lower 64Cu-Macrin uptake. (B) 64Cu-Macrin accumulation in lungs of n=8 pigs as analyzed by in vivo PET (SUVmax in multiple lung region of interests) and (C) ex vivo scintillation counting of lung tissues. (D) H&E histology and (E) immunohistochemistry for macrophages from normal (top) and inflamed (bottom) pig lung regions (scale bar, 50 μm).
Figure 7.
Figure 7.. 64Cu-Macrin PET imaging detects lung inflammation in mice.
(A) Bioluminescent / X-ray images of control mouse (left) and mice with pneumonia on days 3 and 4 after inoculation with bioluminescent Streptococcus pneumoniae. (B) Bacterial burden assessed by bioluminescence. (C-E) Lung histology from uninfected controls (top) and mice with pneumonia (bottom, day 4; scale bar, 50 μm), (C) H&E, (D) IHC for mouse macrophages (brown) and (E) gram-staining for streptococcus pneumoniae (pale blue). (F) PET/CT images from control mouse (top) and mouse with pneumonia (bottom, day 4 after infection). (G) 64Cu-Macrin lung uptake by in vivo PET and (H) ex vivo scintillation counting. (I) Visualization of 64Cu-Macrin accumulation in mouse lungs by autoradiography (scale bar, 5 mm). Data are mean ± SEM. *P<0.05, **P<0.01, ***P<0.001, ****P<0.0001.
Figure 8.
Figure 8.. 64Cu-Macrin PET imaging of atheromatous plaques in rabbits.
(A) Coronal PET/MR images of the abdominal aorta in a control rabbit (left) and a rabbit with atherosclerosis (right) 24 h post injection. (B) In vivo 64Cu-Macrin PET signal in aortic segments (n=6 rabbits per group). (C) 64Cu-Macrin uptake in aortae as measured by ex vivo scintillation counting. (D) Bright-field image (left) and autoradiography (right) of dissected rabbit aortae (scale bar, 1 cm). (E) Immunohistochemical staining for macrophages in rabbit aortae (scale bar, 0.5 mm). (F) Images from normal region (left, red circle) and atherosclerotic lesion (right, blue circle) (scale bar, 50 μm). Data are mean ± SEM. *P<0.05, ***P<0.001.

Comment in

References

    1. Lavin Y, Mortha A, Rahman A, Merad M. Regulation of macrophage development and function in peripheral tissues. Nat Rev Immunol. 2015;15:731–744. - PMC - PubMed
    1. Nahrendorf M. Myeloid cell contributions to cardiovascular health and disease. Nat Med. 2018;24:711–720. - PMC - PubMed
    1. Swirski FK, Nahrendorf M. Cardioimmunology: the immune system in cardiac homeostasis and disease. Nat Rev Immunol. 2018;18:733–744. - PubMed
    1. Hoyer FF, Naxerova K, Schloss MJ, Hulsmans M, Nair AV, Dutta P, Calcagno DM, Herisson F, Anzai A, Sun Y, Wojtkiewicz G, et al. Tissue-Specific Macrophage Responses to Remote Injury Impact the Outcome of Subsequent Local Immune Challenge. Immunity. 2019;51:899–914.e7. - PMC - PubMed
    1. Panizzi P, Swirski FK, Figueiredo JL, Waterman P, Sosnovik DE, Aikawa E, Libby P, Pittet M, Weissleder R, Nahrendorf M. Impaired infarct healing in atherosclerotic mice with Ly-6C(hi) monocytosis. J Am Coll Cardiol. 2010;55:1629–1638. - PMC - PubMed

Publication types

MeSH terms