. 2020 Oct;48(10):300060520958808.
doi: 10.1177/0300060520958808.

Machine learning identifies two autophagy-related genes as markers of recurrence in colorectal cancer

Affiliations

Machine learning identifies two autophagy-related genes as markers of recurrence in colorectal cancer

Jianping Wu et al. J Int Med Res. 2020 Oct.

Abstract

Objective: Colorectal cancer (CRC) is the most common cancer worldwide. Patient outcomes following recurrence of CRC are very poor. Therefore, identifying the risk of CRC recurrence at an early stage would improve patient care. Accumulating evidence shows that autophagy plays an active role in tumorigenesis, recurrence, and metastasis.

Methods: We used machine learning algorithms and two regression models, univariable Cox proportion and least absolute shrinkage and selection operator (LASSO), to identify 26 autophagy-related genes (ARGs) related to CRC recurrence.

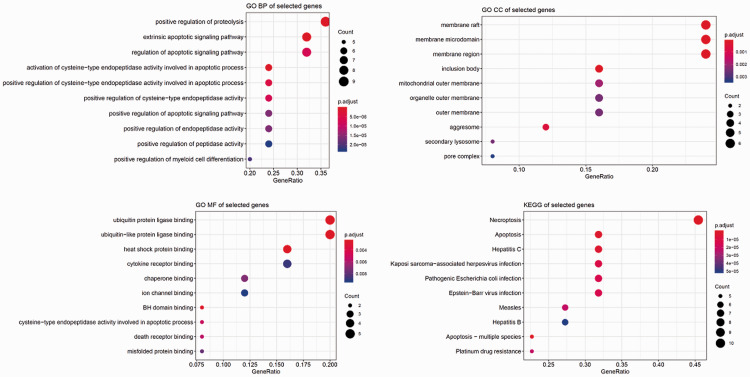
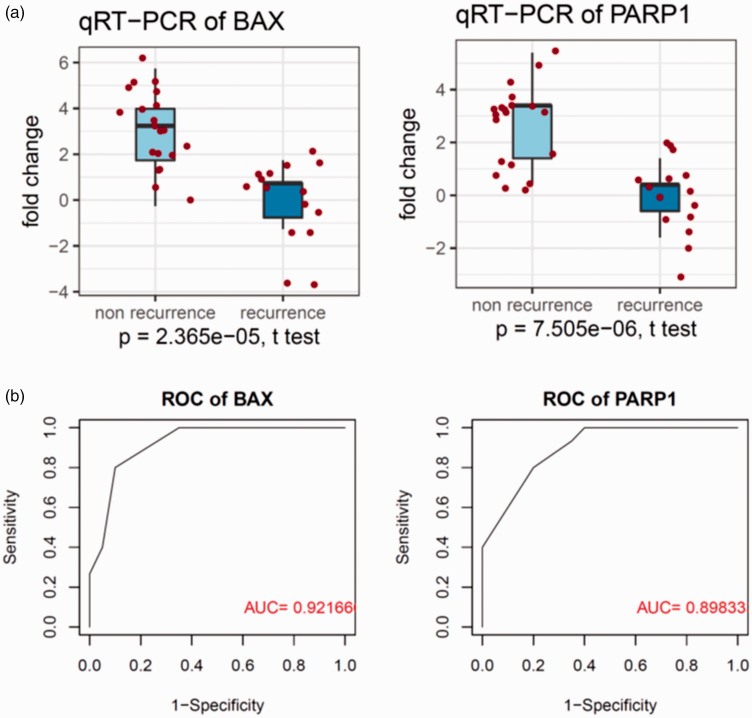
Results: By functional annotation, these ARGs were shown to be enriched in necroptosis and apoptosis pathways. Protein-protein interactions identified SQSTM1, CASP8, HSP80AB1, FADD, and MAPK9 as core genes in CRC autophagy. Of 26 ARGs, BAX and PARP1 were regarded as having the most significant predictive ability of CRC recurrence, with prediction accuracy of 71.1%.

Conclusion: These results shed light on prediction of CRC recurrence by ARGs. Stratification of patients into recurrence risk groups by testing ARGs would be a valuable tool for early detection of CRC recurrence.

Keywords: Colorectal cancer; autophagy; autophagy-related gene; machine learning; recurrence; regression.


Figures

Figure 1.
Figure 1.
Quantile normalization was used to remove the batch effect of data in two public datasets (GSE64857 and GSE28722) from the Gene Expression Omnibus.
Figure 2.
Figure 2.
Overview of biomarker discovery using two public datasets (GSE64857 and GSE28722) from the Gene Expression Omnibus. The two PCA plots on the left show the differences in samples for recurrent and non-recurrent colorectal cancer for the top 1000 variable genes. The right-hand panel shows the PCA plot indicating differences in samples by autophagy-related genes. PCA, principal component analysis.
Figure 3.
Figure 3.
The enriched pathways of ARGs in CRC recurrence. The significance of annotated pathways is denoted by color and the number of genes enriched is indicated by the size of dots. (A) Top 10 biological processes enriched by ARGs; (B) top 10 cellular components of ARGs; (C) top 10 molecular functions of ARGs; and (D) top 10 KEGG pathways of ARGs. ARG, autophagy-related gene; CRC, colorectal cancer; GO, Gene Ontology; BP, biological process; CC, cellular component; MF, molecular function; KEGG, Kyoto Encyclopedia of Genes and Genomes.
Figure 4.
Figure 4.
The protein–protein interaction network showing the core genes in ARG signatures. Each node represents the gene signature, and the length of the lines indicates the degree of correlation between genes. ARG, autophagy-related gene.
Figure 5.
Figure 5.
Diagnostic and prognostic capacity of ARG signatures in CRC. (A) Coefficient of variance plot of LASSO regression. (B) Coefficient plot of LASSO regression results. (C) ROC curves showing the diagnostic capacity of ARG signatures for CRC recurrence; the area under the curve is 0.711. (D) Kaplan–Meier curves of CRC stratified by ARG signature using the log-rank test. LASSO, least absolute shrinkage and selection operator; ARG, autophagy-related gene; CRC, colorectal cancer; ROC, receiver-operator characteristic; AUC, area under the curve.
Figure 6.
Figure 6.
Validation of ARG signatures in an independent cohort. (A) Boxplots showing the differential expression of BAX and PARP1 between recurrent and non-recurrent CRC. (B) ROC curves showing the accuracy of the two ARG signatures. ARG, autophagy-related gene; CRC, colorectal cancer; ROC, receiver-operator characteristic; AUC, area under the curve.
Figure 7.
Figure 7.
GSEA showing six hallmark pathways (apical junction, UV response DN, p53 pathway, Kras signaling DN, estrogen response early, and epithelial–mesenchymal transition) that were enriched in the high score ARG signature group. GSEA, gene set enrichment analysis; ARG, autophagy-related gene.

Similar articles

Cited by

References

    1. McGuire S. World Cancer Report 2014. Geneva, Switzerland: World Health Organization, International Agency for Research on Cancer, WHO Press, 2015. Adv Nutr 2016; 7: 418–419. - PMC - PubMed
    1. Coleman MP, Quaresma M, Berrino F, et al. Cancer survival in five continents: a worldwide population-based study (CONCORD). Lancet Oncol 2008; 9: 730–756. - PubMed
    1. Renehan AG, Malcomson L, Emsley R, et al. Watch-and-wait approach versus surgical resection after chemoradiotherapy for patients with rectal cancer (the OnCoRe project): a propensity-score matched cohort analysis. Lancet Oncol 2016; 17: 174–183. - PubMed
    1. Tie J, Cohen JD, Wang Y, et al. Circulating tumor DNA analyses as markers of recurrence risk and benefit of adjuvant therapy for stage III colon cancer. JAMA Oncol 2019; 5: 1710–1717. - PMC - PubMed
    1. Tie J, Semira C, Gibbs P. Circulating tumor DNA as a biomarker to guide therapy in post-operative locally advanced rectal cancer: the best option? Expert Rev Mol Diagn 2018; 18: 1–3. - PubMed