. 2020 Oct 19;13(1):142.
doi: 10.1186/s13041-020-00681-7.

Brain transcriptome analysis reveals subtle effects on mitochondrial function and iron homeostasis of mutations in the SORL1 gene implicated in early onset familial Alzheimer's disease

Affiliations

Brain transcriptome analysis reveals subtle effects on mitochondrial function and iron homeostasis of mutations in the SORL1 gene implicated in early onset familial Alzheimer's disease

Karissa Barthelson et al. Mol Brain. .

Abstract

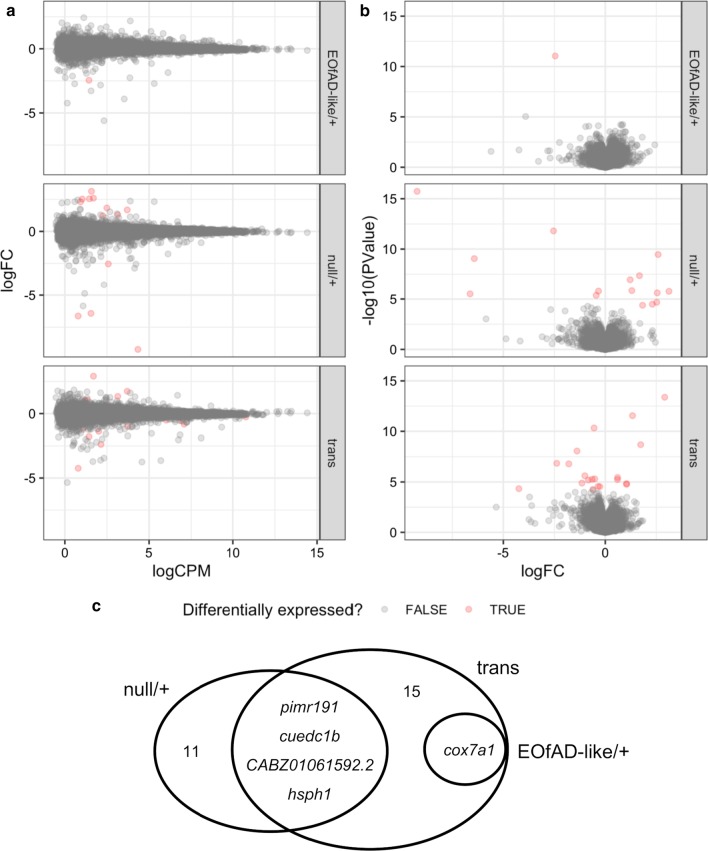
To prevent or delay the onset of Alzheimer's disease (AD), we must understand its molecular basis. The great majority of AD cases arise sporadically with a late onset after 65 years of age (LOAD). However, rare familial cases of AD can occur due to dominant mutations in a small number of genes that cause an early onset prior to 65 years of age (EOfAD). As EOfAD and LOAD share similar pathologies and disease progression, analysis of EOfAD genetic models may give insight into both subtypes of AD. Sortilin-related receptor 1 (SORL1) is genetically associated with both EOfAD and LOAD and provides a unique opportunity to investigate the relationships between both forms of AD. Currently, the role of SORL1 mutations in AD pathogenesis is unclear. To understand the molecular consequences of SORL1 mutation, we performed targeted mutagenesis of the orthologous gene in zebrafish. We generated an EOfAD-like mutation, V1482Afs, and a putatively null mutation, to investigate whether EOfAD-like mutations in sorl1 display haploinsufficiency by acting through loss-of-function mechanisms. We performed mRNA-sequencing on whole brains, comparing wild type fish with their siblings heterozygous for EOfAD-like or putatively loss-of-function mutations in sorl1, or transheterozygous for these mutations. Differential gene expression analysis identified a small number of differentially expressed genes due to the sorl1 genotypes. We also performed enrichment analysis on all detectable genes to obtain a more complete view on changes to gene expression by performing three methods of gene set enrichment analysis, then calculated an overall significance value using the harmonic mean p-value. This identified subtle effects on expression of genes involved in energy production, mRNA translation and mTORC1 signalling in both the EOfAD-like and null mutant brains, implying that these effects are due to sorl1 haploinsufficiency. Surprisingly, we also observed changes to expression of genes occurring only in the EOfAD-mutation carrier brains, suggesting gain-of-function effects. Transheterozygosity for the EOfAD-like and null mutations (i.e. lacking wild type sorl1), caused apparent effects on iron homeostasis and other transcriptome changes distinct from the single-mutation heterozygous fish. Our results provide insight into the possible early brain molecular effects of an EOfAD mutation in human SORL1. Differential effects of heterozygosity and complete loss of normal SORL1 expression are revealed.

Keywords: Familial Alzheimer’s disease; Harmonic mean p-value; Iron homeostasis; Mitochondria; RNA-seq; SORL1; Zebrafish.


Conflict of interest statement

The authors have no financial or non-financial competing interests to declare.

Figures

Fig. 1
Fig. 1
Breeding strategy. We mated a pair of fish with sorl1 genotypes null/+ and EOfAD-like/+ to generate families of fish composed of sorl1 genotypes EOfAD-like/+, null/+, EOfAD-like/null (transheterozygous) or wild type (+/+). The values of n are representative of the numbers of fish used in the RNA sequencing experiment
Fig. 2
Fig. 2
Mutations generated in zebrafish sorl1. a Zebrafish (Dr) sorl1 wild type (WT) and null (R122Pfs) exon 2 sequences with the chromatogram showing the Sanger sequencing of the null allele. Both the DNA and amino acid sequences are shown. b Alignment of the WT and EOfAD-like (V1482Afs) zebrafish sorl1 exon 32 sequences, with the chromatogram showing Sanger sequencing of the EOfAD-like allele of sorl1. The human (Hs) SORL1 exon 32 region is also shown with the C1478* mutation site and the equivalent C1481 zebrafish codon highlighted in red. c A schematic of the zebrafish Sorl1 protein with the protein domains and mutation sites indicated. VPS10 vacuolar protein sorting 10 domain. LDLR low density lipoprotein receptor, EGF epidermal growth factor, FN fibronectin, TMD transmembrane domain, ICD intracellular domain, Hs Homo sapiens, Dr Danio rerio
Fig. 3
Fig. 3
Allele-specific expression of sorl1 transcripts. a The number of copies of sorl1 transcripts present in +/+ (n = 3) and EOfAD/+ mutant (n = 3) brains per 50 ng of brain-derived cDNA. Data is presented as the mean ± SEM. In the +/+ brains, there were approximately 1400 copies of the wild type (WT) sorl1 transcript and no copies of the EOfAD-like (V1482Afs) allele transcript. In the EOfAD-like/+ brains, there were approximately 440 copies of the WT sorl1 transcript, and approximately 80 copies of the EOfAD-like allele transcript. P-values were determined by a one-way ANOVA with Dunnett’s T3 post-hoc test. b A schematic of sorl1 mRNA from exons 1–3. Primer binding sites are indicated by orange arrows, and the mutation site by the red star. Below is an image captured after agarose gel electrophoresis of the RT-PCR products. Lanes 1–3 are amplifications from three +/+ brains, while lanes 4–6 are amplifications from three null/+ brains. All fish were siblings
Fig. 4
Fig. 4
Differential gene expression analysis. a Mean-difference (MD) plots for each comparison between the three sorl1 mutant samples and the wild type samples. b Volcano plots for each comparison between the three sorl1 mutant samples and the wild type samples. c Venn diagram displaying the overlap of differentially expressed genes in each comparison. trans transheterozygous
Fig. 5
Fig. 5
Gene set enrichment analysis. Figure 5 depicts the significantly altered KEGG and HALLMARK gene sets in the null/+, EOfAD-like/+ and transheterozygous mutant brains relative their wild type siblings. The sizes of the dots indicate the negative log10 of the harmonic mean p-value (i.e. larger dots indicate greater statistical significance) of three methods of enrichment analysis (fry, camera and fgsea) when combined within each comparison. Gene sets are grouped as to the comparisons in which they are significant. Numbers associated with each dot are FDR adjusted harmonic mean p-values.
Fig. 6
Fig. 6
Heterozygosity for an EOfAD-like mutation in sorl1 often results in changes to gene expression in the opposite direction to more complete loss of wild type sorl1 function. ap LogFC of the genes making up the gene sets in each comparison of sorl1 mutants. Only the gene sets found to be significantly enriched in EOfAD-like/+ brains are shown. The colour legend indicates the magnitude of the logFC in the heatmaps (red is upregulation, blue is downregulation). Remarkable contrast is seen in the directional changes in gene expression between the heterozygous mutants and the transheterozygous mutants for KEGG_PROTEASOME and KEGG/HALLMARK_OXIDATIVE_PHOSPHORYLATION and gene sets in which oxidative phosphorylation genes are an important components (KEGG_HUNTINGTONS_DISEASE and KEGG_ALZHEIMERS_DISEASE, see Additional file 7)
Fig. 7
Fig. 7
Loss of wild type sorl1 results in dysregulation of genes with an iron responsive element in their transcript’s 3′ untranslated region, and of genes involved in the cellular response to hypoxia. The harmonic mean p-values for the enrichment analyses of gene sets with a, iron responsive elements (IRE) in their untranslated regions, and b, regulated by the HIF1 transcription factor, are shown with the significant gene sets in blue. The logFCs of genes in brains of each genotype with c, a canonical IRE in their transcript’s 3′ untranslated region and d, shown to be downregulated by loss of HIF1 activity. The genes and comparisons are clustered based on their Euclidian distance

References

    1. Iturria-Medina Y, Sotero R, Toussaint P, Mateos-Pérez J, Evans A, Initiative AsDN Early role of vascular dysregulation on late-onset Alzheimer's disease based on multifactorial data-driven analysis. Nat Commun. 2016;7:1–14. doi: 10.1038/ncomms11934. - DOI - PMC - PubMed
    1. Buee L, Hof PR, Bouras C, Delacourte A, Perl DP, Morrison JH, et al. Pathological alterations of the cerebral microvasculature in Alzheimer's disease and related dementing disorders. Acta Neuropathol. 1994;87(5):469–480. doi: 10.1007/BF00294173. - DOI - PubMed
    1. Hirai K, Aliev G, Nunomura A, Fujioka H, Russell RL, Atwood CS, et al. Mitochondrial abnormalities in Alzheimer's disease. J Neurosci. 2001;21(9):3017–3023. doi: 10.1523/JNEUROSCI.21-09-03017.2001. - DOI - PMC - PubMed
    1. Swerdlow RH, Khan SM. A “mitochondrial cascade hypothesis” for sporadic Alzheimer's disease. Med Hypotheses. 2004;63(1):8–20. doi: 10.1016/j.mehy.2003.12.045. - DOI - PubMed
    1. Flannery PJ, Trushina E. Mitochondrial dysfunction in Alzheimer’s disease and progress in mitochondria-targeted therapeutics. Curr Behav Neurosci Rep. 2019;6(3):88–102. doi: 10.1007/s40473-019-00179-0. - DOI

Publication types

MeSH terms