. 2020 Oct 19;11(1):80.
doi: 10.1186/s13229-020-00391-w.

Pharmacological intervention to restore connectivity deficits of neuronal networks derived from ASD patient iPSC with a TSC2 mutation

Affiliations

Pharmacological intervention to restore connectivity deficits of neuronal networks derived from ASD patient iPSC with a TSC2 mutation

Mouhamed Alsaqati et al. Mol Autism. .

Abstract

Background: Tuberous sclerosis complex (TSC) is a rare genetic multisystemic disorder resulting from autosomal dominant mutations in the TSC1 or TSC2 genes. It is characterised by hyperactivation of the mechanistic target of rapamycin complex 1 (mTORC1) pathway and has severe neurodevelopmental and neurological components including autism, intellectual disability and epilepsy. In human and rodent models, loss of the TSC proteins causes neuronal hyperexcitability and synaptic dysfunction, although the consequences of these changes for the developing central nervous system are currently unclear.

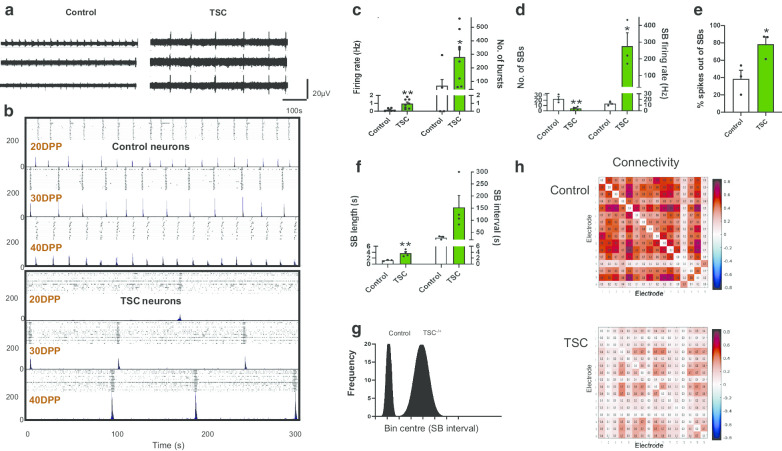
Methods: Here we apply multi-electrode array-based assays to study the effects of TSC2 loss on neuronal network activity using autism spectrum disorder (ASD) patient-derived iPSCs. We examine both temporal synchronisation of neuronal bursting and spatial connectivity between electrodes across the network.

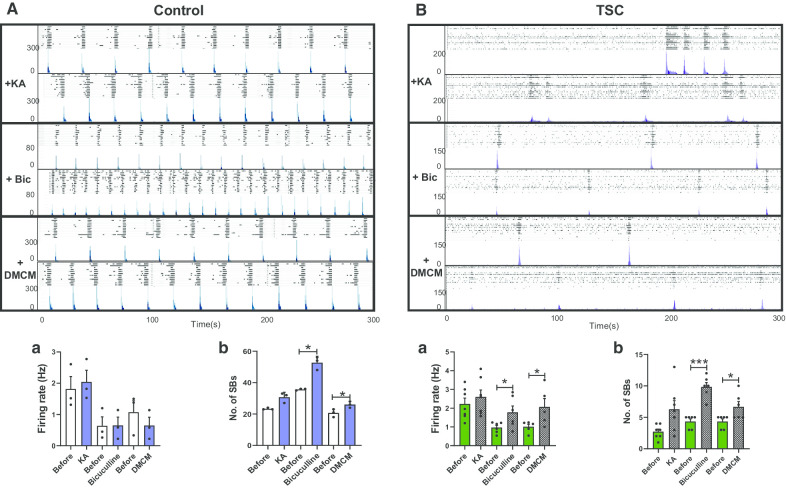
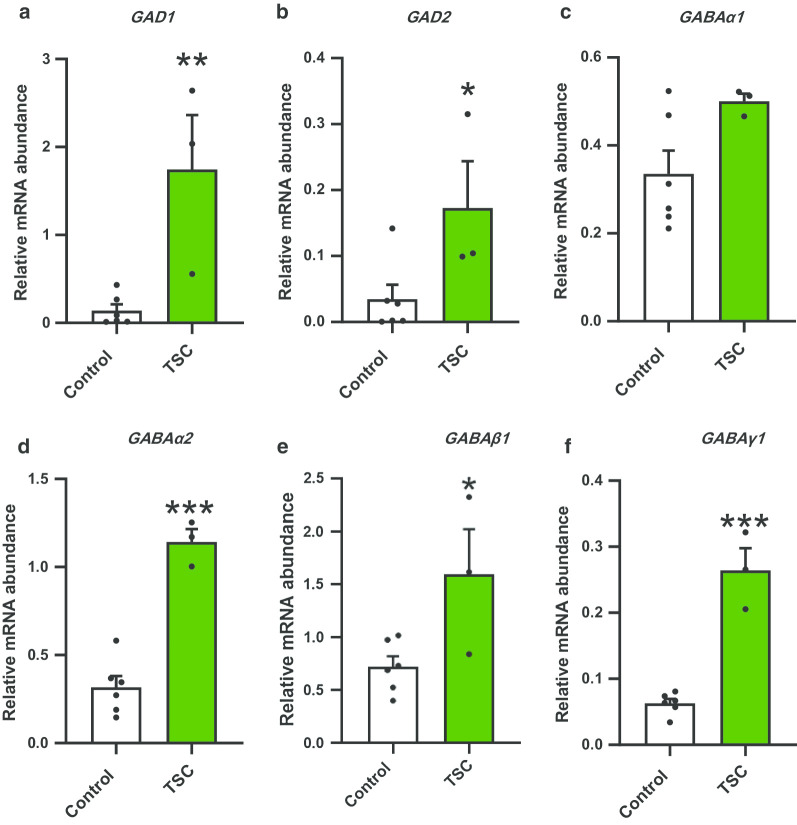
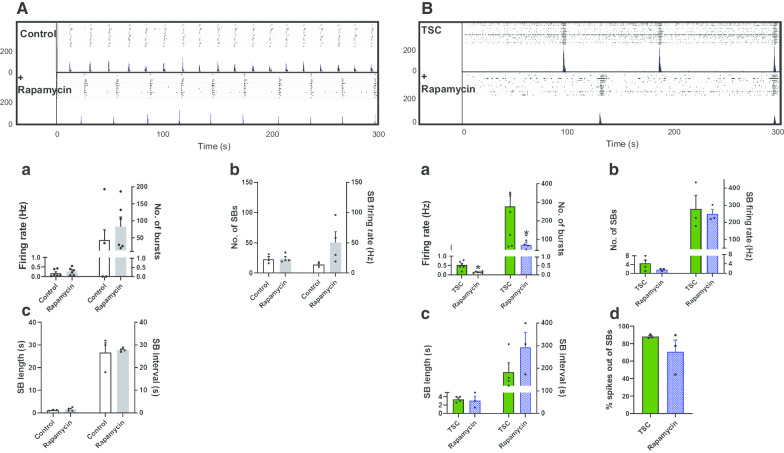
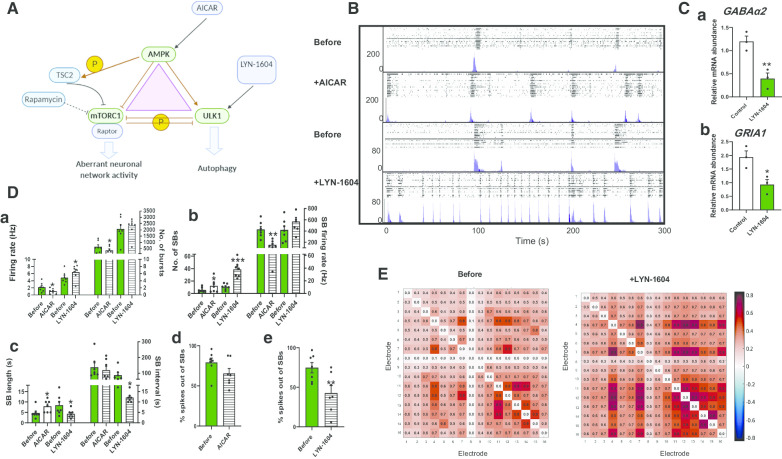
Results: We find that ASD patient-derived neurons with a functional loss of TSC2, in addition to possessing neuronal hyperactivity, develop a dysfunctional neuronal network with reduced synchronisation of neuronal bursting and lower spatial connectivity. These deficits of network function are associated with elevated expression of genes for inhibitory GABA signalling and glutamate signalling, indicating a potential abnormality of synaptic inhibitory-excitatory signalling. mTORC1 activity functions within a homeostatic triad of protein kinases, mTOR, AMP-dependent protein Kinase 1 (AMPK) and Unc-51 like Autophagy Activating Kinase 1 (ULK1) that orchestrate the interplay of anabolic cell growth and catabolic autophagy while balancing energy and nutrient homeostasis. The mTOR inhibitor rapamycin suppresses neuronal hyperactivity, but does not increase synchronised network activity, whereas activation of AMPK restores some aspects of network activity. In contrast, the ULK1 activator, LYN-1604, increases the network behaviour, shortens the network burst lengths and reduces the number of uncorrelated spikes.

Limitations: Although a robust and consistent phenotype is observed across multiple independent iPSC cultures, the results are based on one patient. There may be more subtle differences between patients with different TSC2 mutations or differences of polygenic background within their genomes. This may affect the severity of the network deficit or the pharmacological response between TSC2 patients.

Conclusions: Our observations suggest that there is a reduction in the network connectivity of the in vitro neuronal network associated with ASD patients with TSC2 mutation, which may arise via an excitatory/inhibitory imbalance due to increased GABA-signalling at inhibitory synapses. This abnormality can be effectively suppressed via activation of ULK1.


Conflict of interest statement

The authors declare no competing interests.

Figures

Fig. 1
Fig. 1
Changes in neuronal activity of patient and control neurons recorded with multi-electrode arrays (MEAs). a Representative voltage traces from three electrodes of the same MEA culture for control and TSC2 neurons at 40DPP (DPP = days post plating). Traces from TSC2 neurons show high levels of activity compared to control neurons, as expected from previous observations [17]. b Development of synchronised bursting across the array at 20, 30 and 40DPP for control (top) and TSC2 neurons (bottom). For each time point, upper panel shows a raster plot and lower panel shows an array-wide synchronised detection rate (ASDR) plot. Vertical-scale bars = 200 spikes per 200 ms bin, following 5 min of recording. c Basal excitability of control and TSC2 neurons showing average spike firing rate and number of single unit bursts detected. Changes in d synchronised burst (SB) activity and the number of spikes in individual SBs, e the spikes outside of SBs and f SB length and interval in control and TSC2 models. g Frequency distribution analysis represents the variation in the SB intervals of control neurons TSC2 neurons. h Connectivity correlation matrices heat map for the control and TSC2 neurons on the MEAs, and colours represent the correlation in the firing rates across the indicated electrode. Correlation matrices are calculated for 16 electrodes in control and TSC2 neurons plated on the MEAs. Values greater than zero represent positive correlation, while values below zero represent negative correlation. All plots show means ± SEM. *p < 0.05, **p < 0.01 following unpaired t-tests. Number of recorded wells = 6 for the control and 8 for TSC2 culture
Fig. 2
Fig. 2
Pharmacological profiling of the network activity of TSC2 neurons. Typical synchronised burst patterns shown by raster plot (upper panel) and ASDR plots (lower patterns) for Control (A) and TSC2 (B) neurons, treated with 1 μM kainic acid (KA), 10 μM bicuculline (Bic) or 1 μM methyl-6,7-dimethoxy-4-ethyl-beta-carboline-3-carboxylate (DMCM). Plots (underneath) show mean ± SEM of a spike firing rate (Hz) and b number of synchronised bursts (SB) for all drugs. *p < 0.05, ***p < 0.001 following paired t-tests. Number of recorded wells = 3–10
Fig. 3
Fig. 3
Expression analysis of genes encoding GABA signalling components. Analysis of a panel of inhibitory GABA signalling genes (af: GAD1, GAD2, GABAa1, GABAa2, GABAb1, GABAg1) in control and TSC2 neurons at 60DPP. Data are represented as means ± SEM. *p < 0.05, **p < 0.01, ***p < 0.001 following unpaired t-tests, N = 6 for control and 3 for TSC neurons. Also see Table 1
Fig. 4
Fig. 4
Effects of chronic treatment with rapamycin on TSC2 neuronal activity. Raster (upper panels) and ASDR plots (lower panels) of a single neuronal MEA culture at 60 DPP in the absence (A) and presence of rapamycin (10 nM) (B). Vertical-scale bar = 200 spikes per 200 ms bin. Underneath show changes in a basal excitability, b synchronised burst (SB) activity and the number of spikes in individual SB, c SB length and interval and d spikes firing outside of a SB. All plots show means ± SEM. *p < 0.05 following unpaired t tests. Number of recorded wells = 6
Fig. 5
Fig. 5
Effects of AICAR and LYN-1604 on TSC2 neuronal activity. A Schematic to show the relationship of TORC1 to AMPK and ULK1. B Raster (upper panel) and ASDR (lower panel) plots of recordings of the same MEA showing 24-h exposure to AICAR (1 mM) and LYN-1604 (2 μM). C Gene expression analysis of the genes encoding GABAa2 (a) and GRIA1 (b) in control cells following 24-h exposure to LYN-1604 (2 μM). D Network activity following 24-h drug treatment of TSC2 neurons in the absence and presence of AICAR and LYN-1604 in the absence and presence of AICAR and LYN-1604 showing a basal excitability, b synchronised burst (SB) activity and the number of spikes in individual SBs, c SB length and interval and d, e the spikes out of SBs, presented as percentage of the response before the drugs treatment. E Correlation matrices heat map for TSC2 neurons in the absence and presence of LYN-1604, colours represent the correlation in the firing rates across the indicated electrode. Correlation matrices are calculated for 16 electrodes in control and TSC2 neurons plated on the MEAs. Values greater than zero represent positive correlation, while values below zero represent negative correlation. All plots show means ± SEM. *p < 0.05, **p < 0.01 following paired t-tests. Number of recorded wells = 7

References

    1. Leung AK, Robson WL. Tuberous sclerosis complex: a review. J Pediatr Health Care. 2007;212:108–114. doi: 10.1016/j.pedhc.2006.05.004. - DOI - PubMed
    1. Huang J, Manning BD. The TSC1-TSC2 complex: a molecular switchboard controlling cell growth. Biochem J. 2008;4122:179–190. doi: 10.1042/BJ20080281. - DOI - PMC - PubMed
    1. Huang J, Wu S, Wu C-L, Manning BD. Signaling events downstream of mammalian target of rapamycin complex 2 are attenuated in cells and tumors deficient for the tuberous sclerosis complex tumor suppressors. Can Res. 2009;6915:6107–6114. doi: 10.1158/0008-5472.CAN-09-0975. - DOI - PMC - PubMed
    1. Sarbassov DD, Ali SM, Sabatini DM. Growing roles for the mTOR pathway. Curr Opin Cell Biol. 2005;176:596–603. doi: 10.1016/j.ceb.2005.09.009. - DOI - PubMed
    1. Huang J, Manning BD. The TSC1–TSC2 complex: a molecular switchboard controlling cell growth. Biochem J. 2008;4122:179–190. doi: 10.1042/BJ20080281. - DOI - PMC - PubMed

Publication types

MeSH terms