. 2020 Dec 25;295(52):18036-18050.
doi: 10.1074/jbc.RA120.014745. Epub 2020 Oct 19.

Quantitative phosphoproteomic analysis reveals involvement of PD-1 in multiple T cell functions

Affiliations

Quantitative phosphoproteomic analysis reveals involvement of PD-1 in multiple T cell functions

Anna S Tocheva et al. J Biol Chem. .

Abstract

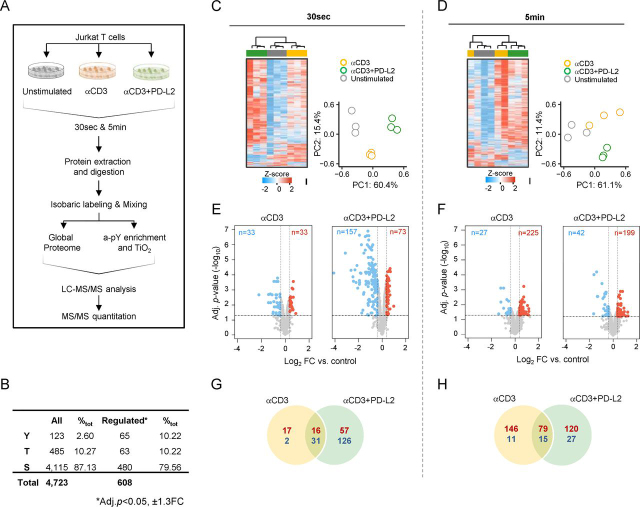
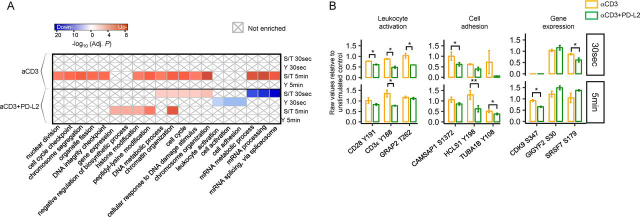
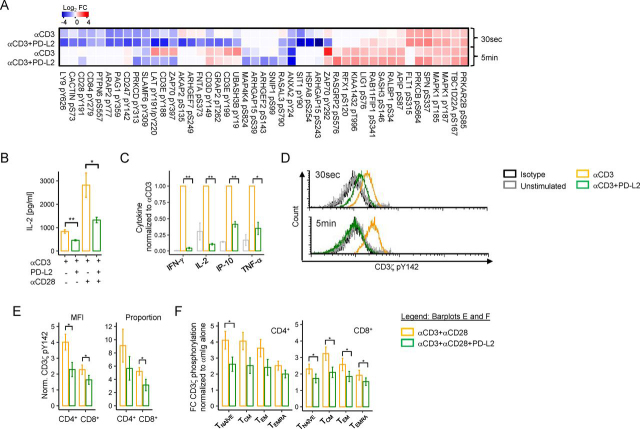
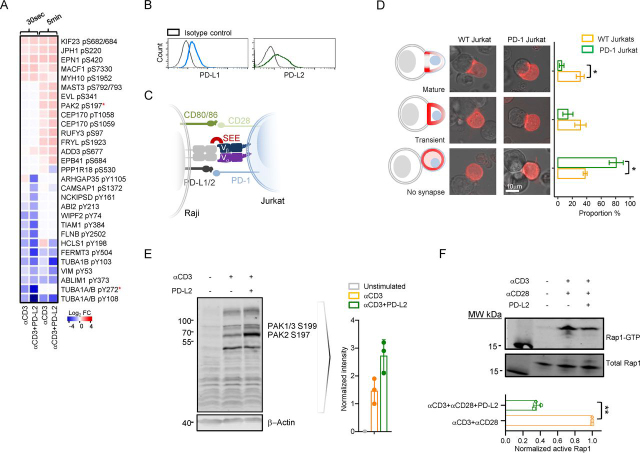
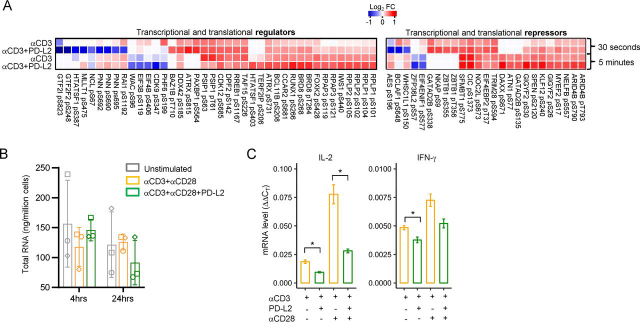
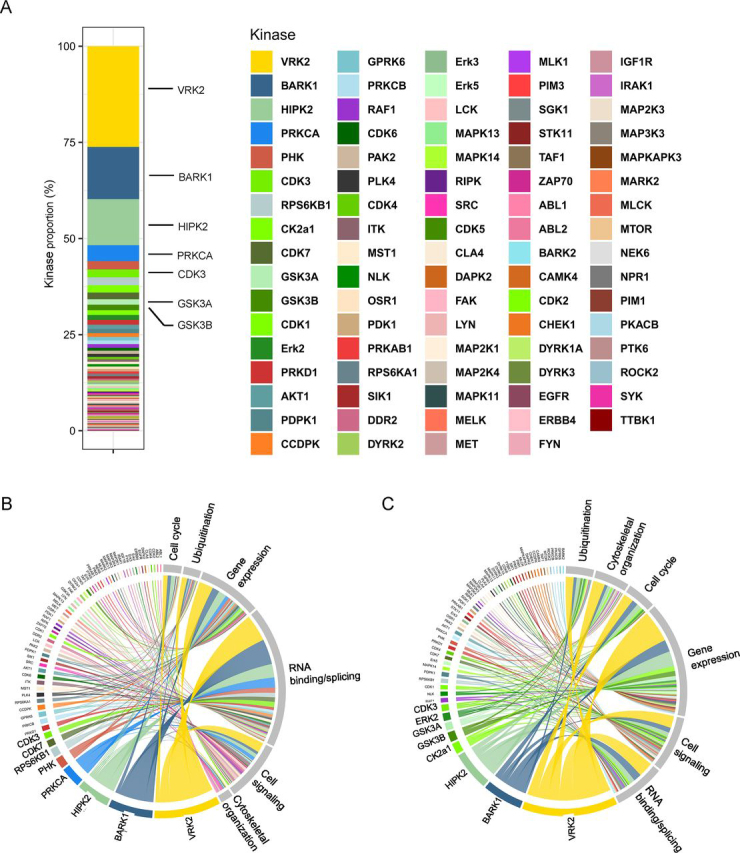
Programmed cell death protein 1 (PD-1) is a critical inhibitory receptor that limits excessive T cell responses. Cancer cells have evolved to evade these immunoregulatory mechanisms by upregulating PD-1 ligands and preventing T cell-mediated anti-tumor responses. Consequently, therapeutic blockade of PD-1 enhances T cell-mediated anti-tumor immunity, but many patients do not respond and a significant proportion develop inflammatory toxicities. To improve anti-cancer therapy, it is critical to reveal the mechanisms by which PD-1 regulates T cell responses. We performed global quantitative phosphoproteomic interrogation of PD-1 signaling in T cells. By complementing our analysis with functional validation assays, we show that PD-1 targets tyrosine phosphosites that mediate proximal T cell receptor signaling, cytoskeletal organization, and immune synapse formation. PD-1 ligation also led to differential phosphorylation of serine and threonine sites within proteins regulating T cell activation, gene expression, and protein translation. In silico predictions revealed that kinase/substrate relationships engaged downstream of PD-1 ligation. These insights uncover the phosphoproteomic landscape of PD-1-triggered pathways and reveal novel PD-1 substrates that modulate diverse T cell functions and may serve as future therapeutic targets. These data are a useful resource in the design of future PD-1-targeting therapeutic approaches.

Keywords: T cell; T cell receptor (TCR); cell signaling; immunology; immunotherapy; inhibition mechanism; kinase-substrate relationships; mass spectrometry; phosphoproteomics; programmed cell death ligand 2 (PD-L2); programmed cell death protein 1 (PD-1); signaling networks.


Conflict of interest statement

Conflict of interest—A. M. received research support from NTB Pharma. The authors declare that they have no conflicts of interest with the contents of this article.

Figures

Figure 1
Figure 1
Experimental design and global overview of the PD-1–regulated phosphoproteome.A, experimental workflow. B, quantified total and differentially phosphorylated phosphosites. C and D, cluster analysis and principal component plots of normalized intensities for all phosphopeptides at 30 s (C) and 5 min (D) post-stimulation. E and F, volcano plots of differentially increased (red) or decreased (blue) phosphosites relative to the unstimulated control in response to αCD3 or αCD3+PD-L2 stimulation at 30 s (E) and 5 min (F). Horizontal dotted lines correspond to –Log10 adjusted p-value ≤ 0.05, and vertical lines correspond to FC ≥ ±1.3. G and H, number of shared and treatment-specific increased (red) or decreased (blue) phosphosites at 30 s (G) and 5 min (H).
Figure 2
Figure 2
PD-1–signaling engages specific and novel biological processes.A, functional enrichment heatmap of treatment-specific, differentially phosphorylated sites. The color intensity corresponds to the –Log10 BH adj. p-value for pathways annotated from proteins with increased (red) or decreased (blue) phosphosites. The × symbol designated pathways that were not enriched. B, boxplots of representative differentially phosphorylated phosphosites from the three experimental replicates within each functional category showing raw data relative to the unstimulated control. Bar plots show means ± S.D.
Figure 3
Figure 3
PD-1 attenuates proximal TCR signaling.A, heatmap of TCR signaling phosphosites targeted by PD-1 showing Log2FC values relative to the unstimulated control. B, overnight IL-2 secretion assay from Jurkat cells in response to plate-bound αCD3 or plate-bound αCD3 with PD-L2-Fc in the presence or absence of soluble αCD28. C, cytokine production from primary human T cells following 48-h stimulation with αCD3 or αCD3+PD-L2 beads from three independent experiments performed in duplicate from two donors. D, representative experiment of CD3ζ pTyr-142 phosphorylation of PD-1–transduced Jurkat cells stimulated with beads conjugated to αCD3 or αCD3+PD-L2. E, CD3ζ pTyr-142 phosphorylation following ligand crosslinking in primary human CD4+ and CD8+ T cells and in different T cell subsets (F) from five independent experiments in three different donors. Data in bar graphs represent mean values ± S.E. (error bars). Statistical analyses were performed using paired Student's t test, where *p ≤ 0.05 and **p ≤ 0.01.
Figure 4
Figure 4
PD-1 interferes with immune synapse maturation and T cell adhesion.A, heatmap of phosphosites within proteins important for cytoskeletal organization targeted by PD-1 showing Log2FC values relative to the unstimulated control. B, histogram plots showing surface expression levels of PD-1 ligands in Raji B cells and (C) diagram of Raji-Jurkat conjugate assay. D, microscopic evaluation of IS formation following SEE-coated Raji cell co-incubation with either WT Jurkat cells, which express low levels of surface PD-1, or PD-1–transduced Jurkat clone. Schematic representation of conjugate formation (D, left), confocal images of Raji-Jurkat conjugates in parental Jurkat cells, and PD-1–transduced Jurkat clone (D, center), transfected with LifeAct, and bar graph of mean ± S.E. (error bars) of the quantitated proportion of conjugate formation in each group (D, right) from three independent experiments. E, Western blotting analysis and quantitation of PAK2 Ser-197 phosphorylation from n = 3 independent experiments in Jurkat T cells after 5-min stimulation with Dynabeads coated with either αCD3 alone or αCD3+PD-L2. F, a representative blot of active GTP-bound Rap1 pulldown assay following 5-min crosslinking stimulation in WT Jurkat T cells from three independent experiments (bar graph shows mean ± S.D. (error bars)). Statistical analysis was performed using unpaired (D) or paired (F) Student's t test, where *p ≤ 0.05 and **p ≤ 0.01.
Figure 5
Figure 5
PD-1 ligation changes the Ser/Thr phosphorylation landscape of both transcriptional and translational regulators and repressors.A, heatmaps of Log2FC of normalized phosphosite intensities relative to the unstimulated control for transcriptional and translational regulators and repressors. B, total RNA production from live Jurkat cells stimulated at the indicated time points with either plate-bound αCD3 or αCD3+PD-L2-Fc in presence of soluble αCD28. The bar graphs show mean ± S.D. (error bars) of n = 3 independent experiments. C, RT-qPCR analysis of IL-2 and IFN-γ expression from Jurkat cells following 24-h plate-bound stimulation as in (B) in the presence or absence of soluble αCD28 and *p ≤ 0.05.
Figure 6
Figure 6
In silico prediction analysis of kinase/substrate interactions downstream of PD-1.A, proportion of phosphosites targeted by each kinase. Chord diagrams showing the distribution of kinases predicted to phosphorylate sites with decreased (B) and increased (C) phosphorylation following PD-1 ligation according to the functional group of each protein containing that phosphosite.

References

    1. Fuertes Marraco S.A., Neubert N.J., Verdeil G., Speiser D.E. Inhibitory receptors beyond T cell exhaustion. Front. Immun. 2015;6:310. doi: 10.3389/fimmu.2015.00310. 26167163. - DOI - PMC - PubMed
    1. Pardoll D.M. The blockade of immune checkpoints in cancer immunotherapy. Nature Rev. Cancer. 2012;12:252–264. doi: 10.1038/nrc3239. 22437870. - DOI - PMC - PubMed
    1. Sanmamed M.F., Chen L. A paradigm shift in cancer immunotherapy: from enhancement to normalization. Cell. 2018;175:313–326. doi: 10.1016/j.cell.2018.09.035. 30290139. - DOI - PMC - PubMed
    1. Baumeister S.H., Freeman G.J., Dranoff G., Sharpe A.H. Coinhibitory pathways in immunotherapy for cancer. Annu. Rev. Immunol. 2016;34:539–573. doi: 10.1146/annurev-immunol-032414-112049. 26927206. - DOI - PubMed
    1. Boussiotis V.A. Molecular and biochemical aspects of the PD-1 checkpoint pathway. N. Engl. J. Med. 2016;375:1767–1778. doi: 10.1056/NEJMra1514296. 27806234. - DOI - PMC - PubMed

Publication types