

Prenatal and early-life exposure to the Great Chinese Famine increased the risk of tuberculosis in adulthood across two generations
- PMID: 33077583
- PMCID: PMC7959515
- DOI: 10.1073/pnas.2008336117
Prenatal and early-life exposure to the Great Chinese Famine increased the risk of tuberculosis in adulthood across two generations
Abstract
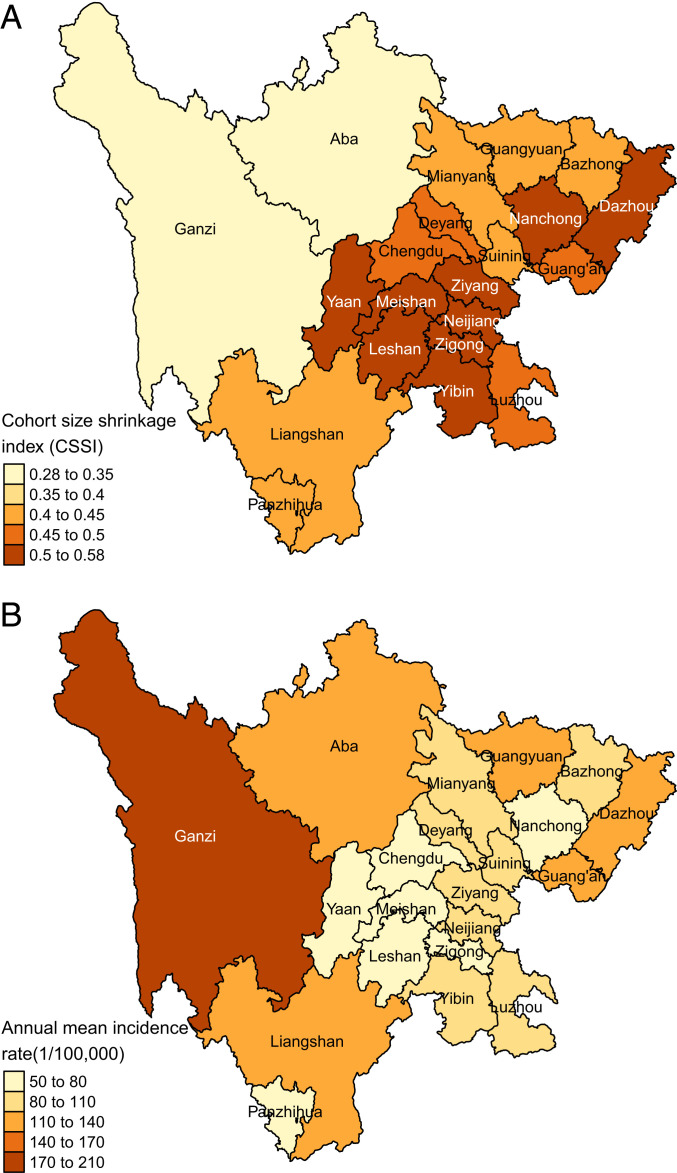
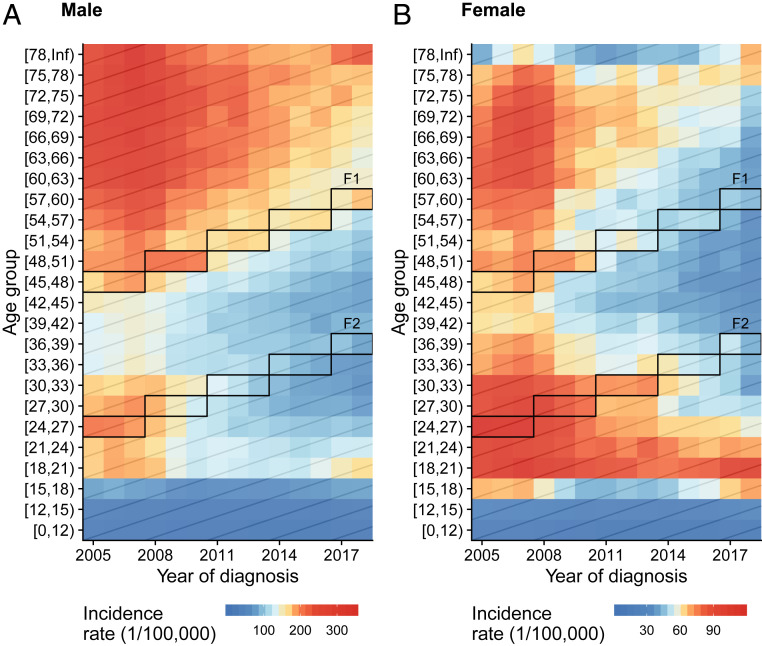
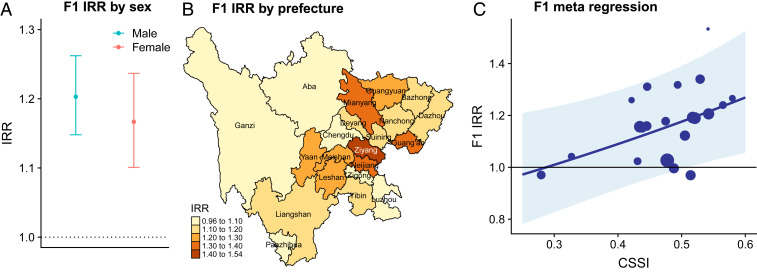
Global food security is a major driver of population health, and food system collapse may have complex and long-lasting effects on health outcomes. We examined the effect of prenatal exposure to the Great Chinese Famine (1958-1962)-the largest famine in human history-on pulmonary tuberculosis (PTB) across consecutive generations in a major center of ongoing transmission in China. We analyzed >1 million PTB cases diagnosed between 2005 and 2018 in Sichuan Province using age-period-cohort analysis and mixed-effects metaregression to estimate the effect of the famine on PTB risk in the directly affected birth cohort (F1) and their likely offspring (F2). The analysis was repeated on certain sexually transmitted and blood-borne infections (STBBI) to explore potential mechanisms of the intergenerational effects. A substantial burden of active PTB in the exposed F1 cohort and their offspring was attributable to the Great Chinese Famine, with more than 12,000 famine-attributable active PTB cases (>1.23% of all cases reported between 2005 and 2018). An interquartile range increase in famine intensity resulted in a 6.53% (95% confidence interval [CI]: 1.19-12.14%) increase in the ratio of observed to expected incidence rate (incidence rate ratio, IRR) in the absence of famine in F1, and an 8.32% (95% CI: 0.59-16.6%) increase in F2 IRR. Increased risk of STBBI was also observed in F2. Prenatal and early-life exposure to malnutrition may increase the risk of active PTB in the exposed generation and their offspring, with the intergenerational effect potentially due to both within-household transmission and increases in host susceptibility.
Keywords: Great Chinese Famine; food systems; infectious disease; nutrition; tuberculosis.
Conflict of interest statement
The authors declare no competing interest.
Figures

Comment in
-
Early-life exposure to the Chinese famine and tuberculosis risk: Unrecognized biases from different measures of famine intensity.Proc Natl Acad Sci U S A. 2021 Apr 20;118(16):e2102809118. doi: 10.1073/pnas.2102809118. Proc Natl Acad Sci U S A. 2021. PMID: 33879574 Free PMC article. No abstract available.
-
Reply to Li et al.: Estimate of the association between TB risk and famine intensity is robust to various famine intensity estimators.Proc Natl Acad Sci U S A. 2021 Apr 20;118(16):e2103254118. doi: 10.1073/pnas.2103254118. Proc Natl Acad Sci U S A. 2021. PMID: 33879575 Free PMC article. No abstract available.
References
-
- Huang C., Li Z., Wang M., Martorell R., Early life exposure to the 1959-1961 Chinese famine has long-term health consequences. J. Nutr. 140, 1874–1878 (2010). - PubMed
-
- Lumey L. H., Khalangot M. D., Vaiserman A. M., Association between type 2 diabetes and prenatal exposure to the Ukraine famine of 1932-33: A retrospective cohort study. Lancet Diabetes Endocrinol. 3, 787–794 (2015). - PubMed
-
- Li C., Lumey L. H., Exposure to the Chinese famine of 1959-61 in early life and long-term health conditions: A systematic review and meta-analysis. Int. J. Epidemiol. 46, 1157–1170 (2017). - PubMed
-
- Bhutta Z. A., Early nutrition and adult outcomes: Pieces of the puzzle. Lancet 382, 486–487 (2013). - PubMed
Publication types
MeSH terms
Substances
Grants and funding
LinkOut - more resources
Full Text Sources
Miscellaneous
