. 2020 Nov 3;117(44):27374-27380.
doi: 10.1073/pnas.2000700117. Epub 2020 Oct 19.

Three-dimensional deconvolution processing for STEM cryotomography

Affiliations

Three-dimensional deconvolution processing for STEM cryotomography

Barnali Waugh et al. Proc Natl Acad Sci U S A. .

Abstract

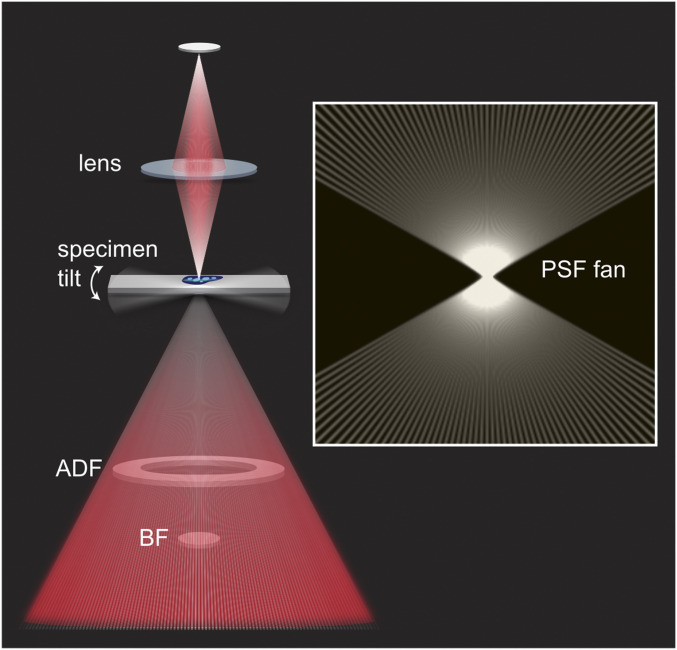
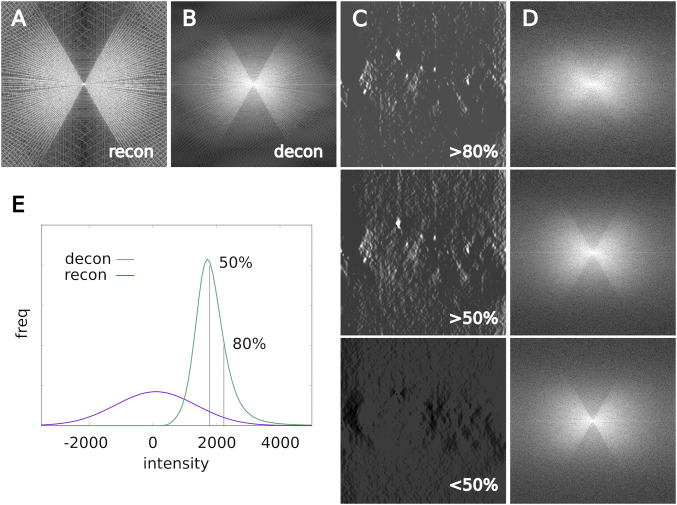
The complex environment of biological cells and tissues has motivated development of three-dimensional (3D) imaging in both light and electron microscopies. To this end, one of the primary tools in fluorescence microscopy is that of computational deconvolution. Wide-field fluorescence images are often corrupted by haze due to out-of-focus light, i.e., to cross-talk between different object planes as represented in the 3D image. Using prior understanding of the image formation mechanism, it is possible to suppress the cross-talk and reassign the unfocused light to its proper source post facto. Electron tomography based on tilted projections also exhibits a cross-talk between distant planes due to the discrete angular sampling and limited tilt range. By use of a suitably synthesized 3D point spread function, we show here that deconvolution leads to similar improvements in volume data reconstructed from cryoscanning transmission electron tomography (CSTET), namely a dramatic in-plane noise reduction and improved representation of features in the axial dimension. Contrast enhancement is demonstrated first with colloidal gold particles and then in representative cryotomograms of intact cells. Deconvolution of CSTET data collected from the periphery of an intact nucleus revealed partially condensed, extended structures in interphase chromatin.

Keywords: chromatin; cryoelectron microscopy; tomography.


Conflict of interest statement

The authors declare no competing interest.

Figures

Fig. 1.
Fig. 1.
STEM configuration and synthesis of the 3D PSF. A STEM image is formed by scanning a focused electron beam (angles not to scale) across the specimen and collecting the scattered electrons on area detectors. These may include an on-axis bright-field (BF) disk and/or a dark-field annulus (ADF), each of which integrates the scattered flux over a certain angular range. For tomography, a series of projection images is recorded as the specimen is tilted. The boxed Inset shows the construction of the 3D point spread function from a sum of rays representing the illumination profile, tilted to the relevant acquisition angles.
Fig. 2.
Fig. 2.
Gold bead data—reconstruction and deconvolution. (A) Weighted back projection (WBP). Three orthogonal sections (XY, YZ, and XZ) pass through the volume of interest. Images on the Right are fast Fourier transforms (FFTs) (power spectra, shown in log scale to compress intensities) of the real-space planes shown on the Left. (B) As in A for Wiener filtered dataset. (C) As in A for iterative deconvolution (ID) using ImageJ. (D) As in A for iterative deconvolution using the ER-Decon II algorithm. Parameters for deconvolution were selected visually from a grid shown in SI Appendix, Fig. S1. (E) Orthoplane views of the WBP and ERD datasets show the suppression of spurious contrast into neighboring planes.
Fig. 3.
Fig. 3.
Deconvolution enhances interpretable contrast in whole-cell CSTET. (A) A single section from the deconvolved volume shows an overview of the cytoplasmic content under investigation. Rough endoplasmic reticulum (RER), polyribosomes (PR), two mitochodria (M1 and M2) with internal cristae (Cr), calcium phosphate matrix granules (MGs), and two putative autolysosomal (AL) compartments are annotated. (B) The 3D reconstructions of the AL are shown in orthoplane views after application of a low pass filter (Gaussian, radius = 1 pixel: LP1) and entropy-regularized deconvolution (ERD). The images are opening frames from an animation available in Movie S1. (C and D) Orthoplane views of the mitochondria with deconvolution and weighted back projection (filtered as above), respectively. The two panels show identical sections; C is annotated. Contrast is enhanced by deconvolution in the XY views, but the most dramatic improvement is seen in XZ and YZ sections. Thin black lines indicate the positions of the sections shown above. Note the cristae (white arrowheads) interdigitated between high contrast matrix granules in M2, the mitochondria boundaries (black arrowheads), the tubular extension emanating from M1 (small white circle), and a cut through the end of M2 where the double membrane can be discerned (large white circle). Similar features are visible in the back projection but are buried in noise of comparable intensity. Image intensities are scaled linearly based on the volume histogram with a small fraction (0.1 to 0.5%) of voxel values saturated.
Fig. 4.
Fig. 4.
Deconvolution parameters. XY and XZ sections are shown for the weighted back projection (unfiltered) and deconvolution with smoothing values as indicated. See SI Appendix, Fig. S3 for location of the chosen sections. Display scaling is linear in all cases with 0.1% of the histogram saturated at high and low values.
Fig. 5.
Fig. 5.
Amelioration of the missing wedge artifact. (A and B) Averaged 2D power spectra from XZ planes of the data cubes displayed in Fig. 4 for the unfiltered reconstruction and the deconvolution with smoothing = 0.1. (C) A central slice of the data thresholded for the lower 50%, upper 50%, and upper 80% of voxel intensities. (The extreme 0.1% were allowed to saturate as in Fig. 4). (D) Averaged 2D power spectra (logarithmic scaling; see SI Appendix, Fig. S4 for linear scale) for the corresponding thresholded volumes. (E) The volume histogram of the reconstruction reflects the normalization of the raw images prior to back projection; the histogram of the deconvolution is strongly distorted, with features of interest pushed to the bright tail of the distribution.
Fig. 6.
Fig. 6.
Distinct density inhomogeneities in interphase chromatin. The nuclear envelope in this fibroblast cell displays a bleb, or polyp, into which the chromatin spreads. The outer membrane of the protrusion separates into rough endoplasmic reticulum (ER). The inner nuclear membrane (INM) delimits the chromatin. Nuclear pore complexes (NPC) and perinuclear heterochromatin (HC) are visible near the nuclear envelope at the Upper Right. The polyp outer membrane makes a junction with a mitochondrion passing underneath the section displayed. See Movie S2 for a scan of the entire volume. (A) The raw reconstruction, low pass filtered. (B) Deconvolution improves contrast against the background. Within the bounds of the INM, higher density (brighter) regions appear in extended linear structures, both in the perinuclear heterochromatin and interior structures. The dense regions show a twisted shape (green arrows), whereas isolated strands appear in the sparser regions (orange arrowheads). (C) A highly smoothed version of the deconvolution follows the denser features. A 3D mask is created by applying an intensity threshold to the smoothed deconvolution, shown here as one section in pink. (D) Application of the mask to the data of B, limited additionally by the INM, segments the denser chromatin structures (shown in blue) in an unbiased manner. All images present a single section near the center of the reconstructed volume. The pink boundary is displaced by one section for clarity. The total reconstructed thickness near the polyp neck is 1 µm (Scale bar, 500 nm.)

References

    1. Villa E., Schaffer M., Plitzko J. M., Baumeister W., Opening windows into the cell: Focused-ion-beam milling for cryo-electron tomography. Curr. Opin. Struct. Biol. 23, 771–777 (2013). - PubMed
    1. Romero-Brey I., Bartenschlager R., Viral infection at high magnification: 3D electron microscopy methods to analyze the architecture of infected cells. Viruses 7, 6316–6345 (2015). - PMC - PubMed
    1. Elbaum M., Expanding horizons of cryo-tomography to larger volumes. Curr. Opin. Microbiol. 43, 155–161 (2018). - PubMed
    1. Frank J., Electron Tomography: Methods for Three-Dimensional Visualization of Structures in the Cell, (Springer Science & Business Media, 2008).
    1. Friedrich H., de Jongh P. E., Verkleij A. J., de Jong K. P., Electron tomography for heterogeneous catalysts and related nanostructured materials. Chem. Rev. 109, 1613–1629 (2009). - PubMed

Publication types