. 2020 Nov 3;117(44):27211-27217.
doi: 10.1073/pnas.2013181117. Epub 2020 Oct 19.

Changing nutrient cycling in Lake Baikal, the world's oldest lake

Affiliations

Changing nutrient cycling in Lake Baikal, the world's oldest lake

George E A Swann et al. Proc Natl Acad Sci U S A. .

Abstract

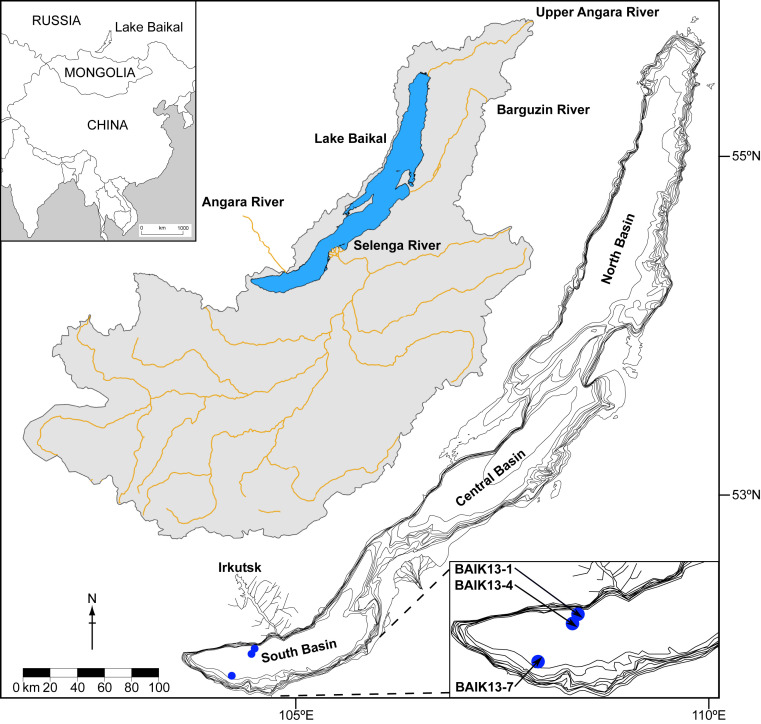
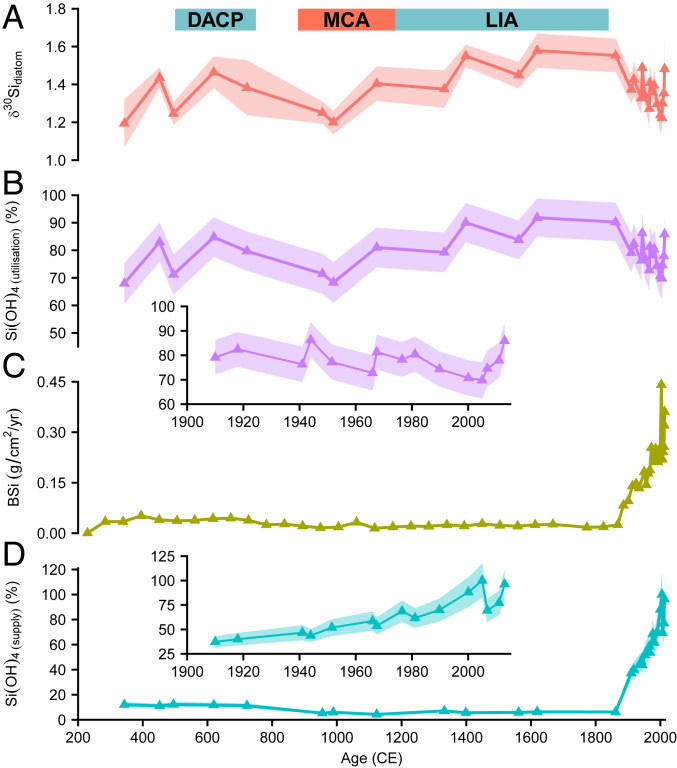
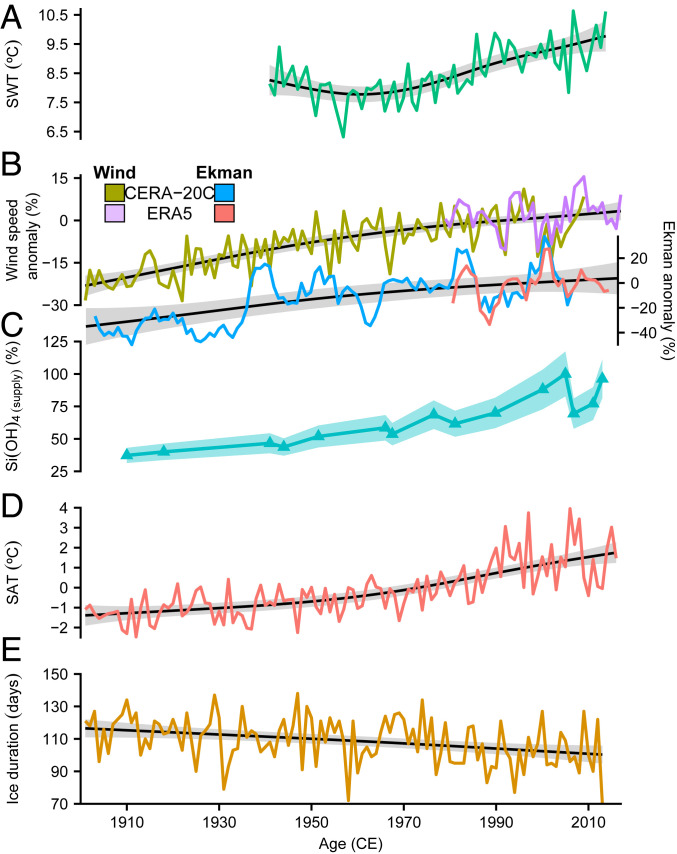
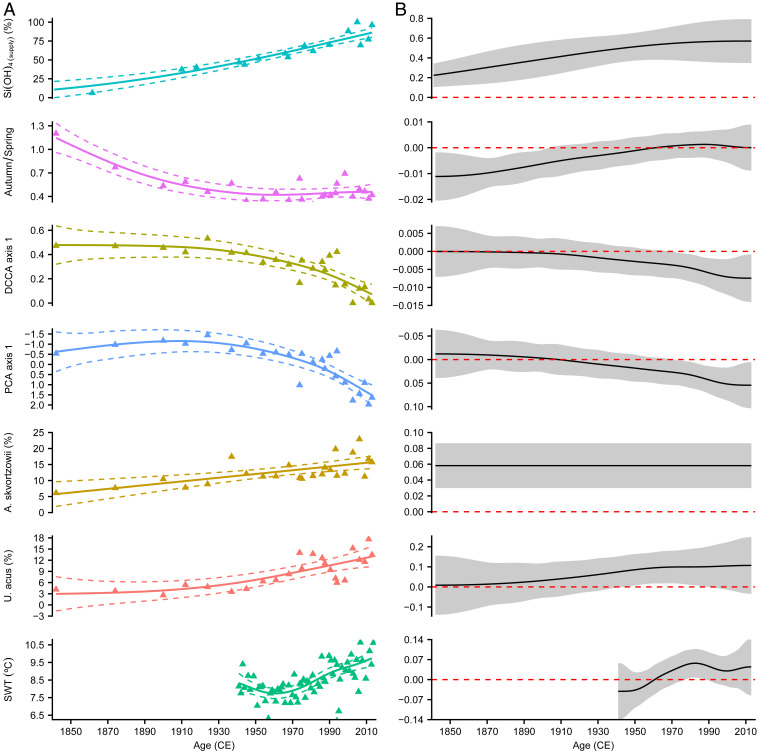
Lake Baikal, lying in a rift zone in southeastern Siberia, is the world's oldest, deepest, and most voluminous lake that began to form over 30 million years ago. Cited as the "most outstanding example of a freshwater ecosystem" and designated a World Heritage Site in 1996 due to its high level of endemicity, the lake and its ecosystem have become increasingly threatened by both climate change and anthropogenic disturbance. Here, we present a record of nutrient cycling in the lake, derived from the silicon isotope composition of diatoms, which dominate aquatic primary productivity. Using historical records from the region, we assess the extent to which natural and anthropogenic factors have altered biogeochemical cycling in the lake over the last 2,000 y. We show that rates of nutrient supply from deep waters to the photic zone have dramatically increased since the mid-19th century in response to changing wind dynamics, reduced ice cover, and their associated impact on limnological processes in the lake. With stressors linked to untreated sewage and catchment development also now impacting the near-shore region of Lake Baikal, the resilience of the lake's highly endemic ecosystem to ongoing and future disturbance is increasingly uncertain.

Keywords: Siberia; climate; ecosystem; endemic; limnology.


Conflict of interest statement

The authors declare no competing interest.

Figures

Fig. 1.
Fig. 1.
Location of Lake Baikal and its catchment (gray) together with the location of World Meteorological Organization station in Irkutsk, major catchment rivers (brown), coring sites (BAIK13-1, BAIK13-4), and sites providing additional data used in this study (BAIK13-7).
Fig. 2.
Fig. 2.
Proxy records from Lake Baikal reflecting changes in silicon cycling in the lake. (A) δ30Sidiatom from Lake Baikal. (B) Relative rates of photic zone silicic acid [SiOH4] utilization. (C) Biogenic silica (BSi) mass accumulation rates (MARs) at core site BAIK13-1 (Fig. 1). (D) Changes in photic zone silicic acid supply relative to a value of 100% at 2005 CE. Shaded region for δ30Sidiatom reflects the absolute analytical uncertainty (2σ) of the isotope analysis. Shaded polygons for silicic acid supply/utilization and BSi MAR reflect the 1σ uncertainty derived from Monte Carlo simulations (10,000 replicates). Age boundaries for the Little Ice Age (LIA) and Medieval Climate Anomaly (MCA) are based on diatom assemblage records of environmental change from Lake Baikal (22). Also shown are age boundaries for the Dark Ages Cold Period (DACP). Subplots in B and D document changes since 1900 CE.
Fig. 3.
Fig. 3.
Drivers of silicic acid supply in Lake Baikal. (A) Mean surface water temperatures (SWTs) (May to October) from shoreline locations across Lake Baikal (29). (B) CERA-20C (32) and ERA5 (33) wind speed reanalysis data from the barycentre of Lake Baikal and modeled 5-y running mean Ekman transport in Lake Baikal during the typical periods of downwelling (May to June and December to January). Both datasets are shown as anomalies relative to a baseline period of 1990 to 2000 CE. (C) Changes in photic zone silicic acid supply relative to a value of 100% at 2005 CE with the shaded polygon reflect the 1σ uncertainty derived from Monte Carlo simulations (10,000 replicates). (D) Annual mean surface air temperature (SAT) at Irkutsk (World Meteorological Organization station 30710 [52°16′20″ N, 104°18′29″ E; elevation, 467 m]) (Fig. 1). (E) South basin annual ice cover duration. The black lines and gray confidence intervals on individual panels show a GAM fitted to each time series.
Fig. 4.
Fig. 4.
Diatom community changes at core site BAIK13-7 (Fig. 1) (14, 16). (A) Changes in photic zone silicic acid supply (relative to a value of 100% at 2005 CE) together with the ratio of autumn/spring taxa, detrended canonical correspondence analysis (DCCA) axis 1 scores reflecting diatom composition turnover, principal-components analysis (PCA) axis 1 scores reflecting changing taxa composition, relative abundance of U. acus and A. skvortzowii, as well as mean surface water temperatures (SWTs) (May to October) from shoreline locations across Lake Baikal (29). (B) First derivatives and 95% simultaneous confidence intervals of GAMs fitted to each time series. Where the simultaneous interval does not include 0, the models detect significant temporal change in the proxy record.

Similar articles

Cited by

References

    1. O’Reilly C. M.et al. ., Rapid and highly variable warming of lake surface waters around the globe. Geophys. Res. Lett. 42, 10773–10781 (2015).
    1. Grill G.et al. ., Mapping the world’s free-flowing rivers. Nature 569, 215–221 (2019). - PubMed
    1. Obrist D.et al. ., A review of global environmental mercury processes in response to human and natural perturbations: Changes of emissions, climate, and land use. Ambio 47, 116–140 (2018). - PMC - PubMed
    1. Hall S. R., Mills E. L., Exotic species in large lakes of the world. Aquat. Ecosyst. Health Manage. 3, 105–135 (2000).
    1. Vadeboncoeur Y., McIntyre P. B., Zanden M. J. V., Borders of biodiversity: Life at the edge of the world’s large lakes. Bioscience 61, 526–537 (2011).

Publication types

LinkOut - more resources