. 2020 Nov 3;117(44):27587-27597.
doi: 10.1073/pnas.1919139117. Epub 2020 Oct 19.

Global diversity of microbial communities in marine sediment

Affiliations

Global diversity of microbial communities in marine sediment

Tatsuhiko Hoshino et al. Proc Natl Acad Sci U S A. .

Abstract

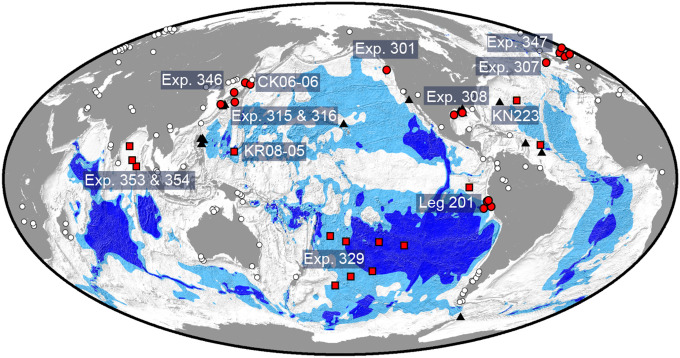
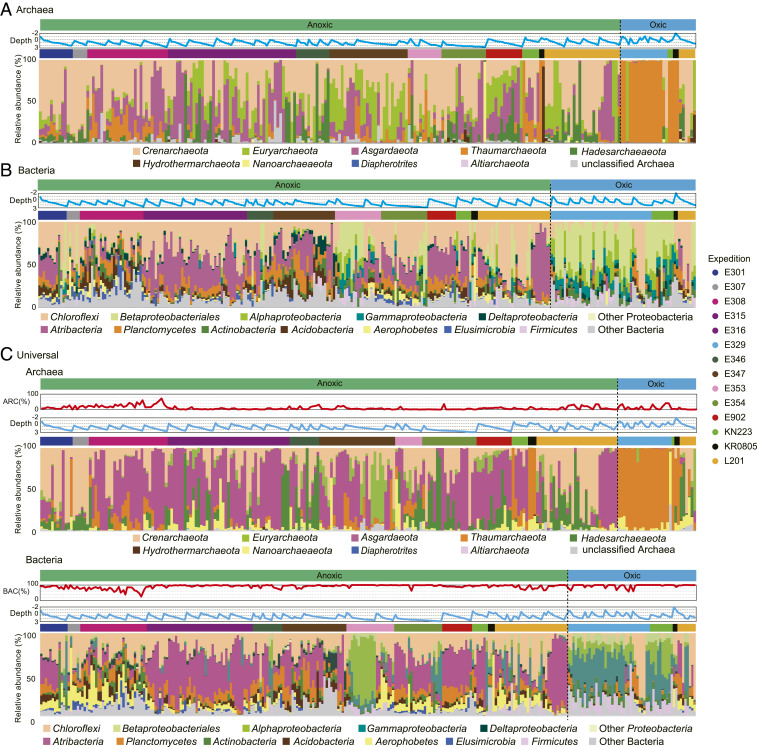
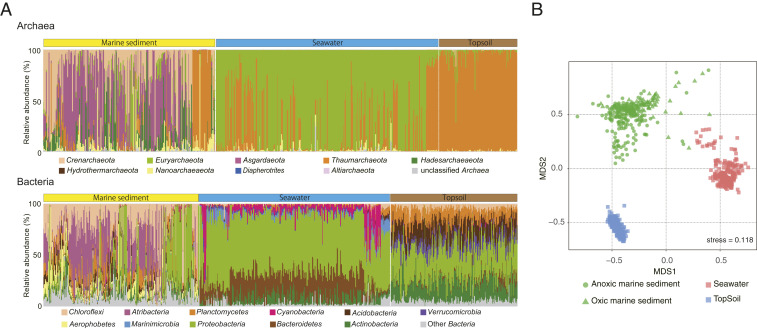
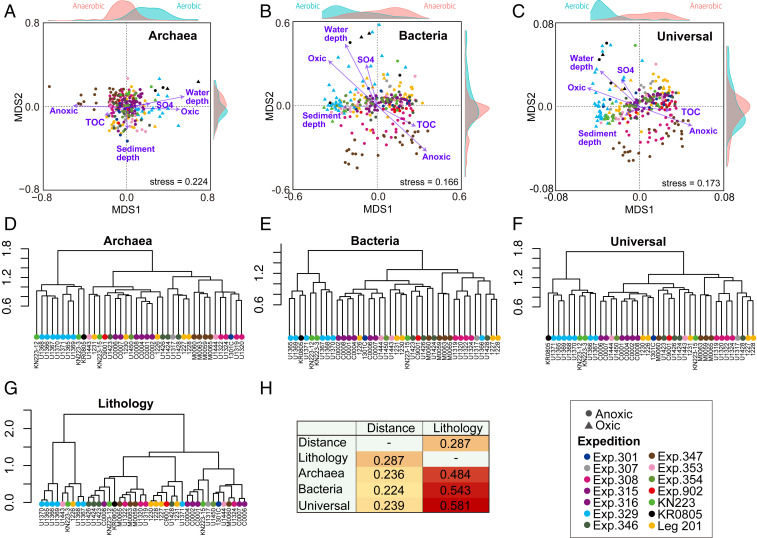
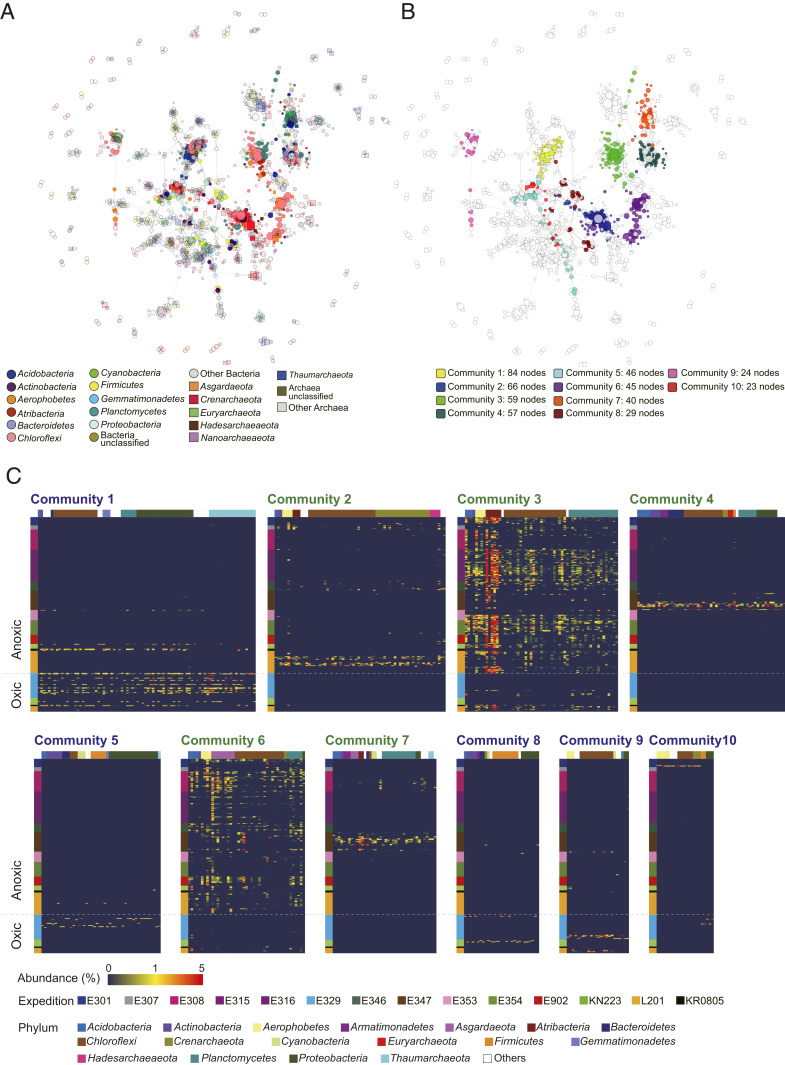
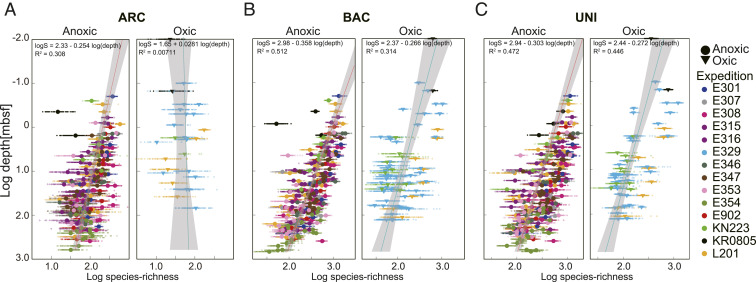
Microbial life in marine sediment contributes substantially to global biomass and is a crucial component of the Earth system. Subseafloor sediment includes both aerobic and anaerobic microbial ecosystems, which persist on very low fluxes of bioavailable energy over geologic time. However, the taxonomic diversity of the marine sedimentary microbial biome and the spatial distribution of that diversity have been poorly constrained on a global scale. We investigated 299 globally distributed sediment core samples from 40 different sites at depths of 0.1 to 678 m below the seafloor. We obtained ∼47 million 16S ribosomal RNA (rRNA) gene sequences using consistent clean subsampling and experimental procedures, which enabled accurate and unbiased comparison of all samples. Statistical analysis reveals significant correlations between taxonomic composition, sedimentary organic carbon concentration, and presence or absence of dissolved oxygen. Extrapolation with two fitted species-area relationship models indicates taxonomic richness in marine sediment to be 7.85 × 10³ to 6.10 × 10⁵ and 3.28 × 10⁴ to 2.46 × 10⁶ amplicon sequence variants for Archaea and Bacteria, respectively. This richness is comparable to the richness in topsoil and the richness in seawater, indicating that Bacteria are more diverse than Archaea in Earth's global biosphere.

Keywords: marine sediment; microbial diversity; subseafloor life.


Conflict of interest statement

The authors declare no competing interest.

Figures

Fig. 1.
Fig. 1.
Location of sampling sites. Red circles indicate ocean-margin sites, and red squares indicate open-ocean sites, respectively. Light blue and dark blue regions, respectively, show maximum and minimum areas where dissolved oxygen and aerobic activity may occur throughout the sediment (4). A total of 299 sediment samples from many different depths below the seafloor (0.1 to 678 mbsf) were collected from 40 sites during 14 scientific expeditions: Ocean Drilling Program (ODP) Leg 201; IODP Exp. 301; ODP Exp. 307; IODP Exp. 308; IODP Exps. 315 and 316; IODP Exp. 346; IODP Exp. 347; IODP Exp. 353; IODP Exp. 354; drilling vessel Chikyu Exp. CK06-06; research vessel (R/V) Knorr cruise KN223; and R/V Kairei cruise KR08-05. White circles mark topsoil sites (44), and black triangles mark seawater sites (, –49) that are included for comparison between different global biomes.
Fig. 2.
Fig. 2.
Taxonomic composition of marine sedimentary microbial communities. (A) Archaeal community composition obtained for 235 samples by using Archaea-specific primers. (B) Bacterial community composition obtained for 272 samples by using Bacteria-specific primers. (C) Archaeal community composition for 245 samples and bacterial community composition for 281 samples obtained by using the universal primers. For AC, samples containing fewer than 1,000 sequences are not shown. The upper light blue line charts in each panel show sediment depth on a logarithmic scale. Colored bars above the bar charts in AC indicate expeditions. The upper red line charts in C indicate relative abundances of Archaea (ARC) or Bacteria (BAC) in the Universal sequence library. Classification is based on the SILVA 132 SSU database (https://www.arb-silva.de/). Gammaproteobacteria in the charts do not include Betaproteobacteriales, which are enumerated separately.
Fig. 3.
Fig. 3.
Comparison of the microbial community compositions of marine sediment, seawater, and topsoil. (A) Archaeal and bacterial community compositions obtained by using the 16S rRNA universal primers. The gene sequences of seawater and topsoil samples were compiled from previous publications (, , –49). (B) NMDS ordination plots generated using Jaccard similarity index values derived from the rarefied ASV populations.
Fig. 4.
Fig. 4.
Beta diversity of microbial communities in marine sediment. (AC) NMDS ordination plots for the Archaea (A), Bacteria (B), and Universal (C) libraries, generated using Jaccard similarity index values. The Jaccard values were derived from the rarefied ASV populations in 235, 272, and 281 sediment samples for the Archaea, Bacteria, and Universal libraries, respectively. Purple arrows represent vectors that were fitted with environmental factors characterized by significance values of P < 0.01. (DF) Unweighted pair-group method with arithmetic mean (UPGMA) dendrograms of the archaeal (D), bacterial (E), and universal (F) communities, respectively, from the 40 sites, based on Jaccard similarity index values. (G) UPGMA dendrogram of lithology, based on mineral composition of sediment at the 40 sites (Dataset S2). (H) Mantel test results used to determine if geographic distance or lithology is correlated with microbial community composition.
Fig. 5.
Fig. 5.
Network analysis of co-occurring ASVs. Node sizes are proportional to PageRank. (A) Node colors indicate phylogenetic groups. Circles and squares respectively represent bacterial and archaeal groups. Lightly tinted nodes indicate ASVs not in the top 10 largest communities. (B) Node colors indicate the 10 largest communities in the network shown in A. Nodes not in the 10 largest communities are shown as white dots with light gray outlines. (C) Heat maps of the relative proportions of ASVs in each sample. The color bar on the left represents expeditions, and the color bar on the top represents phylum-level taxonomies. The names of communities mainly consisting of ASVs from anoxic sediment are in green, whereas communities mainly consisting of ASVs from oxic sediment are in blue.
Fig. 6.
Fig. 6.
Depth profiles of microbial richness in oxic marine sediment and anoxic marine sediment. (AC) Archaeal (ARC), bacterial (BAC), and universal (UNI) ASV richness (Chao-1 estimator), calculated using data rarified to 1,000 reads per sample. Small, pale points represent the 100 resamplings per sample, and large points represent the mean values of the resamplings.

Similar articles

Cited by

References

    1. Kallmeyer J., Pockalny R., Adhikari R. R., Smith D. C., D’Hondt S., Global distribution of microbial abundance and biomass in subseafloor sediment. Proc. Natl. Acad. Sci. U.S.A. 109, 16213–16216 (2012). - PMC - PubMed
    1. Parkes R. J.et al. ., A review of prokaryotic populations and processes in sub-seafloor sediments, including biosphere:geosphere interactions. Mar. Geol. 352, 409–425 (2014).
    1. Parkes R. J.et al. ., Deep bacterial biosphere in Pacific Ocean sediments. Nature 371, 410–413 (1994).
    1. D’Hondt S.et al. ., Presence of oxygen and aerobic communities from seafloor to basement in deep-sea sediment. Nat. Geosci. 8, 299–304 (2015).
    1. Hoshino T., Inagaki F., Abundance and distribution of Archaea in the subseafloor sedimentary biosphere. ISME J. 13, 227–231 (2019). - PMC - PubMed

Publication types

LinkOut - more resources