. 2020 Oct 19;11(1):5272.
doi: 10.1038/s41467-020-18997-2.

Mutations associated with neuropsychiatric conditions delineate functional brain connectivity dimensions contributing to autism and schizophrenia

Affiliations

Mutations associated with neuropsychiatric conditions delineate functional brain connectivity dimensions contributing to autism and schizophrenia

Clara A Moreau et al. Nat Commun. .

Abstract

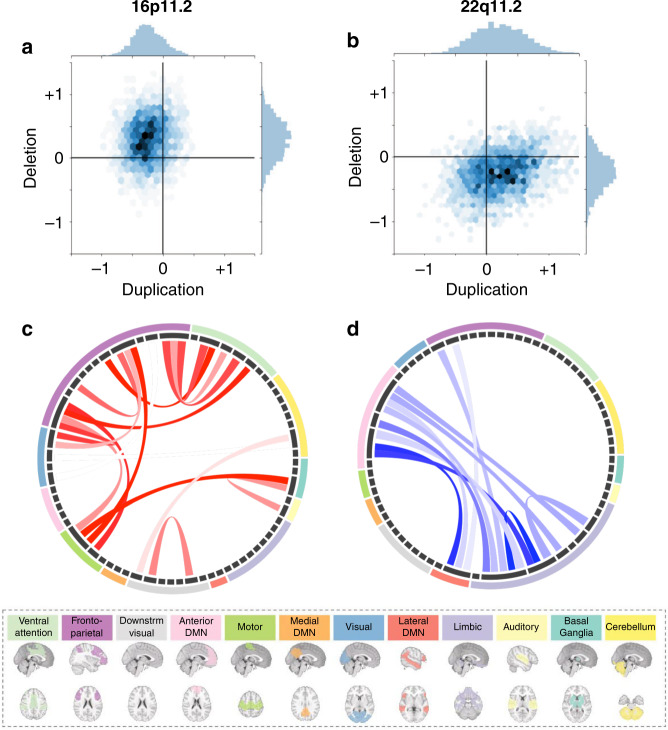
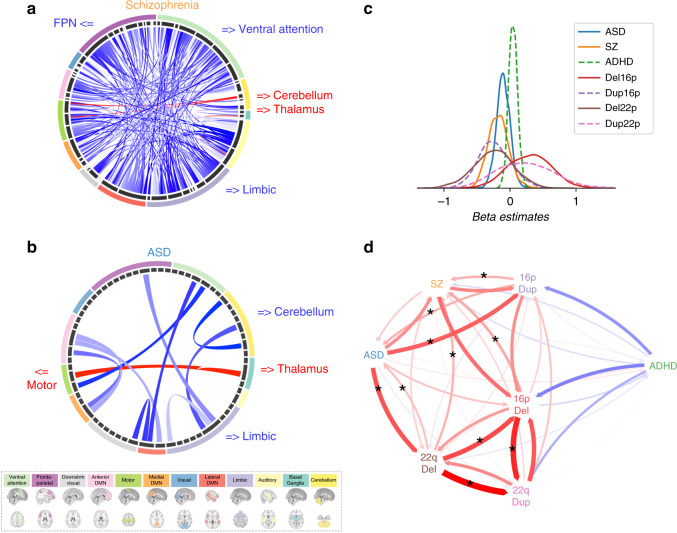
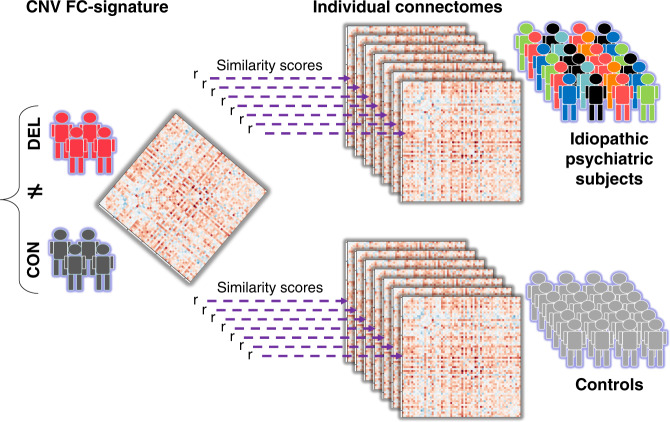
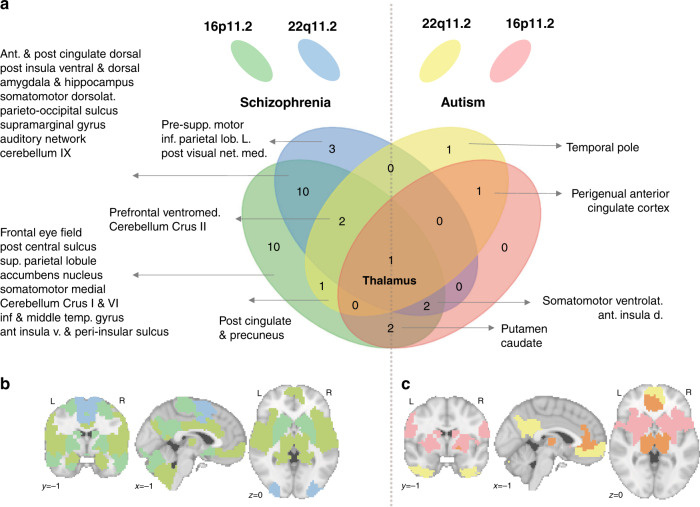
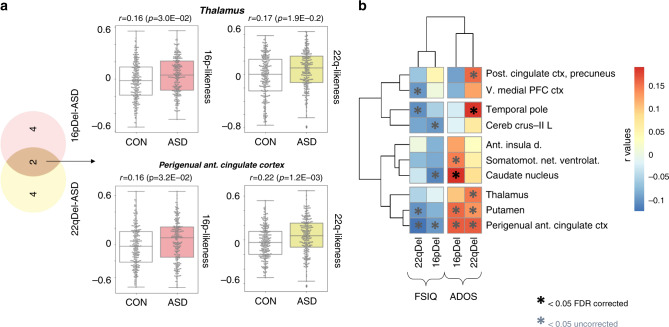
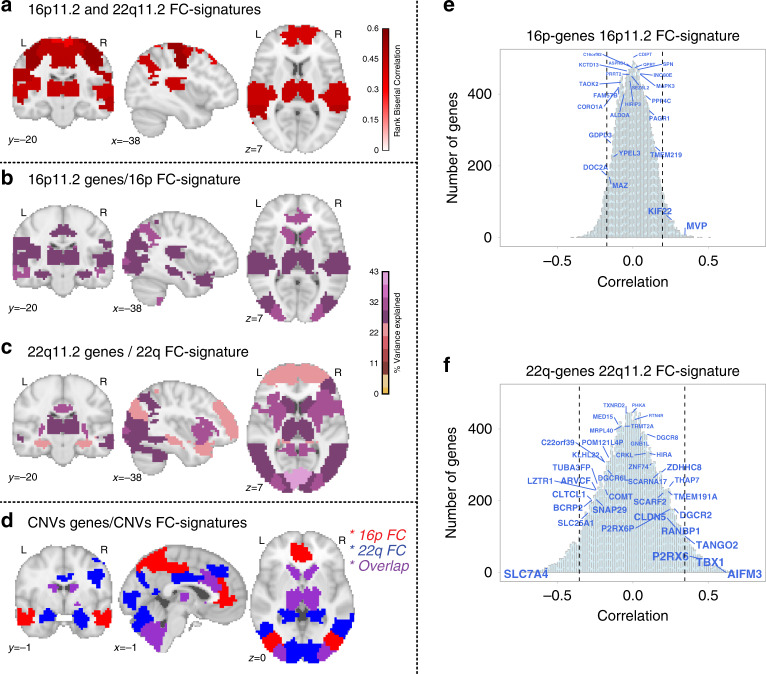
16p11.2 and 22q11.2 Copy Number Variants (CNVs) confer high risk for Autism Spectrum Disorder (ASD), schizophrenia (SZ), and Attention-Deficit-Hyperactivity-Disorder (ADHD), but their impact on functional connectivity (FC) remains unclear. Here we report an analysis of resting-state FC using magnetic resonance imaging data from 101 CNV carriers, 755 individuals with idiopathic ASD, SZ, or ADHD and 1,072 controls. We characterize CNV FC-signatures and use them to identify dimensions contributing to complex idiopathic conditions. CNVs have large mirror effects on FC at the global and regional level. Thalamus, somatomotor, and posterior insula regions play a critical role in dysconnectivity shared across deletions, duplications, idiopathic ASD, SZ but not ADHD. Individuals with higher similarity to deletion FC-signatures exhibit worse cognitive and behavioral symptoms. Deletion similarities identified at the connectivity level could be related to the redundant associations observed genome-wide between gene expression spatial patterns and FC-signatures. Results may explain why many CNVs affect a similar range of neuropsychiatric symptoms.


Conflict of interest statement

The authors declare no competing interests.

Figures

Fig. 1
Fig. 1. Connectome-wide effects of CNVs.
a, b Scatterplot (hexagonal plot), showing estimates (beta values) from connectome-wide association studies (CWAS) performed between 16p11.2 (a) and 22q11.2 (b) CNVs and their respective controls. In total, 2080 beta estimates were obtained from a linear model computed from z-scored connectomes based on the variance of the respective controls. The color hue represents the number of beta estimates in the hexagon bin. Y-axis: beta values associated with deletions (CWAS comparing deletions vs controls). X-axis: beta-values associated with duplications (CWAS comparing duplications vs controls). c, d Each chord diagram shows the top 20% of connections surviving FDR correction (q < 0.05) from the 16p11.2 deletion (c) and 22q11.2 deletion (d) CWAS. Each chord represents a significantly altered connection between two functional seed regions. All 64 seed regions are represented in the dark gray inner circle. The width of the seed region in the gray inner circle corresponds to the number of altered connections. Seed regions are grouped into 12 functional networks (outer ring, Supplementary Data 1.9). Networks are represented in 12 brains below the two diagrams. Red chords represent overconnectivity and blue chords underconnectivity.
Fig. 2
Fig. 2. Connectome-wide similarity across ASD, SZ, and deletions.
a, b Each chord diagram shows the top 20% connections surviving FDR correction (q < 0.05) from the SZ (a) and ASD (b) CWAS. Each chord represents a significantly altered connection between two functional seed regions. All 64 seed regions are represented in the dark gray inner circle. The width of the seed region in the gray inner circle corresponds to the number of altered connections. Seed regions are grouped into 12 functional networks (outer ring, Supplementary Data 1.9). The network colors correspond to the legend below. Red chords represent overconnectivity and blue chords underconnectivity. c Density plots represent the distribution of 2080 beta estimates for the CWAS (whole brain contrast of cases versus controls) for the SZ, ASD, ADHD, deletion and duplication groups. X-axis values = z-scores of Beta estimates, which were obtained from linear models computed using z-scored connectomes based on the variance of the respective controls. d The spatial similarity of whole-brain FC-signatures between CNVs and idiopathic psychiatric conditions. Arrows represent the correlation between group-level FC-signatures and the individual connectomes of either cases or controls from another group. The correlation was computed in both directions. The Red and blue arrows represent positive and negative correlations respectively. Arrow thickness represents the effect size of the Mann–Whitney test. Stars represent similarities (Mann–Whitney tests) surviving FDR. ASD autism spectrum disorder, SZ schizophrenia, ADHD attention-deficit hyperactivity disorder, FPN fronto-parietal network, 16pDel 16p11.2 deletion, 22qDel 22q11.2 deletion, 16pDup 16p11.2 duplication, 22qDup 22q11.2 duplication.
Fig. 3
Fig. 3. Testing similarities across CNVs and idiopathic conditions.
Similarities of FC-signatures across this study were characterized by correlating (Pearson’s r) a group-level FC-signature with individual connectomes from either cases and controls. The r values obtained for all cases and all controls were compared using a Mann–Whitney test. Here, the group level connectome is represented by a matrix of 2080 beta values, on the left side. It is obtained by contrasting deletion cases (red) and controls (dark gray). The beta map is correlated to seven individual connectomes of psychiatric cases and seven connectomes of controls. The different colors used for psychiatric cases represent phenotypic heterogeneity.
Fig. 4
Fig. 4. Regional FC similarity between psychiatric diagnoses and deletions.
The FC-signatures of both deletions are decomposed into 64 seed-regions. Deletion FC-signatures are correlahe individual connectivity profile of subjects with a psychiatric diagnosis and their respective control subjects. Of note, the correlation is equivalent to the mean centering of all region-based FC-signatures. Significantly higher similarities of patients with either ASD and SZ were present in 33 seeds regions (FDR) and are presented on the right and the left side of the Venn diagram, respectively (a), and also in the corresponding left (b) and right (c) brain maps. At the intersection of all ellipses, the thalamus FC-signatures of both deletions showed increased similarity with individuals who have a diagnosis of ASD or SZ compared to their respective controls. 16pDel 16p11.2 deletion, 22qDel 22q11.2 deletion, Ant anterior, Post posterior, dorsolat dorsolateral, Inf inferior, L. left, v. ventral, net. network, med medial, Supp supplementary, lob lobule (Full-name labels are provided in Supplementary Data 1.9).
Fig. 5
Fig. 5. Relationship between the deletion FC-signatures and behavior.
a Boxplots represent the connectivity similarity for two seed regions (thalamus and perigenual anterior cingulate cortex). Boxplots display the 25th, 50th, and 75th percentile of the underlying data. Boxplot whiskers encompass data points within 1.5 times the interquartile range from the median line and more extreme data points are labeled with outlier fliers. Each data point represents one individual: r-value of the Pearson correlation between the deletion FC-signatures and the FC-profile of an individual with ASD (n = 225 in the colored boxplots) or a control subject (n = 234 in the non-colored boxplots). For the two seed regions, individuals with ASD show significantly higher similarity (FDR, q < 0.05) with the 16p11.2 (pink) and 22q11.2 (yellow) deletion FC-signatures than the individual controls. All seed regions showing significantly higher similarity with ASD are represented in the Venn diagram on the left. b We investigated the relationship with cognitive scores and found that stronger individual similarity (Pearson’s r) with the deletion FC-signature was associated with more severe symptoms measured by FSIQ and ADOS. Heatmaps show the level of correlation (FDR, q < 0.05, two-sided) between behavior scores and the similarity with deletion FC-signatures. 16pDel 16p11.2 deletion, 22qDel 22q11.2 deletion, FSIQ full-scale intelligence quotient, ADOS autism diagnostic observation schedule, ant. anterior, post posterior, v. ventral, PFC prefrontal cortex, cereb cerebellum, d. dorsal, L left, ctx cortex, net. network. Full-name labels are provided in Supplementary Data 1.9.
Fig. 6
Fig. 6. FC similarities between CNVs and relationship with gene expression.
a FC similarities between both deletions at the regional level. The values in the brain map represent the level of the FC similarity between deletions (rank biserial correlation, Mann–Whitney test). The values are thresholded (FDR, 64 regions): 18 out of 64 regions are similar between deletions. b Relationship between spatial patterns of gene expression within the 16p11.2 locus and regional FC signatures of the 16p11.2 deletion. A partial least square regression (PLSR) was conducted for each of the 64 regions. Maps are thresholded (FDR corrected for 64 regions) and color code represents the percentage of variance explained by gene expression using two components in the PLSR. c The same analysis was conducted for 22q11.2 genes and the 22q11.2 deletion FC signature. b, c Eleven regions overlapped across PLSR maps: thalamus, caudate, anterior insula and posterior insula sulcus, amygdala and hippocampus, cerebellum 9 and right crus-2, dorsal anterior cingulate, left inferior parietal lobule, medial posterior visual network, lateral posterior visual network, and dorsal visual network. Three (over the 18) regions identified in the between deletion similarity (a) analysis are also present in the gene expression/FC-signature association maps (b, c): Thalamus, dorsal anterior cingulate, and left inferior parietal lobule. d Low specificity for the relationship between spatial patterns of gene expression and regional FC deletion signatures. In red: the 16p11.2 regional FC associated with the expression patterns of both the 16p11.2 and the 22q11.2 genes. In blue, the 22q11.2 regional FC is associated with the expression patterns of genes in both genomic loci. In purple, seven regions were found with both deletion FC-signatures, and the expression patterns of genes encompassed in both genomic loci. e, f Expression patterns of genes within and outside CNVs correlate with FC-signatures of 16p11.2 and 22q11.2 deletions. The light blue histogram represents the distribution of correlations for 15663 genes with available gene expression data from the AHBA. X-axis values: Pearson coefficients. Y-axis values: number of genes. Genes within the CNVs have font-size scaled based on p values. Dotted lines represent the 5th and 95th percentiles of the correlation distribution genome-wide.

References

    1. Cooper GM, et al. A copy number variation morbidity map of developmental delay. Nat. Genet. 2011;43:838–846. doi: 10.1038/ng.909. - DOI - PMC - PubMed
    1. Kirov G, et al. The penetrance of copy number variations for schizophrenia and developmental delay. Biol. Psychiatry. 2014;75:378–385. doi: 10.1016/j.biopsych.2013.07.022. - DOI - PMC - PubMed
    1. Sanders SJ, et al. Insights into autism spectrum disorder genomic architecture and biology from 71 risk loci. Neuron. 2015;87:1215–1233. doi: 10.1016/j.neuron.2015.09.016. - DOI - PMC - PubMed
    1. Marshall CR, et al. Contribution of copy number variants to schizophrenia from a genome-wide study of 41,321 subjects. Nat. Genet. 2017;49:27–35. doi: 10.1038/ng.3725. - DOI - PMC - PubMed
    1. Gudmundsson OO, et al. Attention-deficit hyperactivity disorder shares copy number variant risk with schizophrenia and autism spectrum disorder. Transl. Psychiatry. 2019;9:258. doi: 10.1038/s41398-019-0599-y. - DOI - PMC - PubMed

Publication types

MeSH terms