. 2020 Oct 19;10(1):17715.
doi: 10.1038/s41598-020-74606-8.

Heat-responsive and time-resolved transcriptome and metabolome analyses of Escherichia coli uncover thermo-tolerant mechanisms

Affiliations

Heat-responsive and time-resolved transcriptome and metabolome analyses of Escherichia coli uncover thermo-tolerant mechanisms

Sinyeon Kim et al. Sci Rep. .

Abstract

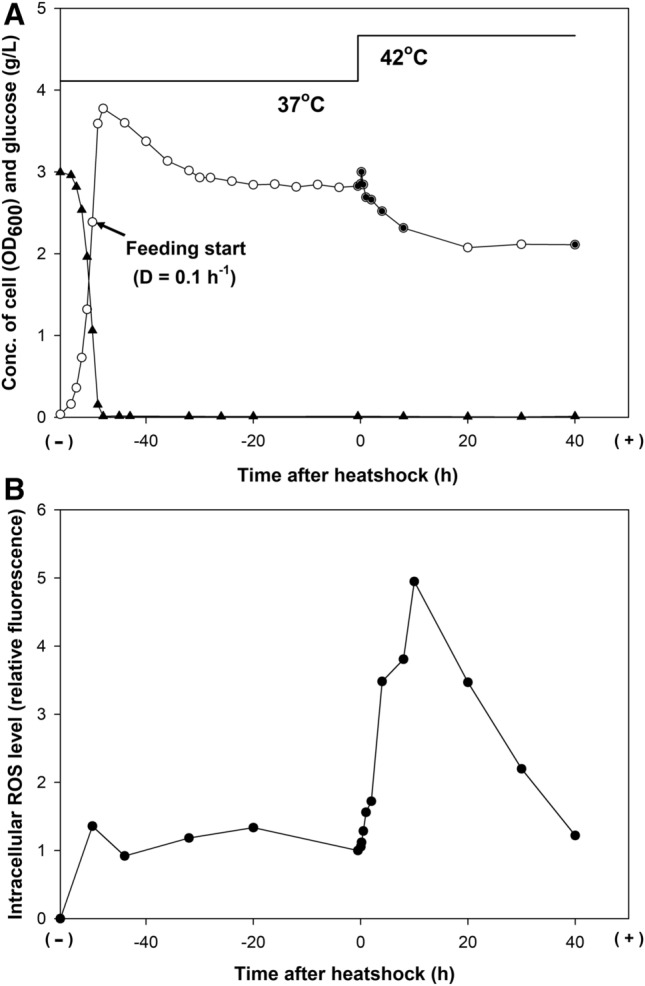
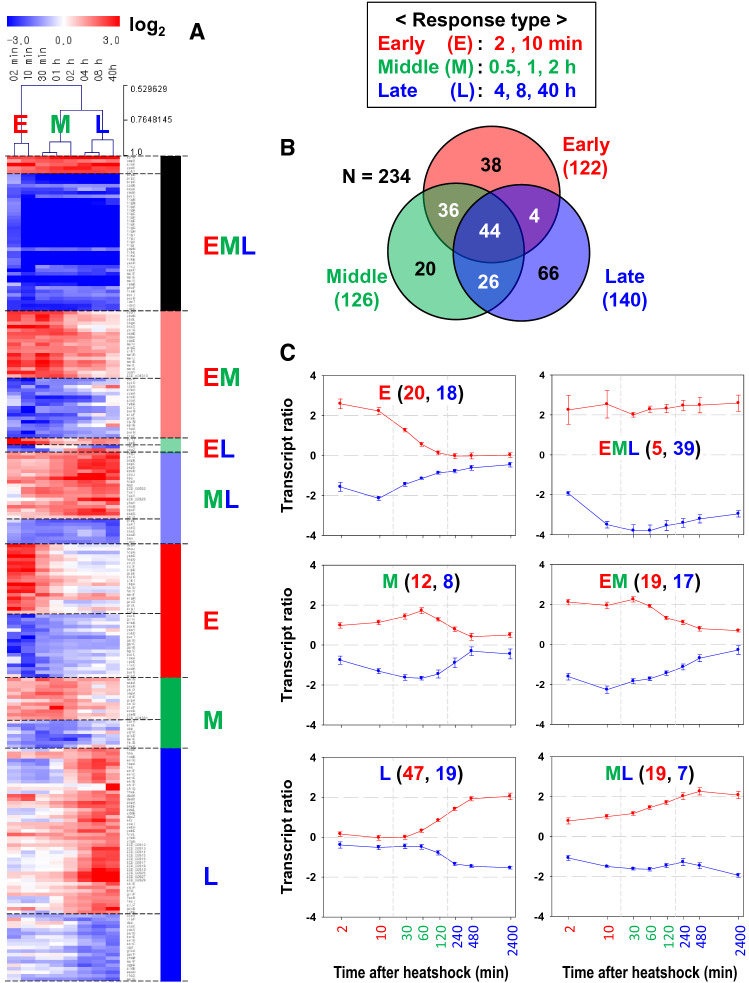
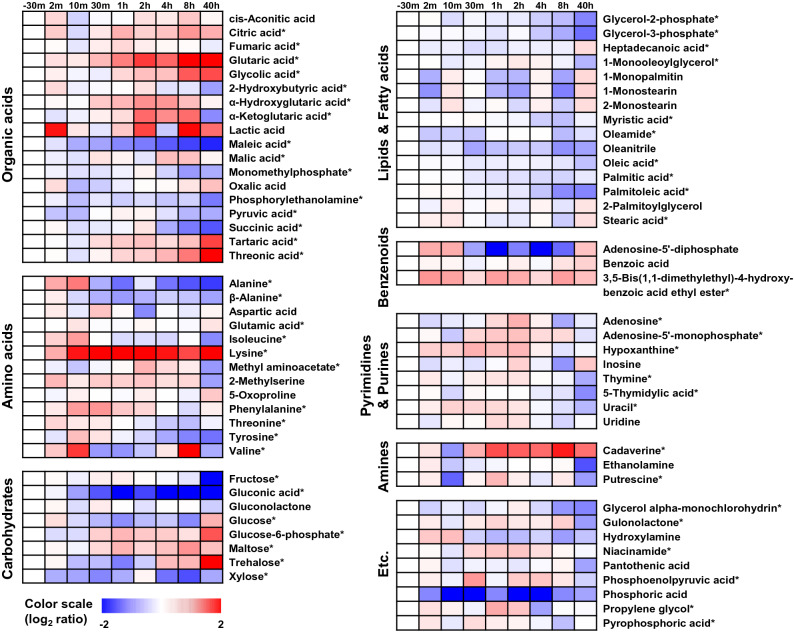
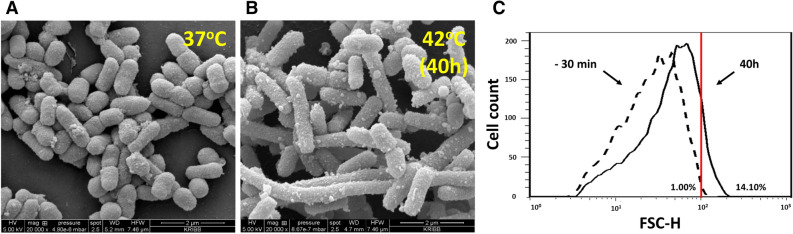
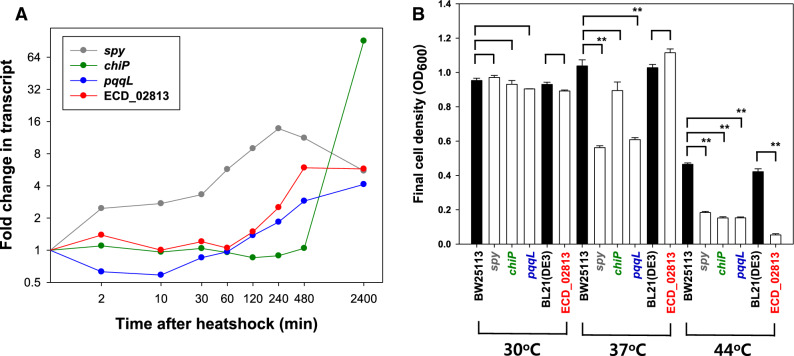
Current understanding of heat shock response has been complicated by the fact that heat stress is inevitably accompanied by changes in specific growth rates and growth stages. In this study, a chemostat culture was successfully performed to avoid the physico-chemical and biological changes that accompany heatshock, which provided a unique opportunity to investigate the full range of cellular responses to thermal stress, ranging from temporary adjustment to phenotypic adaptation at multi-omics levels. Heat-responsive and time-resolved changes in the transcriptome and metabolome of a widely used E. coli strain BL21(DE3) were explored in which the temperature was upshifted from 37 to 42 °C. Omics profiles were categorized into early (2 and 10 min), middle (0.5, 1, and 2 h), and late (4, 8, and 40 h) stages of heat stress, each of which reflected the initiation, adaptation, and phenotypic plasticity steps of the stress response. The continued heat stress modulated global gene expression by controlling the expression levels of sigma factors in different time frames, including unexpected downregulation of the second heatshock sigma factor gene (rpoE) upon the heat stress. Trehalose, cadaverine, and enterobactin showed increased production to deal with the heat-induced oxidative stress. Genes highly expressed at the late stage were experimentally validated to provide thermotolerance. Intriguingly, a cryptic capsular gene cluster showed considerably high expression level only at the late stage, and its expression was essential for cell growth at high temperature. Granule-forming and elongated cells were observed at the late stage, which was morphological plasticity occurred as a result of acclimation to the continued heat stress. Whole process of thermal adaptation along with the genetic and metabolic changes at fine temporal resolution will contribute to far-reaching comprehension of the heat shock response. Further, the identified thermotolerant genes will be useful to rationally engineer thermotolerant microorganisms.


Conflict of interest statement

The authors declare no competing interests.

Figures

Figure 1
Figure 1
Chemostat culture of E. coli BL21(DE3) under heatshock stress. (A) Time profiles of the cell density (open circle) and glucose concentration in the culture media (filled triangle). The filled circles indicate the sampling points for transcriptome and proteome analyses, which were done 30 min before the temperature increase (from 37 to 42 °C) and after 2 min, 10 min, 30 min, 1 h, 2 h, 4 h, 8 h, and 40 h. (B) Time profiles of the intracellular reactive oxygen species (ROS) level.
Figure 2
Figure 2
Genes differentially expressed at the early, middle, and late periods of the upshifted temperature. The mRNA log2 ratios of time-series data were normalized to a sample from pre-perturbation (30 min before the temperature upshift). (A) Heatmap of the transcript ratios grouped according to time stages with member genes in rows and sampling time points in columns. Clustering of the sampling time points is shown above the heat map for the early (E), middle (M), and late (L) stages. The image was created with MeV software (version 4.9.0, https://mev.tm4.org). (B) Venn diagram of the differentially expressed genes (DEGs) identified in the different time stages. (C) Time profiles of averaged transcript ratios of the DEGs according to the time stage. The X-axis denotes the culture time after the temperature upshift (min in log scale), and the Y axis denotes the log2-transformed transcript ratio in reference to the mRNA intensity at 30 min before the perturbation. The error bar denotes the standard error of the mean from the member genes. In each plot, the numbers of upregulated and downregulated genes are depicted in red and blue, respectively.
Figure 3
Figure 3
Time profiles of the intracellular metabolites under heat stress. Seventy-seven metabolites were identified via the GC-TOF–MS analysis and are listed in Supplementary Table S3. Fifty-seven of these metabolites that were significantly differentially expressed among the samples (VIP > 1.0 and p < 0.05) are indicated by asterisks. Fold-change was calculated as the relative abundance of each metabolite in every sample relative to that in the sample taken before the perturbation. The metabolic alternations are depicted as heatmaps on a log2 scale.
Figure 4
Figure 4
Morphological changes of E. coli during heatshock. Scanning electron micrographs of bacterial cells grown in the chemostat culture at 37 °C 30 min before the temperature upshift (− 30 min sample) (A) and 40 h after the temperature upshift to 42 °C (B). Cell size distributions determined using flow cytometry analysis (C). Dotted and solid lines denote cells at 37 °C 30 min before the temperature upshift and 40 h after the shift to 42 °C, respectively. The vertical red line represents the longest 1% size of the -30 min sample, which was used as the threshold. The mean forward scatter height (FSC-H) on the X axis represents the length of the rod-shaped bacteria. Percentages of elongated cell size in the total cells are 1% for the − 30 min samples and 14.10% for 40 h samples.
Figure 5
Figure 5
Effect of heatshock-responsive gene (spy, chiP, pqqL, and ECD_02813) deletion on bacterial growth with temperature. (A) Temporal expression levels. The X-axis denotes the culture time after the temperature upshift (min in log scale). The Y axis denotes the log2-transformed transcript ratio in reference to the mRNA intensity 30 min before the temperature upshift. (B) Final cell densities of the deleted mutant strains (in white bars) and their background strains (black bar) grown in MR medium for 24 h at 30 °C, 37 °C, and 44 °C (**p < 0.01). The error bars represent the standard deviation of the mean from three independent cultivations.
Figure 6
Figure 6
A proposed regulation model of E. coli in response to the prolonged heat stress. The solid black lines represent the findings of this study. The solid gray lines denote the present results that agree with those of previous studies. The dotted lines represent the hypothetical links suggested in this study, requiring experimental validation. Arrows represent the activation influences, and blunt-headed lines denote repression. Rectangles depict the biological processes or their associated genes, and the parentheses denote the early (2 and 10 min; E), middle (0.5, 1, and 2 h; M), and late (4, 8, and 40 h; L) stages of heat stress.

References

    1. Wick LM, Egli T. Molecular components of physiological stress responses in Escherichia coli. Adv. Biochem. Eng. Biotechnol. 2004;89:1–45. - PubMed
    1. Richter K, Haslbeck M, Buchner J. The heat shock response: life on the verge of death. Mol. Cell. 2010;40:253–266. doi: 10.1016/j.molcel.2010.10.006. - DOI - PubMed
    1. Guisbert E, Yura T, Rhodius VA, Gross CA. Convergence of molecular, modeling, and systems approaches for an understanding of the Escherichia coli heat shock response. Microbiol. Mol. Biol. Rev. 2008;72:545–554. doi: 10.1128/MMBR.00007-08. - DOI - PMC - PubMed
    1. Gross, C. A. Function and regulation of the heat shock proteins in Escherichia coli and Salmonella (ed. Neidhardt, F. C.) 1382–1399 (ASM Press, London, 1996).
    1. Arsene F, Tomoyasu T, Bukau B. The heat shock response of Escherichia coli. Int. J. Food Microbiol. 2000;55:3–9. doi: 10.1016/S0168-1605(00)00206-3. - DOI - PubMed

Publication types