. 2020 Oct 19;10(1):17594.
doi: 10.1038/s41598-020-74695-5.

Hydrostatic pressure can induce apoptosis of the skin

Affiliations

Hydrostatic pressure can induce apoptosis of the skin

Tien Minh Le et al. Sci Rep. .

Abstract

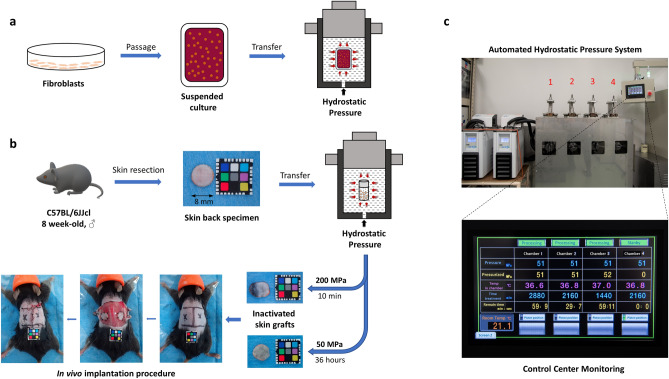
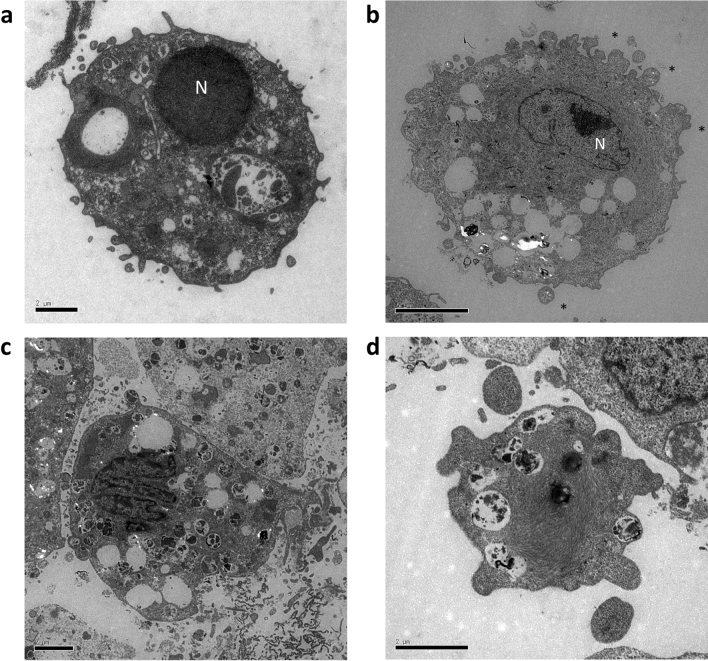
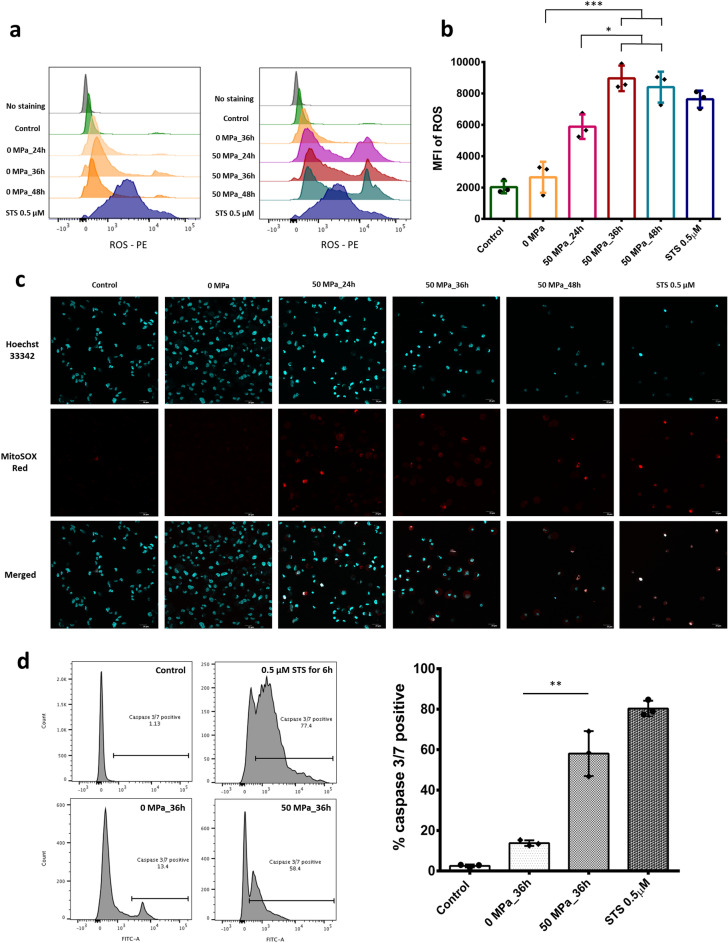
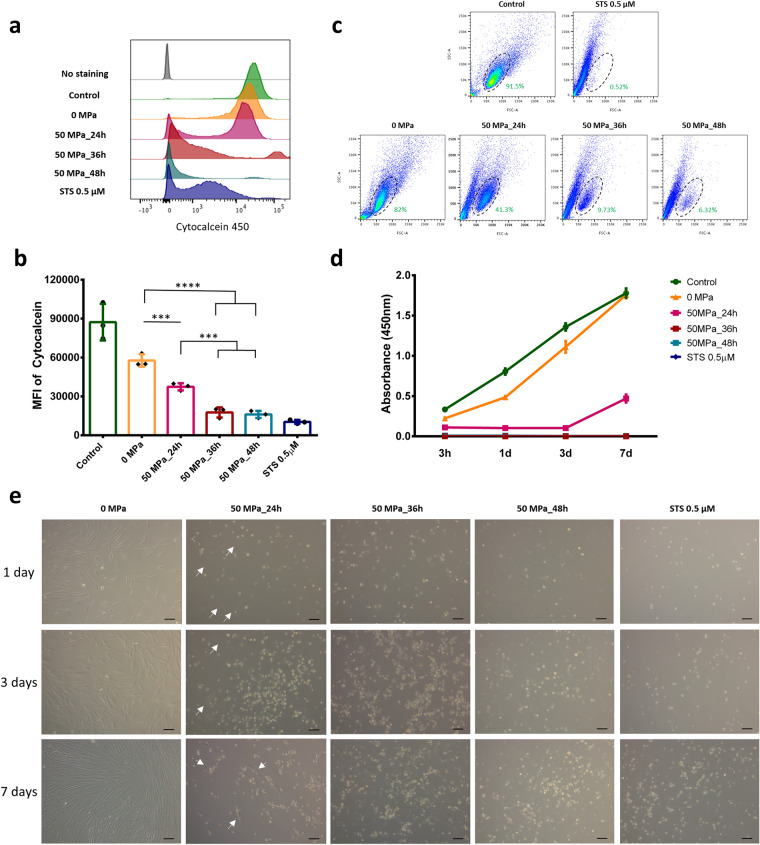
We previously showed that high hydrostatic pressure (HHP) treatment at 200 MPa for 10 min induced complete cell death in skin and skin tumors via necrosis. We used this technique to treat a giant congenital melanocytic nevus and reused the inactivated nevus tissue as a dermis autograft. However, skin inactivated by HHP promoted inflammation in a preclinical study using a porcine model. Therefore, in the present study, we explored the pressurization conditions that induce apoptosis of the skin, as apoptotic cells are not believed to promote inflammation, so the engraftment of inactivated skin should be improved. Using a human dermal fibroblast cell line in suspension culture, we found that HHP at 50 MPa for ≥ 36 h completely induced fibroblast cell death via apoptosis based on the morphological changes in transmission electron microscopy, reactive oxygen species elevation, caspase activation and phosphatidylserine membrane translocation. Furthermore, immunohistochemistry with terminal deoxynucleotidyl transferase dUTP nick-end labeling and cleaved caspase-3 showed most cells in the skin inactivated by pressurization to be apoptotic. Consequently, in vivo grafting of apoptosis-induced inactivated skin resulted in successful engraftment and greater dermal cellular density and macrophage infiltration than our existing method. Our finding supports an alternative approach to hydrostatic pressure application.


Conflict of interest statement

The authors declare no competing interests.

Figures

Figure 1
Figure 1
Schematic description of the pressurization process. (a) Preparation of suspended culture fibroblasts in a plastic bag and the induction of hydrostatic pressure inside the isostatic chamber. (b) Procedures for inactivating skin tissues by HHP and subcutaneous transplantation onto the backs of mice. A 1 cm × 1 cm color chart was used as a scale bar. (c) The new custom HHP device, comprising a temperature management system, four separate isostatic chambers for input objects (No. 1–4) and an automated touch screen control center.
Figure 2
Figure 2
Detection of apoptotic cells by PS externalization and membrane permeability. (a) Fibroblast cells were treated with 50 MPa HHP for different durations or with STS. Each cell is represented by a dot plot in the flow cytometer diagram formed by the combination of Apopxin Green-FITC and 7-AAD immunofluorescence. (b) The comparison of total apoptotic cells among groups. The control and STS treatment groups are not compared (n = 3). (c) Representative histograms of different fluorescence expression values and the comparison of the mean fluorescence intensity (MFI) of Apopxin Green (FITC) and 7-AAD (n = 3). (d) Immunofluorescence image of apoptosis/necrosis staining of cells treated by HHP for 36 h. Magnification 100×, scale bar: 10 μm. (e) Immunofluorescence images of apoptosis/necrosis staining show the difference in the density of viable cells (blue color) and apoptotic cells (green/red color) or dead cells (red color) in small magnification (10×, scale bar 50 μm) among groups. At higher magnifications (40×, scale bar 20 μm), the morphological characteristics of other stages of apoptotic cells in each group can be observed, particularly the release of apoptotic bodies (white arrowhead). Data are representative of at least three independent experiments.
Figure 3
Figure 3
Transmission electron microscopy (TEM) appearance of HHP-treated fibroblast cells. (a) Untreated cells (0 MPa) exhibited a normal morphology with intact membrane, scant cytoplasm and round nuclei (N). (b) Cells subjected to HHP 50 MPa for 36 h showed early apoptosis with chromatin condensation, black structures along the nuclear membrane and membrane blebbing (*); (c) late apoptosis with nuclear fragments of formed apoptotic bodies and many intracellular vacuoles; and (d) the release of apoptotic bodies at the final stage of apoptosis. Magnification 8000×, scale bar: 2 μm.
Figure 4
Figure 4
Reactive oxygen species (ROS) generation and activated caspase 3/7 in response to HHP treatment. (a) Left: representative histograms of the fluorescence expression of MitoSOX Red among the control, STS-treated and various time exposure of 0 MPa groups. Right: representative histograms of the fluorescence expression of MitoSOX Red among the control, STS-treated and HHP-exposed and unexposed groups. (b) Diagram comparing the MFI of ROS elevation among groups (n = 3). (c) Immunofluorescence images of ROS production stained by MitoSOX Red mitochondria indicator and Hoechst 33,342 showing the generation of a ROS signal after 50-MPa treatment for 24, 36 or 48 h. Scale bar: 20 μm. Data are representative of at least three independent experiments. (d) Activated caspase 3/7 fluorescence expression and ratio of caspase positivity between groups without HHP (0 MPa) and with 50 MPa for 36 h (n = 3).
Figure 5
Figure 5
Viability and proliferation of HHP-treated cells. (a) Representative histograms of Cytocalcein 450 fluorescence (viability stained) among groups, with cells exposed to 50 MPa for 36 and 48 h showing negative expression, similar to STS treatment, while those pressurized for 24 h show bimodal distribution. (b) The comparison diagram shows a significant reduction in the Cytocalcein MFI between the 0 MPa group and the group treated with 50 MPa for 24, 36 or 48 h (n = 3). (c) A flow cytometry analysis showing two distinct cell populations depending on the cell size (FSC) and granularity (SSC). The oval area in the control group indicates normal viable cells, which are present in the positive control (STS) group at only 0.52%. That number in the 0 MPa group is around 82% while viable cells account for around 41.3% after being pressurized at 50 MPa for 24 h and 9.73% and 6.32% after 36 and 48 h, respectively. Data are representative of at least three independent experiments. (d) Absorbance at 450 nm in the WST-8 assay shows the proliferation of control, untreated, HHP-treated and STS-treated cells after 7 days of seeding culture. Data are representative of at least two independent experiments, n = 7 for each time point. (e) Inverted light microscopy images of untreated, HHP-treated and STS-treated cells seeded onto a 24-well plate after 7 days of culture. The white arrow in the 50 MPa_24h group indicates viable cells. Magnification 10×, scale bar 100 μm. Data are representative of at least three independent experiments.
Figure 6
Figure 6
Ex vivo induced apoptosis in inactivated skin by HHP. (a) Representative HE stained micrographs of fresh mouse skin (Control), 0 MPa, 50 MPa, and 200 MPa. No marked differences were observed in the epidermis layer (blue arrow), dermal layer (blue dash arrow), collagen fibers, dermal white adipose tissue (dWAT), panniculus carnosus or other adnexal structures. Magnification 10×, scale bar 100 μm. (b) The diagram comparison of the dermal cellular density among groups shows a reduction in cell nuclei numbers in the 0 and 50 MPa groups after 36-h treatment (n = 4, p < 0.0001). (c) Representative TUNEL-stained micrographs of fresh mouse skin (Control) and skin exposed to 0, 50 and 200 MPa. Blue arrows indicate changes in the epidermis layer in the 0 and 50 MPa groups compared with the Control and 200 MPa groups. The immuno-positive signal intensity in the 0 and 50 MPa groups (brown color) was stronger than in the Control and 200 MPa groups. Magnification 10×, scale bar 100 μm. The higher-magnification micrographs in the lower right show more detail concerning each positively stained cell (brown signal) in all groups; scale bar 25 μm. (d) The diagram comparing the dermal TUNEL-positive cells among groups shows significant differences between the 50 MPa and other groups (n = 4, p < 0.0001 and p < 0.001). (e) Representative cleaved caspase-3-stained micrographs of fresh mouse skin (Control) and skin exposed to 0, 50 and 200 MPa. The brown-stained cells indicate immuno-positive signals. Magnification 20×, scale bar 100 μm. The higher-magnification micrographs in the lower right show more details concerning each positively stained cell (brown signal) in all groups; scale bar 25 μm. (f) The diagram comparing the dermal caspase-3-positive cells among groups shows differences between the 0 and 50 MPa groups and others (n = 4, p < 0.001) as well as a difference between the 0 and 50 MPa groups themselves (n = 4, p < 0.05).
Figure 7
Figure 7
In vivo infiltration of host cells and macrophages to inactivated dermis. (a) Representative HE-stained micrographs of skin grafts treated by HHP at 200 MPa for 10 min or 50 MPa for 36 h in implantation. Magnification 10×, scale bar 100 μm, *: granulation tissue formation, formula image 
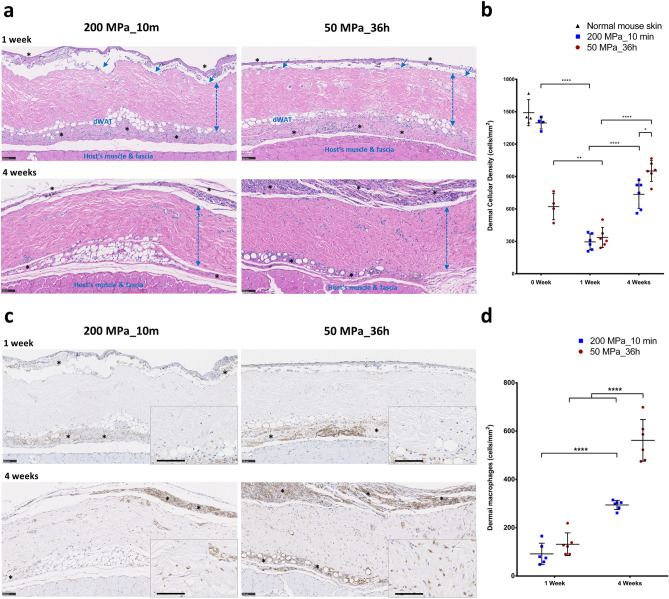
: dermis layer. (b) The diagram comparing the dermal cellular density shows a reduction in the numbers of cell nuclei in both groups at 1 week after implantation (n = 6, p < 0.01). At week 4, more cells had infiltrated into the inactivated dermis, followed by an increase in the dermal cellular density (p < 0.0001), and the density in the dermis of the 50 MPa group was higher than that is the 200 MPa group (p < 0.05). (c) Representative anti-F4/80 immunohistochemically stained micrographs of skin grafts treated by HHP at 200 MPa for 10 min or 50 MPa for 36 h in implantation. Magnification 10×, scale bar 100 μm, (*) indicates granulation tissue. The higher-magnification micrographs in the lower right show more detail concerning each positively stained cell (brown signal); scale bar 100 μm. (d) The diagram comparing the increase in numbers of infiltrated dermal macrophages at 4 weeks after implantation in both groups (n = 6, p < 0.0001) while the number is significantly higher in the grafts of the 50 MPa group than that in the 200 MPa group (p < 0.0001).
Figure 8
Figure 8
Newly formed capillaries of inactivated dermis in implantation. (a) Representative anti-CD31 immunohistochemically stained micrographs of skin grafts treated by HHP at 200 MPa for 10 min or 50 MPa for 36 h after implantation. New capillaries were formed in both groups from week 1 and then increased in size and number by 4 weeks after implantation. Magnification 10×, scale bar 100 μm, filled black triangle : newly formed capillary. (b) The diagram comparing the number of newly capillary formations shows elevated values in both groups after 4 weeks, although only to a significant degree in the 50 MPa group (n = 6, p < 0.01). Similarly, after 4 weeks, the area of newly formed capillaries had increased as well but only to a significant degree in the 50 MP group (p < 0.05).

References

    1. Aertsen A, Meersman F, Hendrickx ME, Vogel RF, Michiels CW. Biotechnology under high pressure: Applications and implications. Trends Biotechnol. 2009;27:434–441. doi: 10.1016/j.tibtech.2009.04.001. - DOI - PubMed
    1. Rivalain N, Roquain J, Demazeau G. Development of high hydrostatic pressure in biosciences: Pressure effect on biological structures and potential applications in biotechnologies. Biotechnol. Adv. 2010;28:659–672. doi: 10.1016/j.biotechadv.2010.04.001. - DOI - PubMed
    1. Hiemer B, et al. Devitalisation of human cartilage by high hydrostatic pressure treatment: Subsequent cultivation of chondrocytes and mesenchymal stem cells on the devitalised tissue. Sci. Rep. 2016;6:33747. doi: 10.1038/srep33747. - DOI - PMC - PubMed
    1. Wilson SL, Sidney LE, Dunphy SE, Rose JB, Hopkinson A. Keeping an eye on decellularized corneas: A review of methods, characterization and applications. J. Funct. Biomater. 2013;4:114–161. doi: 10.3390/jfb4030114. - DOI - PMC - PubMed
    1. Mahara A, Morimoto N, Sakuma T, Fujisato T, Yamaoka T. Complete cell killing by applying high hydrostatic pressure for acellular vascular graft preparation. Biomed. Res. Int. 2014;2014:379607. doi: 10.1155/2014/379607. - DOI - PMC - PubMed

Publication types