. 2020 Oct 19;10(1):17689.
doi: 10.1038/s41598-020-74811-5.

Quantifying the distribution of protein oligomerization degree reflects cellular information capacity

Affiliations

Quantifying the distribution of protein oligomerization degree reflects cellular information capacity

Lena Danielli et al. Sci Rep. .

Erratum in

Abstract

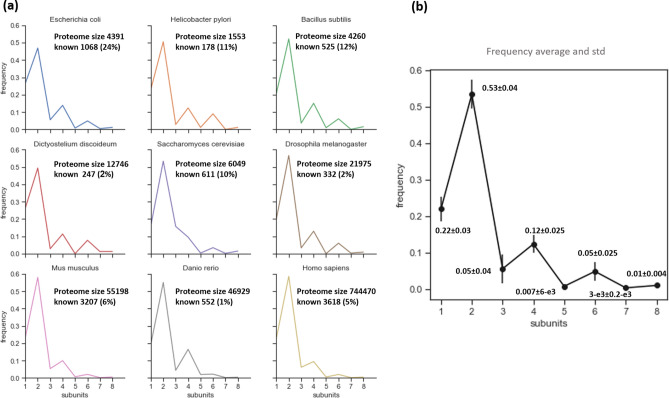
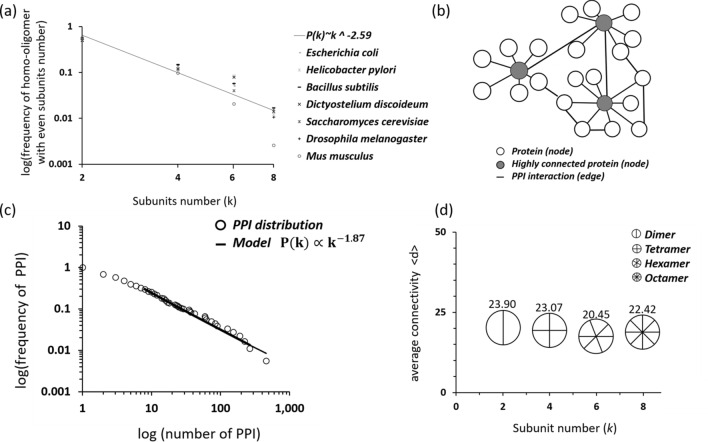
The generation of information, energy and biomass in living cells involves integrated processes that optimally evolve into complex and robust cellular networks. Protein homo-oligomerization, which is correlated with cooperativity in biology, is one means of scaling the complexity of protein networks. It can play critical roles in determining the sensitivity of genetic regulatory circuits and metabolic pathways. Therefore, understanding the roles of oligomerization may lead to new approaches of probing biological functions. Here, we analyzed the frequency of protein oligomerization degree in the cell proteome of nine different organisms, and then, we asked whether there are design trade-offs between protein oligomerization, information precision and energy costs of protein synthesis. Our results indicate that there is an upper limit for the degree of protein oligomerization, possibly because of the trade-off between cellular resource limitations and the information precision involved in biochemical reaction networks. These findings can explain the principles of cellular architecture design and provide a quantitative tool to scale synthetic biological systems.


Conflict of interest statement

The authors declare no competing interests.

Figures

Figure 1
Figure 1
Homo-oligomer frequency in the proteome. (a) Homo-oligomer frequency in nine organisms: E. coli, H. pylori, B. subtilis, D. discoideum, S. cerevisiae, D. melanogaster, M. musculus, D. rerio and H. sapiens. The frequency was calculated based on the UniProt Knowledgebase proteomes. Proteome size and the number of known proteins with homo-oligomeric structure are listed for the nine organisms. (b) Average homo-oligomer frequency and standard deviation (std) for the nine organisms.
Figure 2
Figure 2
Protein subunit distribution for different GO classifications in E. coli. (a) Molecular function. (b) Cellular components such as membrane and cell compartment. (c) Different cell parts, such as intrinsic components of the membrane, periplasmic space, plasma membrane and cytosol. (e) Biological processes such as metabolic process, cellular process, response to stimulus, localization, biological regulation and cellular component organization. (e) Metabolic process, such as those involving nitrogen compounds, and catabolic, biosynthetic and oxidation–reduction processes. In addition, the protein subunit distribution for GO classes was calculated for B. subtilis, S. cerevisiae and M. musculus (see Supplementary Fig. S2). The conclusions are similar to those previously described for E. coli.
Figure 3
Figure 3
Protein–protein interactions. (a) The average probability of observing a protein with k subunits P(k) in homo-oligomers with an even number of subunits was fitted by a power law (n = 4, P(k) ~ k−2.59, R2 = 0.9, p = 0.003). (b) Graphic presentation of a free-scale power law network. The network is built of nodes, i.e., proteins, which are connected through undirected edges, which are functional interactions. White and gray circles represent proteins, and highly connected proteins are colored gray. Black lines represent interactions. (c) PPI networks followed a power law distribution of the form P(k) ∝ k−1.87 (n = 2875, p = 0.62, kmin = 8), where the p value corresponds to the Kolmogorov–Smirnov, kmin is the lower cut-off for the power law and γ = 1.87 (as expected, in the range 2 < γ < 3). (d) The average node degree <d> of even homo-oligomers with respect to protein subunit number.
Figure 4
Figure 4
Biochemical binding reactions. (a) Schematic presentation of an enzyme that contains three identical subunits, and each subunit contains a ligand-binding site. The reaction between a small molecule and the enzyme can be represented by 8 (23) statistical arrangements. (b) Schematic presentation of a DNA-binding dimer. The binding reaction can be represented by 4 (22) statistical arrangements. (c) The precision of the biochemical reaction. An ultrasensitive response indicates that a small change in stimulus causes a large change in response and produces a sigmoidal dose–response curve (black line). An ultrasensitive response is described by the Hill equation when the Hill coefficient is n > 1. The red line represents the Michaelis–Menten equation when the Hill coefficient is n = 1. The Hill equation H = sn/(sn + Kd), where s is the unbound protein concentration, Kd is the dissociation constant and n is the coefficient that measures “ultrasensitivity” or cooperativity of the biochemical reactions. The black curve represents a reaction that requires a lower molecule concentration, from low to high, than is indicated by the red curve to activate the biochemical reaction.
Figure 5
Figure 5
Homo-oligomer distribution model. (a) Fitting of protein with an even number of subunits to a homo-oligomer distribution (fs = N/NT) using the resource-precision model (fs ∝ k/2k), where N is the number of proteins with k identical subunits and NT is the total number of proteins found in an organism. (b) Fitting of the biological information capacity (c(k)) by the capacity model c(k) = fs × k, where fs is the homo-oligomer distribution (fs = N/NT) and k = log2(M) is the bit number (M = 2k is the signal level). (c) Fitting of the protein with an even number of subunits to a homo-oligomer distribution (fs = N/NT) in biological pathways, as determined by resource precision. Several monomers and proteins involved in these pathways but with unknown degrees of oligomerization were neglected. (d) Biological information capacity of the pathways.

References

    1. De Las Rivas J, Fontanillo C. Protein-protein interaction networks: Unraveling the wiring of molecular machines within the cell. Brief. Funct. Genom. 2012;11:489–496. - PubMed
    1. Costa LDF, Rodrigues FA, Cristino AS. Complex networks: The key to systems biology. Genet. Mol. Biol. 2008;31:591–601.
    1. Albert R. Network inference, analysis, and modeling in systems biology. Plant Cell. 2007;19:3327–3338. - PMC - PubMed
    1. Przytycka TM, Singh M, Slonim DK. Toward the dynamic interactome: It's about time. Brief. Bioinform. 2010;11:15–29. - PMC - PubMed
    1. Watts DJ, Strogatz SH. Collective dynamics of ‘small-world’ networks. Nature. 1998;393:440–442. - PubMed

Publication types