

Optimizing whole-genomic prediction for autotetraploid blueberry breeding
- PMID: 33077896
- PMCID: PMC7784927
- DOI: 10.1038/s41437-020-00357-x
Optimizing whole-genomic prediction for autotetraploid blueberry breeding
Abstract
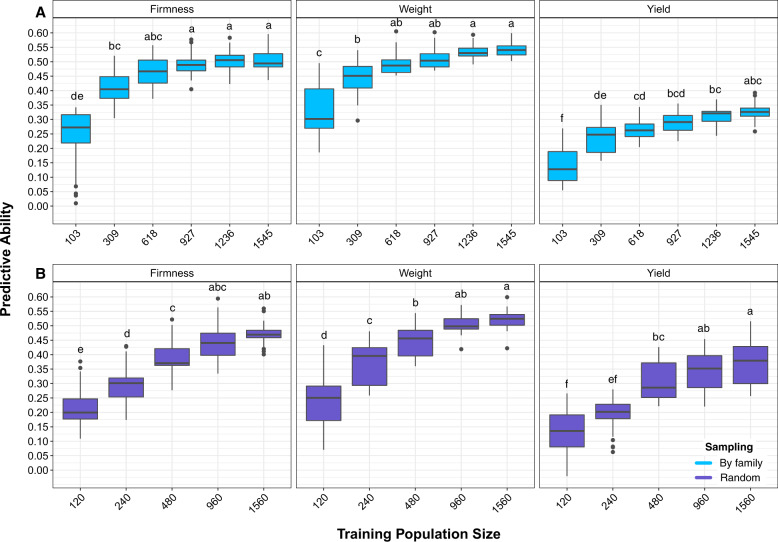
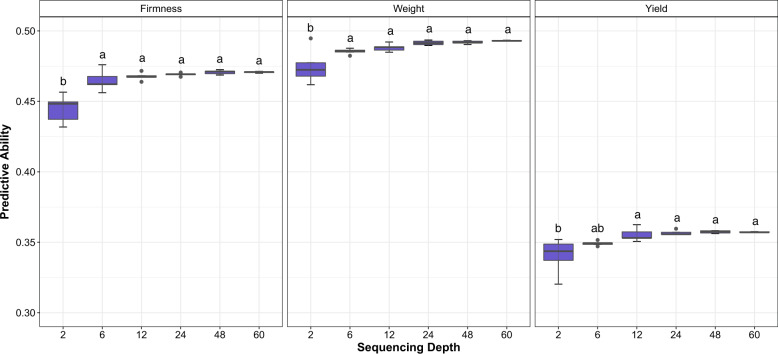
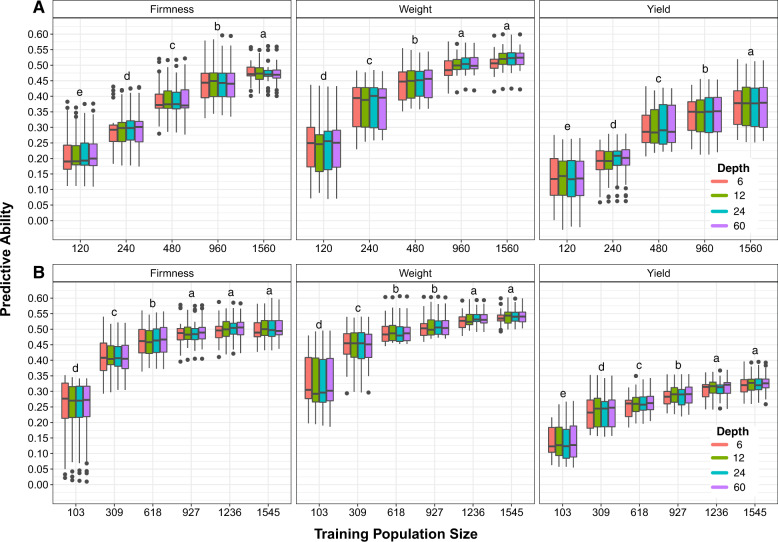
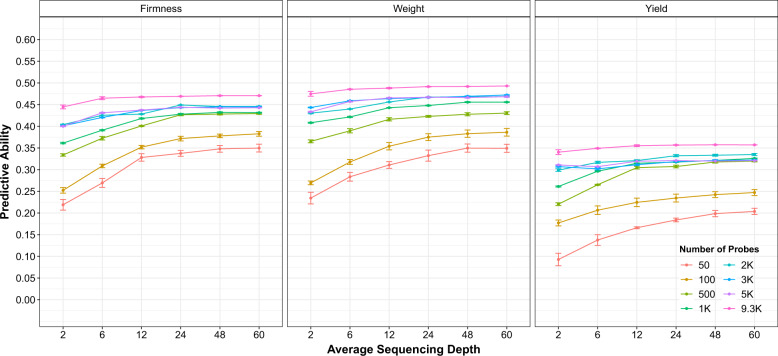
Blueberry (Vaccinium spp.) is an important autopolyploid crop with significant benefits for human health. Apart from its genetic complexity, the feasibility of genomic prediction has been proven for blueberry, enabling a reduction in the breeding cycle time and increasing genetic gain. However, as for other polyploid crops, sequencing costs still hinder the implementation of genome-based breeding methods for blueberry. This motivated us to evaluate the effect of training population sizes and composition, as well as the impact of marker density and sequencing depth on phenotype prediction for the species. For this, data from a large real breeding population of 1804 individuals were used. Genotypic data from 86,930 markers and three traits with different genetic architecture (fruit firmness, fruit weight, and total yield) were evaluated. Herein, we suggested that marker density, sequencing depth, and training population size can be substantially reduced with no significant impact on model accuracy. Our results can help guide decisions toward resource allocation (e.g., genotyping and phenotyping) in order to maximize prediction accuracy. These findings have the potential to allow for a faster and more accurate release of varieties with a substantial reduction of resources for the application of genomic prediction in blueberry. We anticipate that the benefits and pipeline described in our study can be applied to optimize genomic prediction for other diploid and polyploid species.
Conflict of interest statement
The authors declare that they have no conflict of interest.
Figures


References
-
- Abed A, Pérez-Rodríguez P, Crossa J, Belzile F. When less can be better: how can we make genomic selection more cost-effective and accurate in barley? Theor Appl Genet. 2018;131:1873–1890. - PubMed
-
- Altschul SF, Gish W, Miller W, Myers EW, Lipman DJ. Basic local alignment search tool. J Mol Biol. 1990;215:403–410. - PubMed
-
- Amadeu RR, Cellon C, Olmstead J, Garcia AAF, Resende MFR, Munoz PR. AGHmatrix: R package to construct relationship matrices for autotetraploid and diploid species: a blueberry example. Plant Genome. 2016;9:1–10. - PubMed
-
- Amadeu RR, Ferrão LFV, de Bem Oliveira I, Benevenuto J, Endelman JB, Munoz PR. Impact of dominance effects on autotetraploid genomic prediction. Crop Sci. 2019;60:656–665.
-
- Arruda MP, Brown PJ, Lipka AE, Krill AM, Thurber C, Kolb FL. Genomic selection for predicting Fusarium head blight resistance in a wheat breeding program. Plant Genome. 2015;8:1–12. - PubMed
Publication types
MeSH terms
LinkOut - more resources
Full Text Sources
Miscellaneous
