. 2021 Apr;5(4):309-323.
doi: 10.1038/s41551-020-00614-8. Epub 2020 Oct 19.

Identification of psychiatric disorder subtypes from functional connectivity patterns in resting-state electroencephalography

Affiliations

Identification of psychiatric disorder subtypes from functional connectivity patterns in resting-state electroencephalography

Yu Zhang et al. Nat Biomed Eng. 2021 Apr.

Abstract

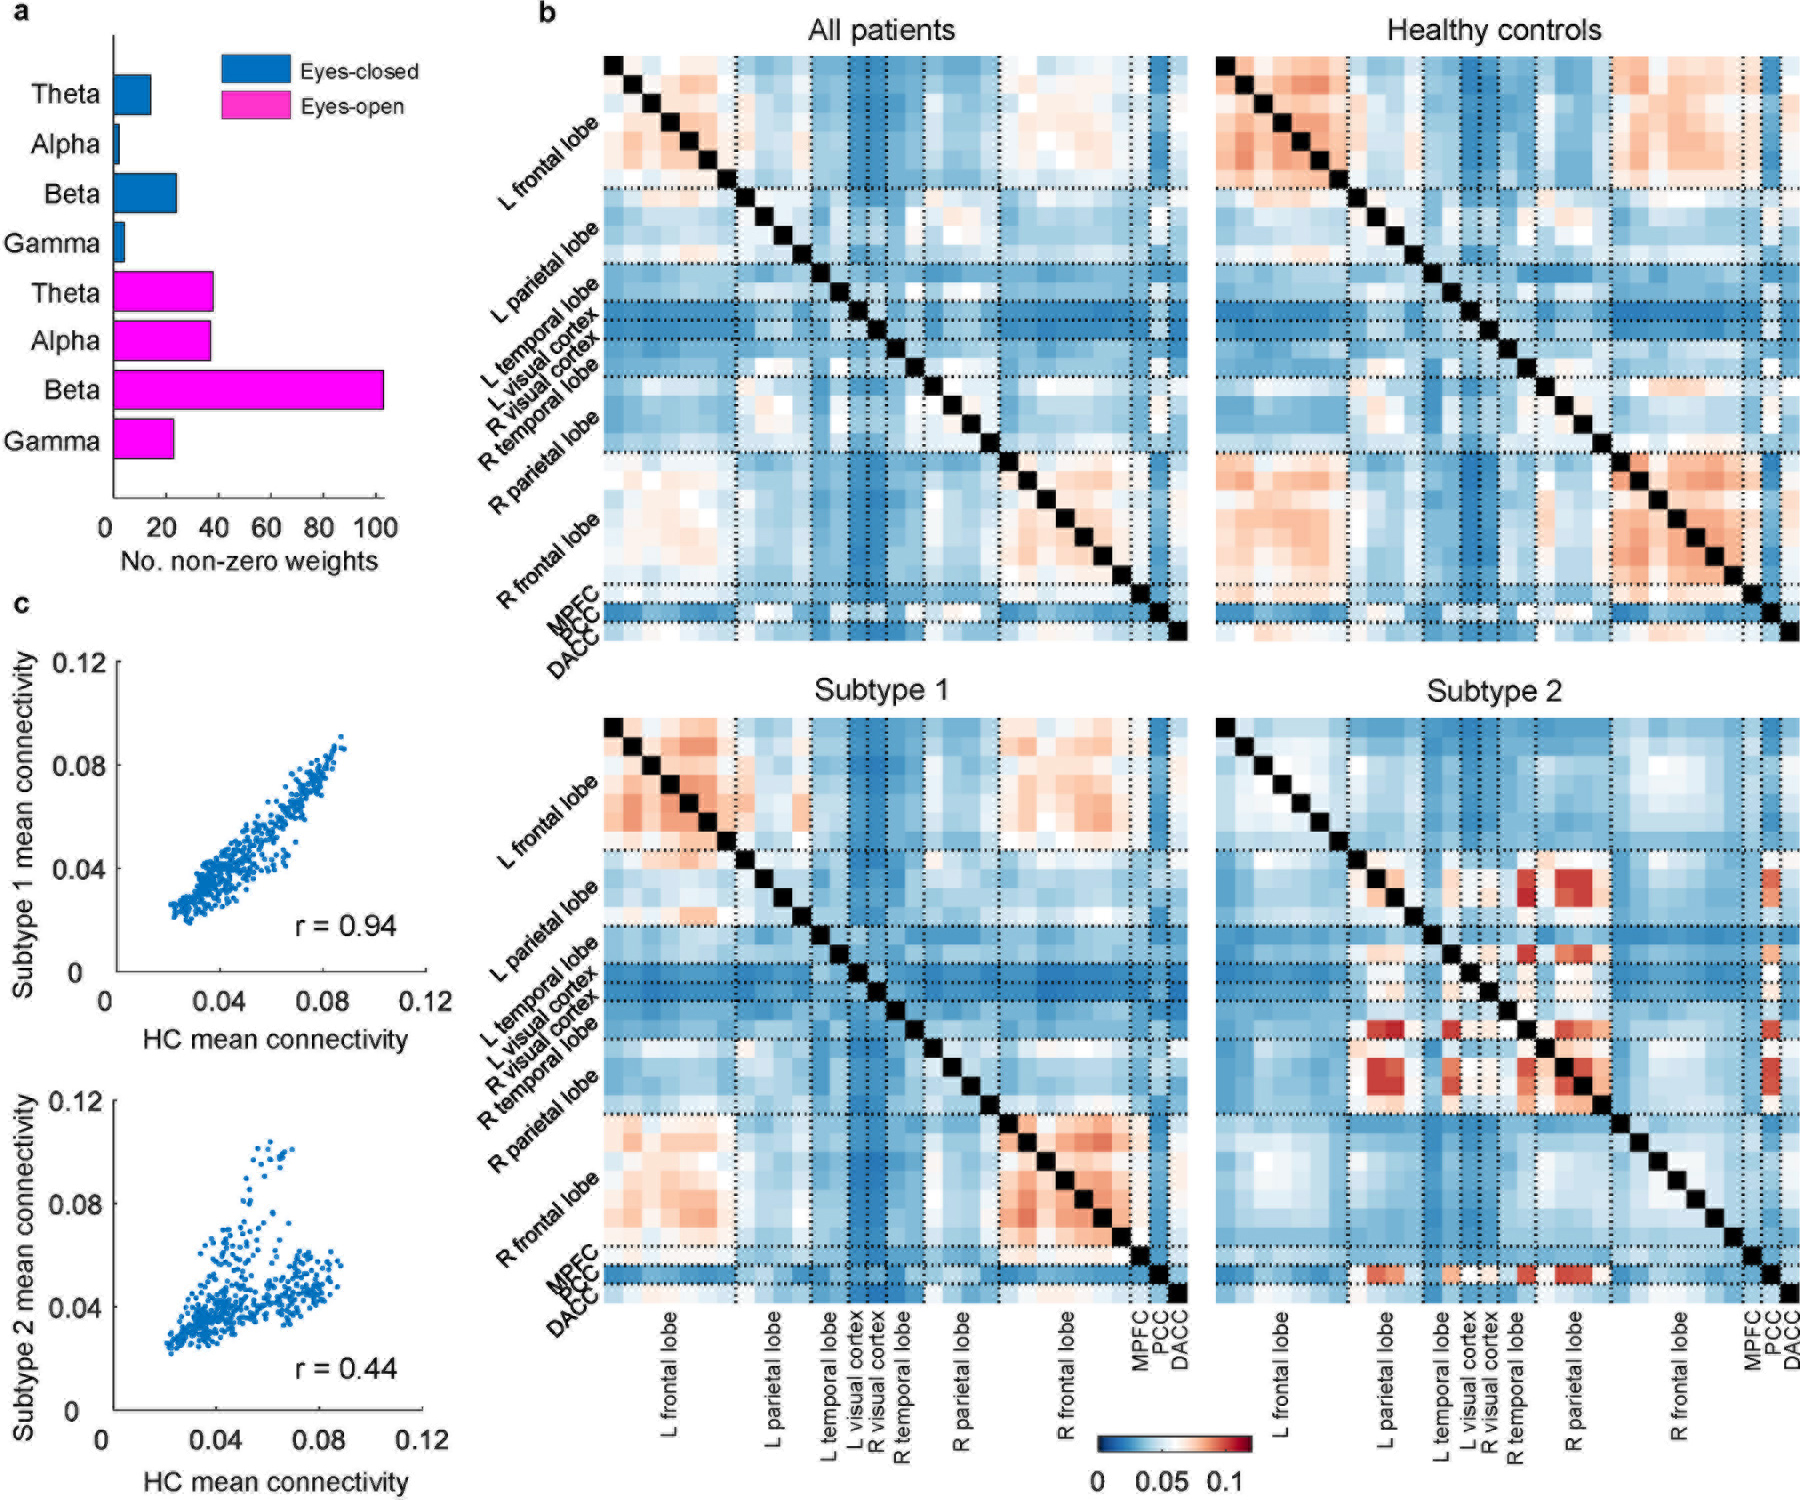
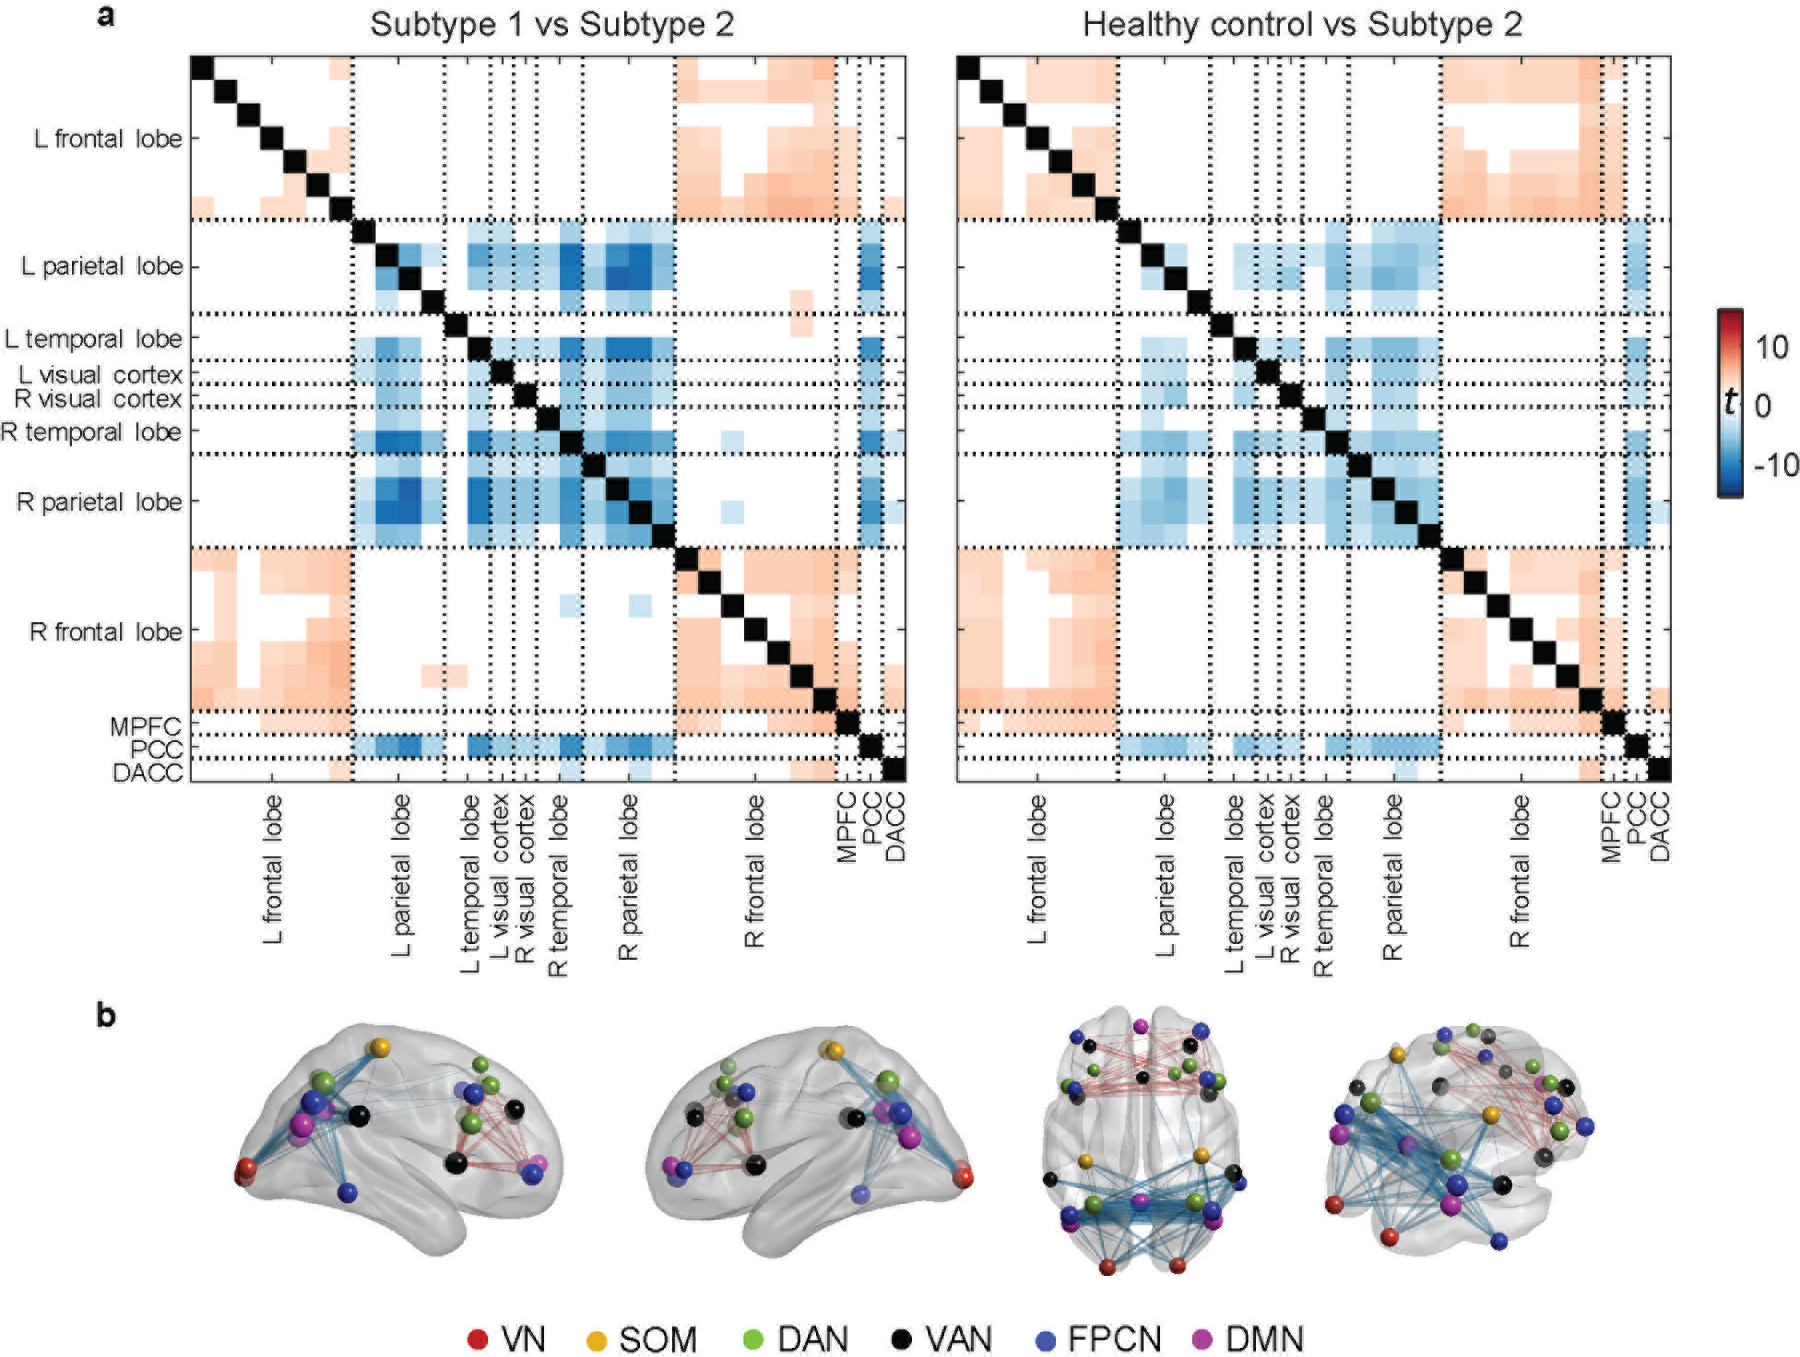
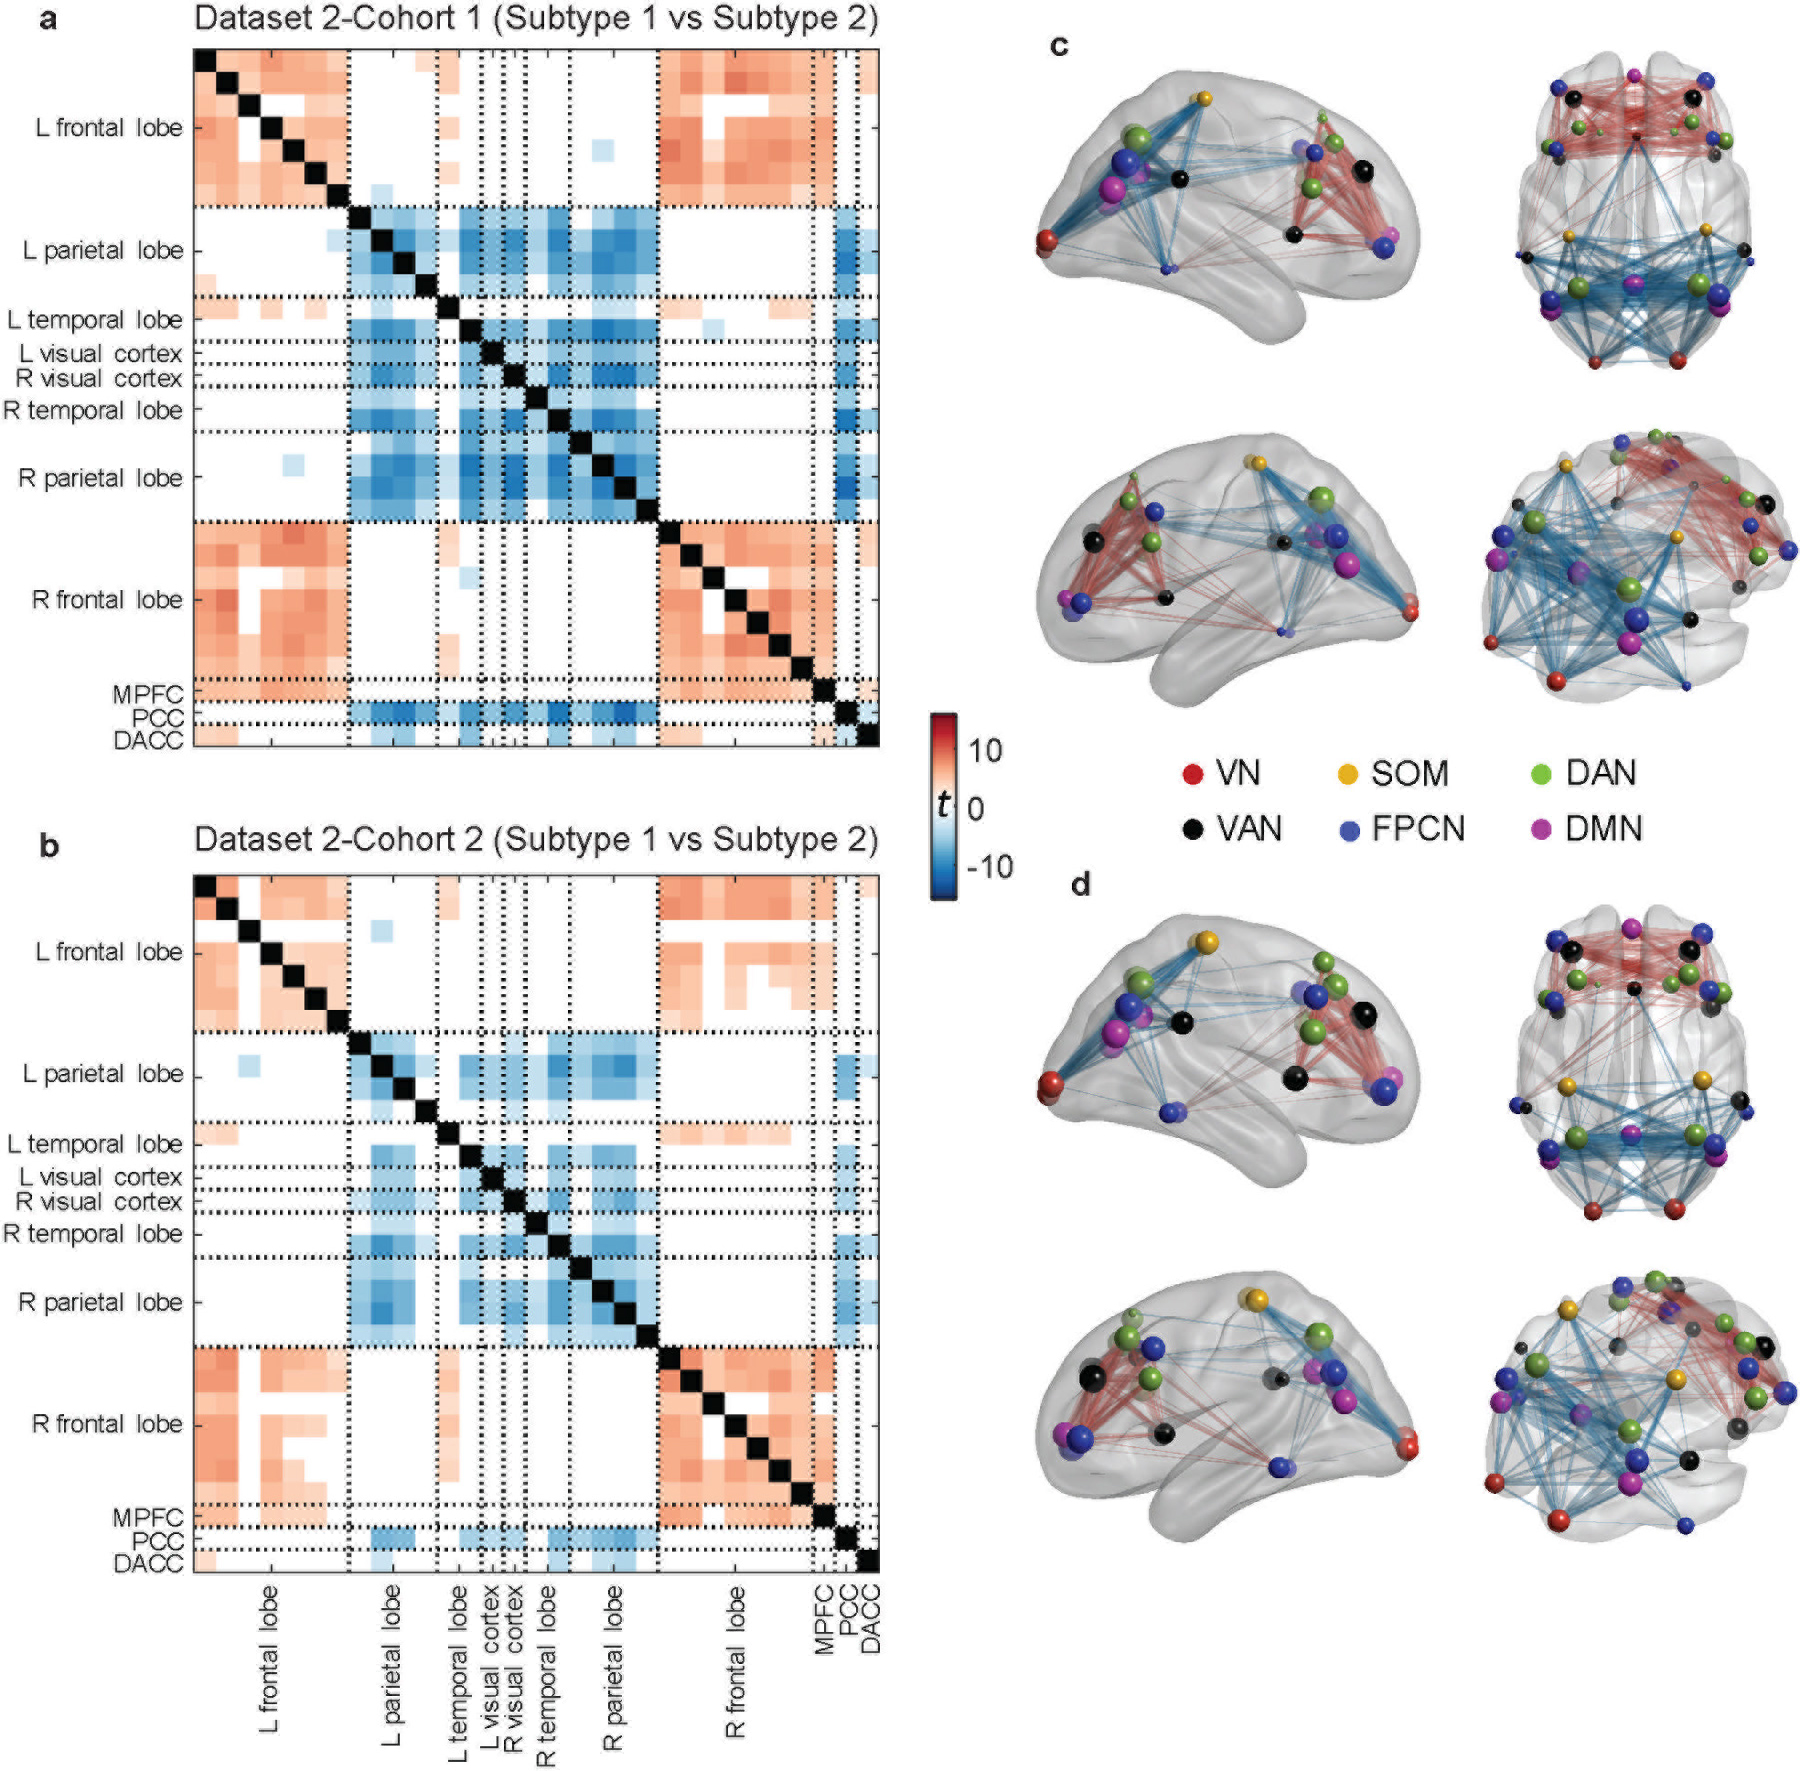
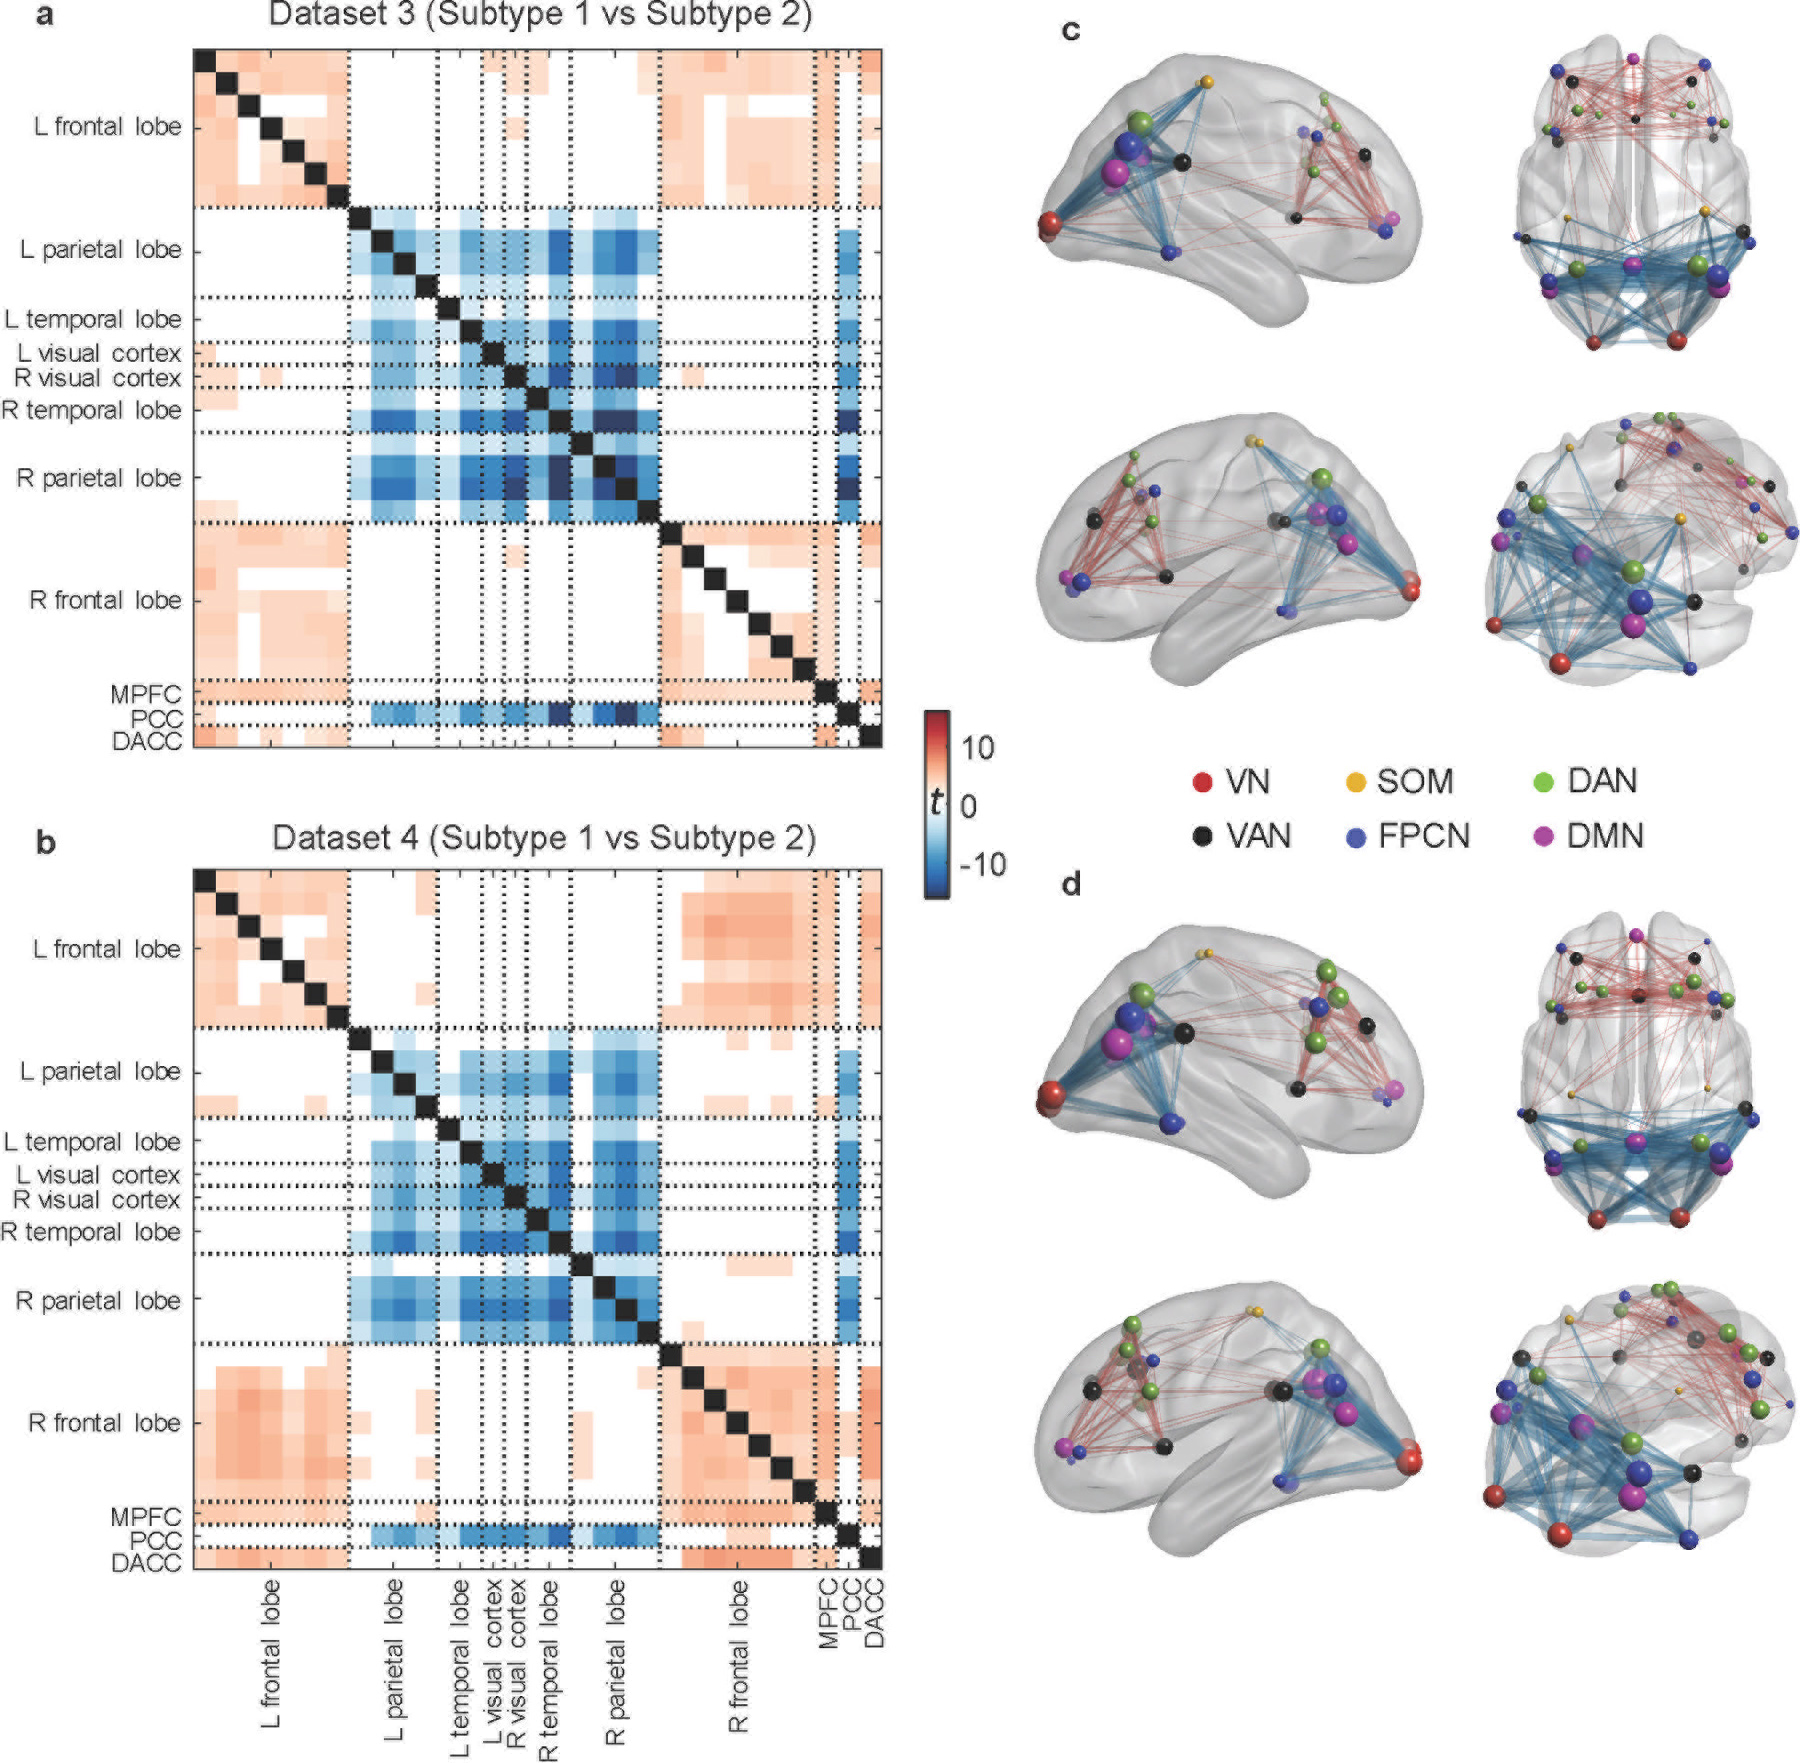
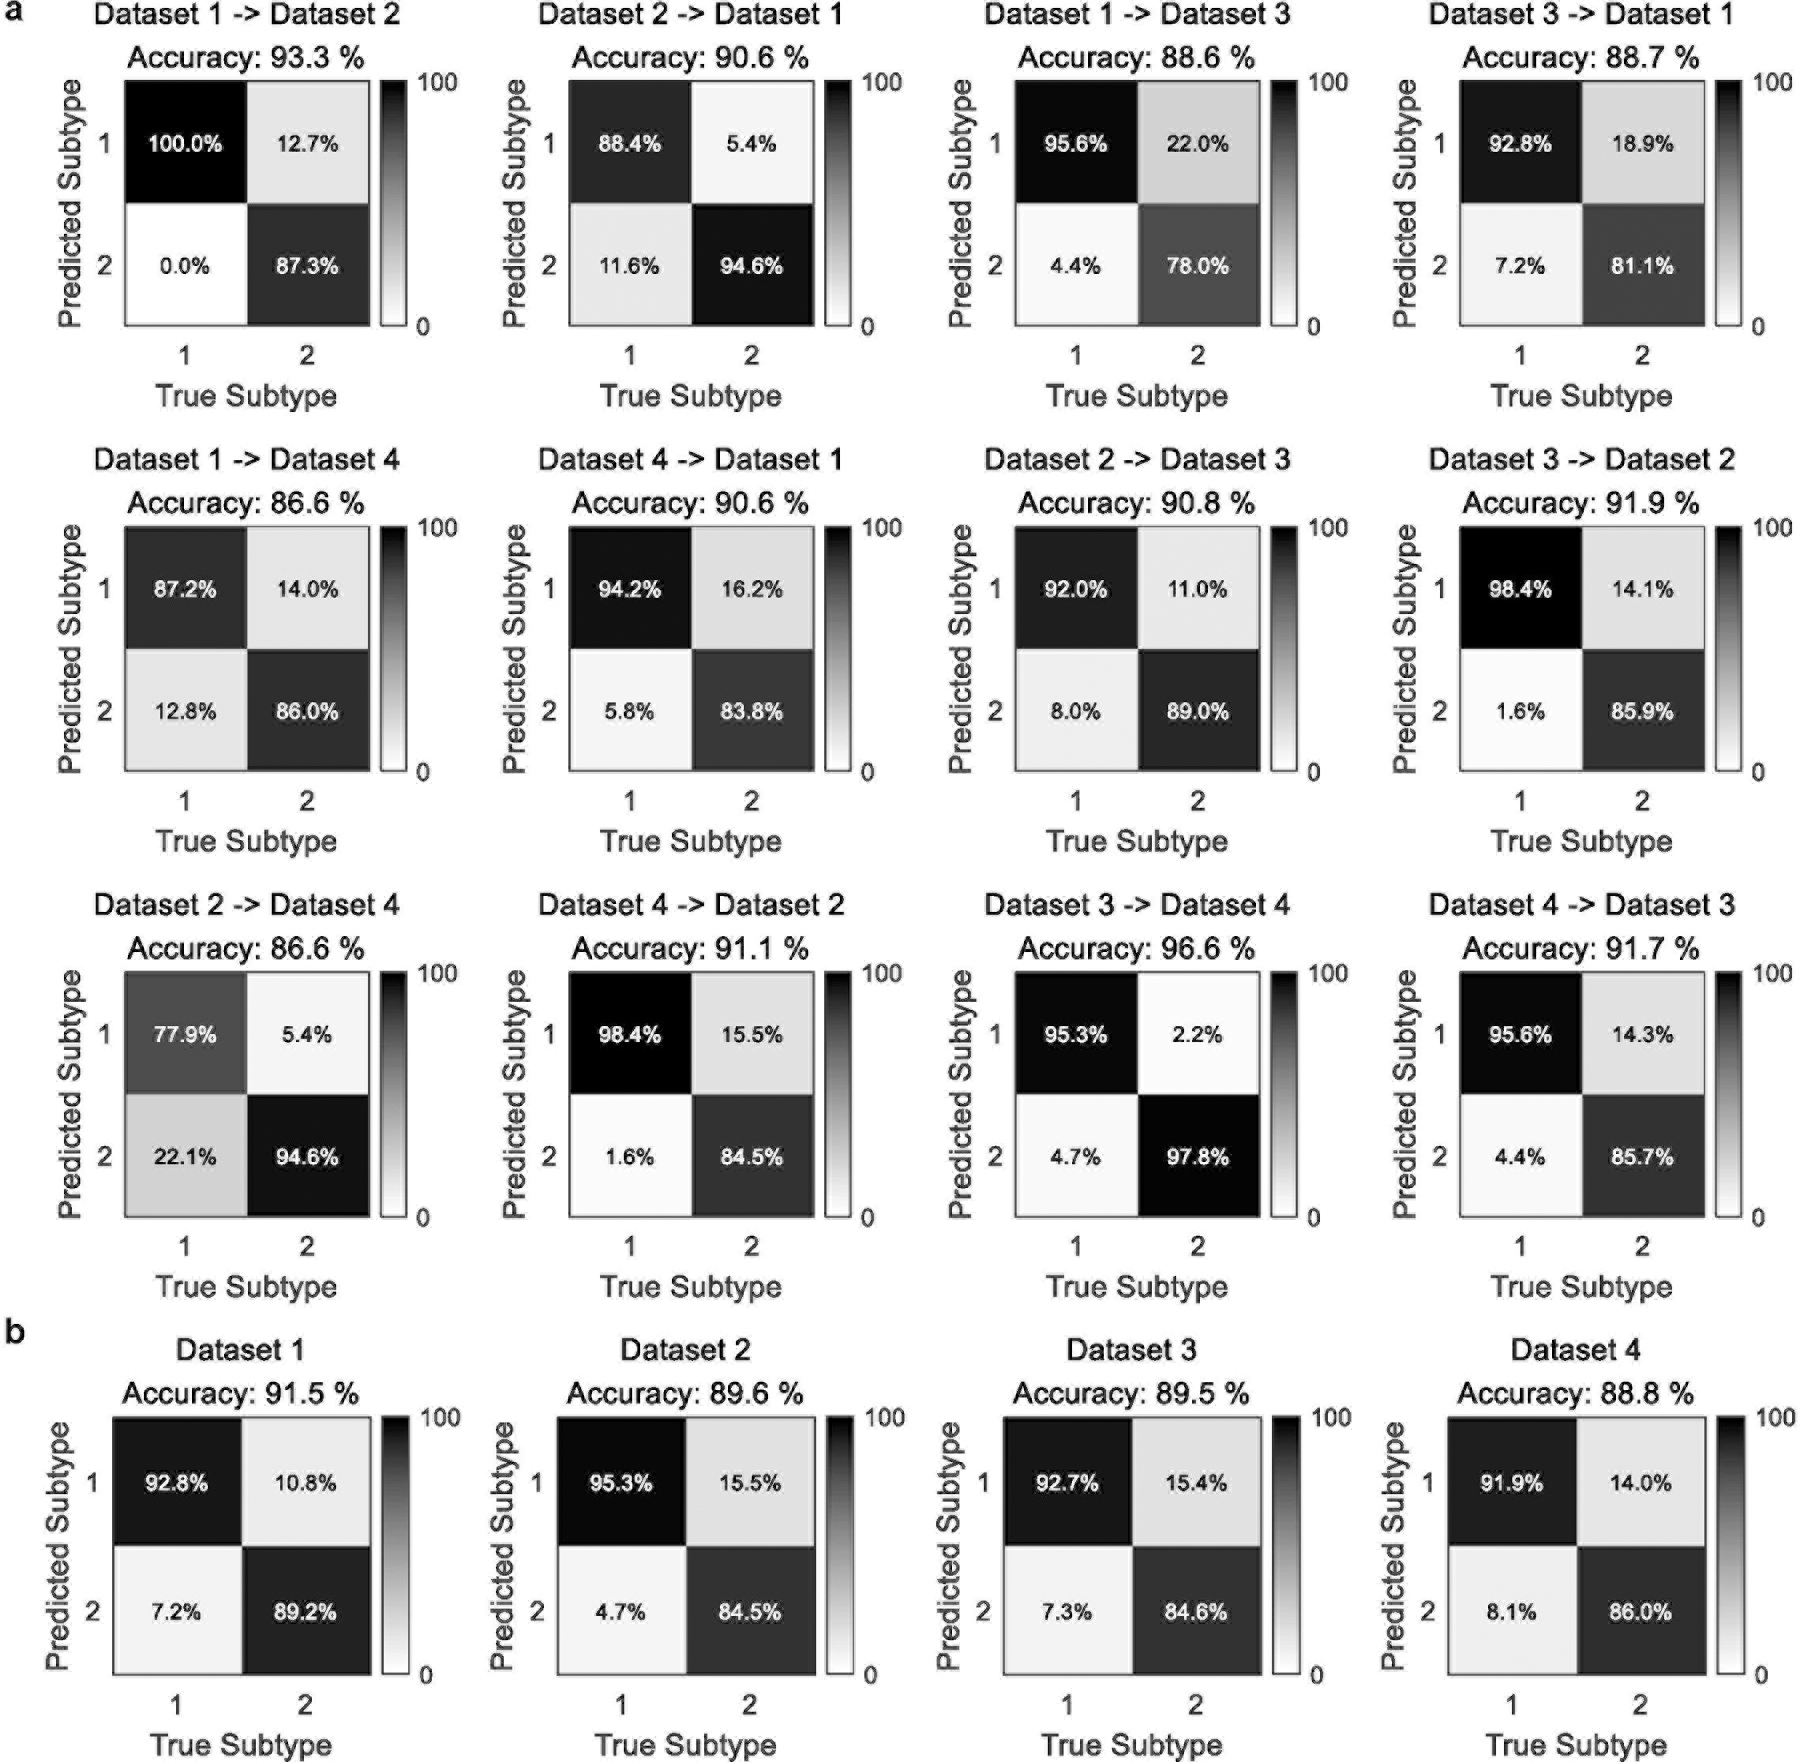
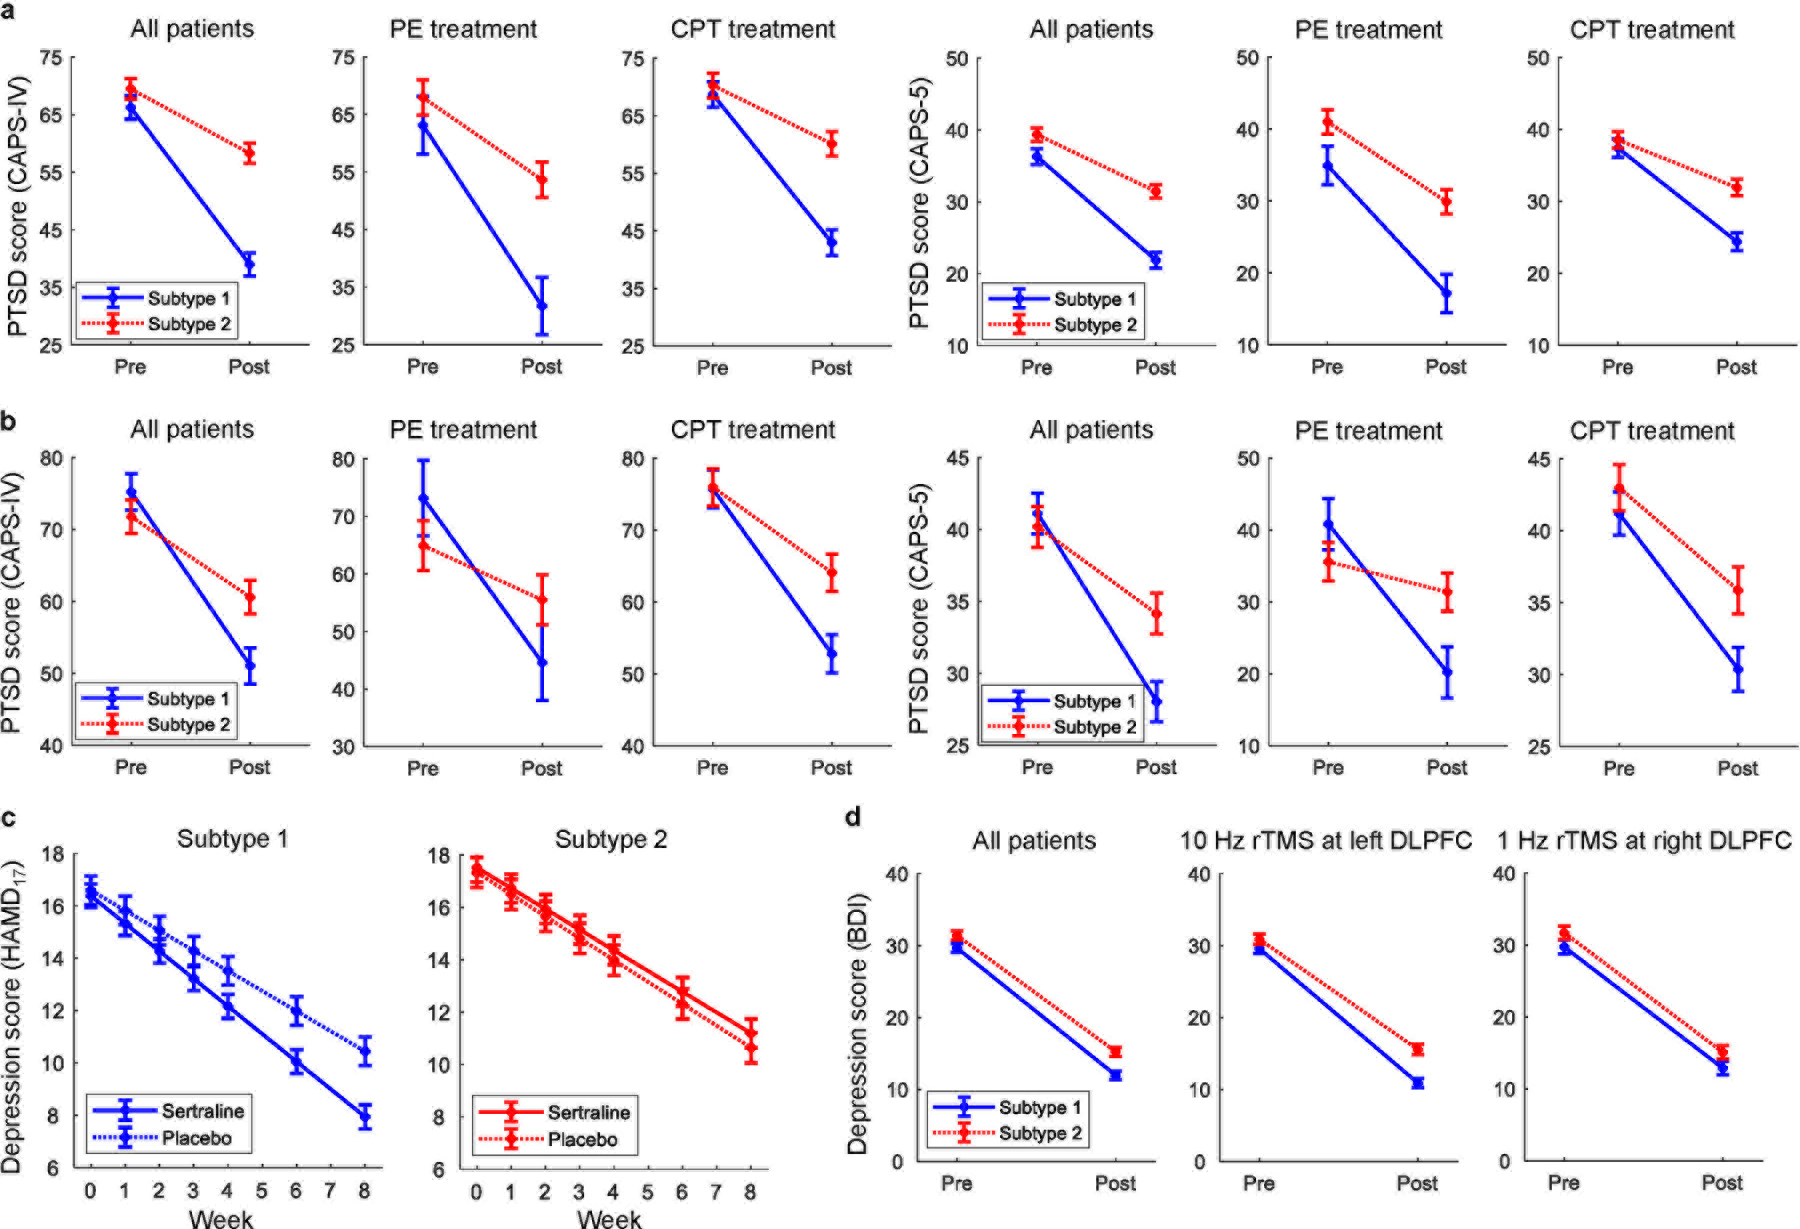
The understanding and treatment of psychiatric disorders, which are known to be neurobiologically and clinically heterogeneous, could benefit from the data-driven identification of disease subtypes. Here, we report the identification of two clinically relevant subtypes of post-traumatic stress disorder (PTSD) and major depressive disorder (MDD) on the basis of robust and distinct functional connectivity patterns, prominently within the frontoparietal control network and the default mode network. We identified the disease subtypes by analysing, via unsupervised and supervised machine learning, the power-envelope-based connectivity of signals reconstructed from high-density resting-state electroencephalography in four datasets of patients with PTSD and MDD, and show that the subtypes are transferable across independent datasets recorded under different conditions. The subtype whose functional connectivity differed most from those of healthy controls was less responsive to psychotherapy treatment for PTSD and failed to respond to an antidepressant medication for MDD. By contrast, both subtypes responded equally well to two different forms of repetitive transcranial magnetic stimulation therapy for MDD. Our data-driven approach may constitute a generalizable solution for connectome-based diagnosis.


Conflict of interest statement

Competing interests

AE receives equity and salary from Alto Neuroscience, along with equity from Mindstrong Health, Akili Interactive and Sizung. WW and JG receive equity and salary from Alto Neuroscience. CRM receives equity from Receptor Life Sciences and consulting income from Otsuka Pharmaceuticals.

Figures

Fig. 1 |
Fig. 1 |. Resting-state EEG power-envelope connectivity (PEC) biomarkers define two subtypes in the discovery PTSD dataset.
PEC was calculated across pairs of 31 regions of interest (ROIs), separately for four frequency bands (theta, alpha, beta, and gamma), as well as two resting conditions (eyes-open and eyes-closed). a, Number of non-zero feature weights for different conditions as a result of sparse clustering. Each feature weight corresponds to a PEC feature. Selected features are primarily from the beta frequency band and eyes-open condition. b, Mean connectivity matrices of all patients, healthy controls (HC), and two subtypes for the beta band eyes-open condition. The error bar indicates mean connectivity values. c, Correlation of mean connectivity between HC and subtype 1, and between HC and subtype 2, respectively. Each dot corresponds to the PEC between two ROIs. The scatterplots show that the mean connectivity patterns are highly similar between HC and subtype 1, but less so between HC and subtype 2.
Fig. 2 |
Fig. 2 |. PEC difference between the two subtypes.
a, Connectivity difference matrices for the beta band eyes-open condition between the two subtypes and between healthy controls and subtype 2, assessed in a two-sample t-test (showing t-values with FDR corrected p<0.05). b, Visualization of connectivity difference (subtype 1 vs. subtype 2) patterns on the brain. The size of the sphere at each ROI represents the average t-value across all PEC features from that ROI to all others. Each edge represents the connectivity difference strength between two ROIs. VN = visual network, SOM = sensorimotor network, DAN = dorsal attention network, VAN = ventral attention network, FPCN = fronto-parietal control network, DMN = default-mode network.
Fig. 3 |
Fig. 3 |. Replication of the identified PEC subtypes in the two cohorts within dataset 2 (PTSD replication).
For each cohort, connectivity difference was assessed in a two-sample t-test with subtype 1 versus subtype 2 (showing t-values with FDR corrected p<0.05). a, Connectivity difference matrix obtained from the first cohort. b, Connectivity different matrix obtained from the second cohort. cd, Visualization of connectivity difference patterns on the brain for the first and the second cohorts, respectively. For both cohorts in dataset 2, two subtypes were found with highly similar patterns of functional connectivity differences to those in the discovery dataset. VN = visual network, SOM = sensorimotor network, DAN = dorsal attention network, VAN = ventral attention network, FPCN = fronto-parietal control network, DMN = default-mode network.
Fig. 4 |
Fig. 4 |. Replication of the identified PEC subtypes in the two MDD datasets.
For each dataset, connectivity difference was assessed in a two-sample t-test with subtype 1 versus subtype 2 (showing t-values with FDR corrected p<0.05). a, Connectivity difference matrix obtained from dataset 3. b, Connectivity matrix difference obtained from dataset 4. cd, Visualization of connectivity difference patterns on the brain for datasets 3 and 4, respectively. Two subtypes were discovered with distinct functional connectivity patterns that were consistent with those found in the two PTSD datasets. VN = visual network, SOM = sensorimotor network, DAN = dorsal attention network, VAN = ventral attention network, FPCN = fronto-parietal control network, DMN = default-mode network.
Fig. 5 |
Fig. 5 |. Validation of subtype transferability across independent datasets.
A cluster-centroid-based classifier was derived from the sparse clustering analysis from one dataset (using PEC features from beta band eyes open condition) and then applied to data from another independent dataset, resulting in predicted class labels. Classification accuracy was then calculated by comparing the predicted class labels with those obtained from the sparse clustering analysis on the second dataset. a, Training on one dataset and tested on one other. b, Training on three datasets and tested on the fourth.
Fig. 6 |
Fig. 6 |. Responsiveness of subtypes to treatment across diagnoses and treatment modalities.
a, Subtype 2 patients had worse outcomes to psychotherapy treatment in PTSD for the first cohort of dataset 2. b, Similarly, subtype 2 patients responded significantly worse than subtype 1 to psychotherapy treatment in PTSD in the second cohort of dataset 2. c, Subtype 2 patients failed to respond differentially to an antidepressant versus placebo in MDD (dataset 3), whereas for subtype 1 the antidepressant was superior to placebo. d, Both subtypes responded equally well to one of the two different rTMS treatment protocols in MDD (dataset 4). All error bars indicate the standard error of the mean.

References

    1. Kessler RC, et al. Lifetime prevalence and age-of-onset distributions of DSM-IV disorders in the National Comorbidity Survey Replication. Arch. Gen. Psychiatry 62, 593–602 (2005). - PubMed
    1. Belmaker R & Agam G Major depressive disorder. N. Engl. J. Med 358, 55–68 (2008). - PubMed
    1. Hawco C, et al. Separable and replicable neural strategies during social brain function in people with and without severe mental illness. Am. J. Psychiatry 176, 521–530 (2019). - PubMed
    1. Etkin A A reckoning and research agenda for neuroimaging in psychiatry. Am. J. Psychiatry 176, 507–511 (2019). - PubMed
    1. Etkin A Addressing the causality gap in human psychiatric neuroscience. JAMA Psychiatry 75, 3–4 (2018). - PubMed

Publication types

Substances