Meta-Analysis
. 2020 Dec;26(12):1941-1949.
doi: 10.1038/s41591-020-1076-0. Epub 2020 Oct 19.

Discovery and validation of a personalized risk predictor for incident tuberculosis in low transmission settings

Affiliations
Meta-Analysis

Discovery and validation of a personalized risk predictor for incident tuberculosis in low transmission settings

Rishi K Gupta et al. Nat Med. 2020 Dec.

Abstract

The risk of tuberculosis (TB) is variable among individuals with latent Mycobacterium tuberculosis infection (LTBI), but validated estimates of personalized risk are lacking. In pooled data from 18 systematically identified cohort studies from 20 countries, including 80,468 individuals tested for LTBI, 5-year cumulative incident TB risk among people with untreated LTBI was 15.6% (95% confidence interval (CI), 8.0-29.2%) among child contacts, 4.8% (95% CI, 3.0-7.7%) among adult contacts, 5.0% (95% CI, 1.6-14.5%) among migrants and 4.8% (95% CI, 1.5-14.3%) among immunocompromised groups. We confirmed highly variable estimates within risk groups, necessitating an individualized approach to risk stratification. Therefore, we developed a personalized risk predictor for incident TB (PERISKOPE-TB) that combines a quantitative measure of T cell sensitization and clinical covariates. Internal-external cross-validation of the model demonstrated a random effects meta-analysis C-statistic of 0.88 (95% CI, 0.82-0.93) for incident TB. In decision curve analysis, the model demonstrated clinical utility for targeting preventative treatment, compared to treating all, or no, people with LTBI. We challenge the current crude approach to TB risk estimation among people with LTBI in favor of our evidence-based and patient-centered method, in settings aiming for pre-elimination worldwide.


Conflict of interest statement

Competing interests

J.S.D.’s institution receives investigator-initiated research grants and consultancy income from Gilead Sciences, AbbVie, Bristol Myers Squibb and Merck. The Burnet Institute receives funding from the Victorian Government Operational Infrastructure Fund. C.L. reports honoraria from Chiesi, Gilead, Insmed, Janssen, Lucane, Novartis, Oxoid, Berlin Chemie (for participation at sponsored symposia) and Oxford Immunotec (to attend a scientific advisory board meeting), all outside of the submitted work. M.S. reports receipt of test kits free of charge from Qiagen and from Oxford Immunotec for investigator-initiated research projects. I.A. reports receiving test kits free of charge from Qiagen for an investigator-initiated research project. C.E. reports receiving test kits free of charge from Qiagen for investigator-initiated research projects outside of the submitted work. The authors declare no other conflicts of interest.

Figures

Extended Data Fig. 1
Extended Data Fig. 1. Flow chart outlining systematic review process.
The systematic search strategy and eligibility criteria are shown in Supplementary Tables 8 and 9.
Extended Data Fig. 2
Extended Data Fig. 2. Flow chart showing inclusion of participants in the population-level and prediction modelling analyses.
The systematic search strategy and eligibility criteria are shown in Supplementary Tables 8 and 9.
Extended Data Fig. 3
Extended Data Fig. 3. Cumulative risk of prevalent and incident tuberculosis during follow-up.
Risk is stratified by binary latent TB test result, provision of preventative treatment, and indication for screening among participants with untreated latent infection (total n = 80,468 participants). Cumulative risk is estimated using flexible parametric survival models with random effects for the intercept by source study, separately fitted to each risk group. Prevalent TB cases (diagnosed within 42 days of recruitment) are included in this sensitivity analysis. Each plot is presented as point estimates (solid line) and 95% confidence intervals (shaded area). PT = preventative treatment.
Extended Data Fig. 4
Extended Data Fig. 4. Pooled TB incidence rates among adults, stratified by risk group.
Pooled incidence rates are shown on log10 scale among participants with: latent TB infection (LTBI) with no preventative therapy (PT); LTBI commencing PT; and without evidence of LTBI. Rates are further stratified by follow-up interval (0–2 years vs. 2–5 years) and indication for screening (total n = 52,576 participants). Pooled incidence rate estimates were derived from random intercept Poisson regression models, without continuity correction for studies with zero events. Numeric results are shown for the subgroups with untreated latent TB infection in the forest plots in Extended Data Fig. 5. Plots show point estimates (filled circles) and 95% confidence intervals (vertical error bars). No pooled estimate could be calculated for child contacts without evidence of LTBI for the 2–5 year interval since there were no incident events.
Extended Data Fig. 5
Extended Data Fig. 5. Forest plots showing incidence rates by source study among participants with untreated LTBI.
Forest plots are stratified by follow-up interval (0–2 years vs. 2–5 years) and indication for screening (total n =52,576 participants). Pooled incidence rate estimates (shown as diamonds) were derived from random intercept Poisson regression models, without continuity correction for studies with zero events. Incidence rates per study are shown with a continuity correction of 0.5 for studies with zero events. Plots show study-level point estimates (grey squares) and 95% confidence intervals (CIs; horizontal error bars).
Extended Data Fig. 6
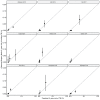
Extended Data Fig. 6. Calibration plots from internal-external validation of prediction model, stratified by validation study.
Data from nine primary validation studies are shown, from internal-external cross-validation of the model (developed among n = 31,090 participants; validated among 25,504 in this analysis). X-axis shows predicted risk, in quintiles, with corresponding Kaplan Meier 2-year risk of incident TB on the Y-axis (95% confidence intervals are shown by vertical error bars).
Extended Data Fig. 7
Extended Data Fig. 7. Model validation sensitivity analyses.
Forest plots showing recalculation of the C-statistics from internal-external cross validation, limiting validation sets to a, participants who did not receive preventative therapy (n = 23,060 participants); b, participants with a positive LTBI test (n = 9,063 participants); and c, binary LTBI test results (using an average quantitative positive or negative LTBI test result as appropriate, based on the medians among the study population; n = 25,504 participants). ‘TB’ column indicates number of incident TB cases within 2 years of study entry and ‘N’ indicates total participants per study included in analysis. Each forest plot shows point estimates (squares) and 95% confidence intervals (error bars). Pooled estimates are shown as diamonds. Panel d, shows decision curve analyses (n = 6,418 participants) when using the prediction model using a binary LTBI test result, compared to the full prediction model, ‘treat all’ and ‘treat none’ strategies across a range of threshold probabilities (x-axis). Net benefit appeared higher for the binary model than either the strategies of treating all patients with evidence of LTBI, or no patients, throughout the range of threshold probabilities. The full model had highest net benefit across most threshold probabilities.
Extended Data Fig. 8
Extended Data Fig. 8. Data supporting assumptions underlying PERISKOPE-TB model.
a, Quantitative results for the tuberculin skin test (TST), QuantiFERON Gold-in-tube (QFT-GIT) and T-SPOT.TB are normalised to a percentile scale using a head-to-head population among whom all three tests were performed from 3 studies including recent TB contacts, migrants and immunocompromised participants (n = 8,335; 158 TB cases). We examined the association between normalised test result and risk of incident TB using Cox proportional hazards models with restricted cubic splines. Normalised results for each test appeared to be associated with similar risk of incident TB. b, Kaplan Meier plots from pooled dataset showing cumulative risk of incident TB, stratified by proximity and infectiousness of index cases among contacts (n = 22,231 participants). There was no evidence of separation of risk of additional subgroups of the ‘other’ (non-smear positive household) contacts stratum. PTB = pulmonary TB; EPTB = extra-pulmonary TB. c, Kaplan Meier plots from pooled dataset showing cumulative risk of incident TB among people with positive latent TB tests, stratified by TB incidence in country of birth among migrants from high TB burden countries (n = 1,031 participants). P value represents Log-rank test. d, Kaplan Meier plots from pooled dataset showing cumulative risk of incident TB among people with positive latent TB tests, stratified by country of birth among recent contacts (n = 5,917 participants). P value represents Log-rank test.
Fig. 1
Fig. 1. Population-level cumulative risk of incident TB during follow-up.
Risk is stratified by binary latent TB test result, provision of preventative treatment (PT) and indication for screening among participants with untreated latent infection (total n=80,468 participants). Cumulative risk is estimated using flexible parametric survival models with random effects intercepts by source study, separately fitted to each risk group. Prevalent TB cases (diagnosed within 42 d of recruitment) are excluded. Each plot is presented as point estimates (solid line) and 95% CIs (shaded area). Child contacts are shown stratified by age (<5 years and 5-14 years). PT = preventative treatment. Numbers of participants, TB cases and numeric cumulative risk estimates for each plot are presented in Supplementary Table 5. Cumulative TB risk, including prevalent TB cases, is presented in Extended Data Fig. 3.
Fig. 2
Fig. 2. Visual representations of associations between predictors and incident TB.
Illustrative estimates are shown for a 33-year-old migrant from a high TB-burden setting. The example ‘base case’ patient does not commence preventative treatment, is not living with HIV, has not received a previous transplant and has an ‘average’ positive latent TB test. We vary one of these predictors in each plot ((a) age; (b) normalized latent TB test result; (c) years since migration; (d) exposure to M. tuberculosis; (e) HIV status; (f) transplant receipt; and (g) preventative treatment). Each plot is presented as point estimates (solid line) and 95% CIs (shaded area). The model was trained on a pooled data set (n = 31,090 participants). Model parameters are provided in Supplementary Table 6. ‘Household smear + contact’ = household contact of sputum smear-positive index case; ‘Other contact’ = contact of non-household or smear-negative index case; ‘Migrant’ = migrant from high TB incidence country, without recent contact.
Fig. 3
Fig. 3. Forest plots showing model discrimination and calibration metrics for predicting 2-year risk of incident TB.
Discrimination is presented as the C-statistic; calibration is presented as CITL and the calibration slope. Data from nine primary validation studies are shown, from IECV of the model (developed among n = 31,090 participants; validated among 25,504 participants in this analysis). ‘TB’ column indicates number of incident TB cases within 2 years of study entry, and ‘n’ indicates total participants per study included in analysis. Each forest plot shows point estimates (squares) and 95% CIs (error bars). Pooled estimates are shown as diamonds. Calibration slopes greater than 1 suggest under-fitting (predictions are not varied enough), whereas slopes less than 1 indicate over-fitting (predictions are too extreme). CITL indicates whether predictions are systematically too low (CITL>O) or too high (CITL<O). Dashed lines indicate line of no discrimination (C-statistic) and perfect calibration (CITL and slope), respectively.
Fig. 4
Fig. 4. Distribution of predictions and risk of incident TB in four quartiles of risk for people with positive latent TB tests.
Distribution of risk from prediction model using pooled validation sets of people not receiving preventative therapy from IECV of the model (n = 27,511 participants), stratified by (a) binary latent TB test result and (b) indication for screening among untreated people with positive LTBI tests. c, Kaplan-Meier plots for quartile risk groups (1 = lowest risk) of untreated individuals with positive LTBI tests (n = 6,418 participants). Quartiles represent four equally sized groups based on predicted risk of incident TB, from the pooled validation sets derived from IECV of the prediction model. P value represents log-rank test (P = 1.137 × 10-40). d, Randomly sampled individual patients from each risk quartile. Patient 1 is a 22-year-old with no TB exposure and a normalized latent TB test result on the 68th percentile; Patient 2 is a 41-year-old migrant from a high TB-burden country (3.8 years since migration) with normalized latent TB test result on the 80th percentile; Patient 3 is a 51-year-old household contact of a smear-positive index TB case with a normalized latent TB test result on the 79th percentile; and Patient 4 is a 33-year-old household contact of a smear-positive index TB case with a normalized latent TB test result on the 94th percentile. All four example patients are HIV negative and are not transplant recipients. Equivalent values of normalized percentile test results for QuantiFERON, T-SPOT.TB and TST are shown in Supplementary Table 10. Plots (c, d) are presented as point estimates (solid line) and 95% CIs (shaded area).
Fig. 5
Fig. 5. Decision curve analysis.
Shown as net benefit of the prediction model among untreated participants from the pooled validation sets with positive binary latent TB tests (n = 6,418 participants) compared to ‘treat all’ and ‘treat none’ strategies across a range of threshold probabilities (x axis). Net benefit quantifies the tradeoff between correctly identifying true-positive progressors to incident TB and incorrectly detecting false positives, with weighting of each by the threshold probability. The threshold probability corresponds to a measure of both the perceived risk:benefit ratio of initiating preventative treatment and the percentage cutoff for the prediction model, above which treatment is recommended. Net benefit appeared higher than either the strategies of treating all patients with evidence of LTBI or no patients, throughout the range of threshold probabilities, suggesting clinical utility. For illustration, a patient who is very concerned about developing TB disease but not concerned regarding side effects of preventative treatment might have a low threshold probability (for example, 1%, which is equivalent to a risk:benefit ratio of 1:99—that is, the outcome of developing TB is considered to be 99 times worse than taking unnecessary preventative treatment). In contrast, a patient who is less concerned about developing TB but is very concerned about side effects of preventative treatment might have a higher threshold probability (for example, 10%, which is equivalent to a risk:benefit ratio of 1:9). The unit of net benefit is ‘true positives’. For instance, a net benefit of 0.01 would be equivalent to a strategy where one patient per 100 tested was appropriately given preventative treatment, as they would otherwise have progressed to incident TB if left untreated.

References

    1. World Health Organization. Global Tuberculosis Report. 2019. https://www.who.int/tb/publications/global_report/en/
    1. World Health Organization. The End TB Strategy. 2015. http://www.who.int/tb/strategy/End_TB_Strategy.pdf?ua=1 .
    1. Getahun H, et al. Management of latent Mycobacterium tuberculosis infection: WHO guidelines for low tuberculosis burden countries. Eur Respir J. 2015;46:1563–1576. - PMC - PubMed
    1. Getahun H, Matteelli A, Chaisson RE, Raviglione M. Latent Mycobacterium tuberculosis infection. N Engl J Med. 2015;372:2127–2135. - PubMed
    1. Mack U, et al. LTBI: latent tuberculosis infection or lasting immune responses to M. tuberculosis? A TBNET consensus statement. Eur Respir J. 2009;33:956–973. - PubMed

Publication types