. 2021 Mar;39(3):378-386.
doi: 10.1038/s41587-020-0716-8. Epub 2020 Oct 19.

Molecular goniometers for single-particle cryo-electron microscopy of DNA-binding proteins

Affiliations

Molecular goniometers for single-particle cryo-electron microscopy of DNA-binding proteins

Tural Aksel et al. Nat Biotechnol. 2021 Mar.

Abstract

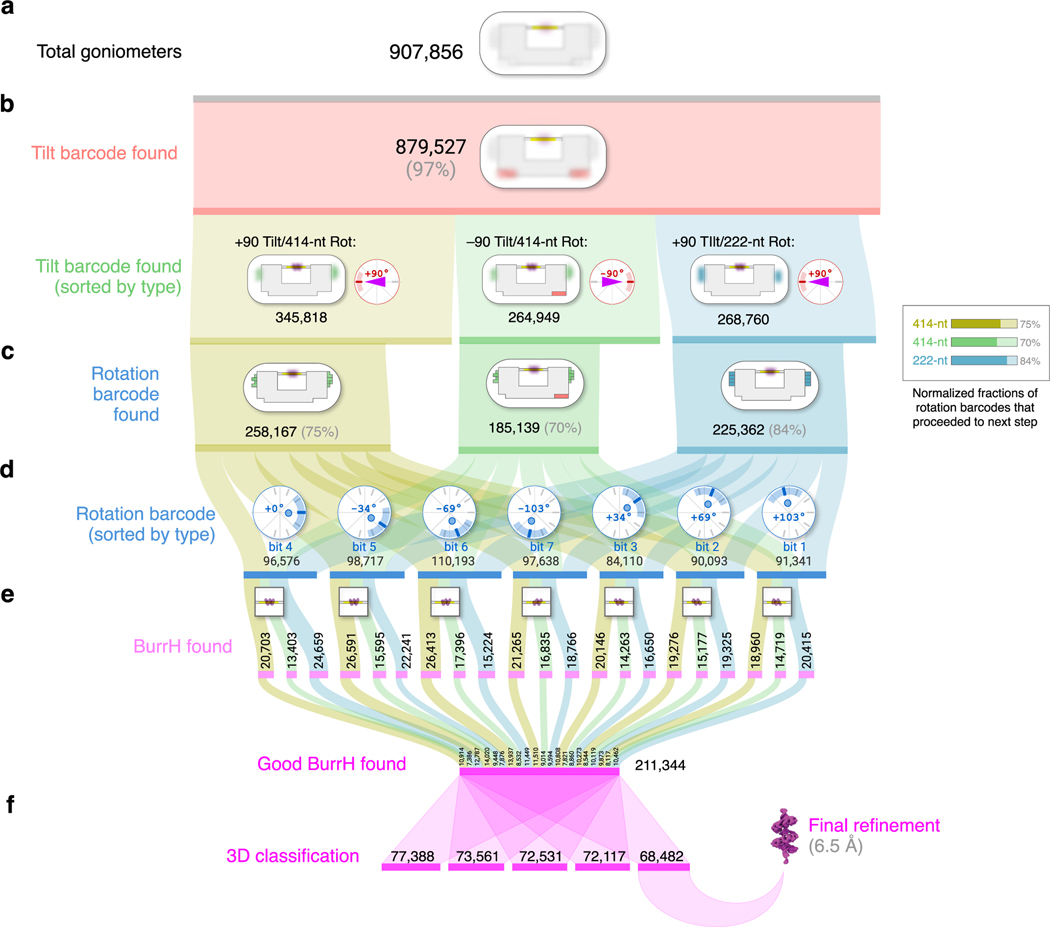
Correct reconstruction of macromolecular structure by cryo-electron microscopy (cryo-EM) relies on accurate determination of the orientation of single-particle images. For small (<100 kDa) DNA-binding proteins, obtaining particle images with sufficiently asymmetric features to correctly guide alignment is challenging. We apply DNA origami to construct molecular goniometers-instruments that precisely orient objects-and use them to dock a DNA-binding protein on a double-helix stage that has user-programmable tilt and rotation angles. We construct goniometers with 14 different stage configurations to orient and visualize the protein just above the cryo-EM grid surface. Each goniometer has a distinct barcode pattern that we use during particle classification to assign angle priors to the bound protein. We use goniometers to obtain a 6.5-Å structure of BurrH, an 82-kDa DNA-binding protein whose helical pseudosymmetry prevents accurate image orientation using traditional cryo-EM. Our approach should be adaptable to other DNA-binding proteins as well as small proteins fused to DNA-binding domains.


Conflict of interest statement

Competing interests

Authors declare no competing interests.

Figures

Extended Data Fig. 1
Extended Data Fig. 1. Comparison of grid adsorption orientation and signal delocalization for two chassis designs.
a, Representative negative-stain micrographs of chassis with 0.67 aspect ratio. b, Representative cryo-EM micrograph of chassis with 0.59 aspect ratio. Desired orientations assessed by manual counting. c, Top: Representative 2D class average of 0°-rotation goniometer from a. The chassis aperture exhibits a shadow that overlaps the DNA stage and BurrH protein. Bottom: Representative 2D class averages of BurrH, exhibiting artifacts that we hypothesized are due to delocalized origami signal in the 0.5–2.0 μm defocus range used for image acquisition. d, Top: 2D class of 0°-rotation goniometer from b designed to reduce shadow overlap. Bottom: Representative BurrH 2D class averages. Artifacts observed in c are significantly reduced. Scale bars: a, b: 100 nm, c, d: 25 nm (top), 10 nm (bottom).
Extended Data Fig. 2
Extended Data Fig. 2. How we defined “tilt” and “rotation” angles for the molecular goniometers.
Independent 2D views of a 3D object can be derived using only two orthogonal rotational transformations. In cryo-EM, the two orthogonal rotations can be referred to as tilt and rotation angles, respectively,. The reference coordinate system for the rotation operations can be chosen arbitrarily, and here we define the goniometer tilt angle as the angle between the stage DNA and the normal vector perpendicular to the goniometer face (the normal vector is parallel to the electron beam (Fig. 1a, orange line labeled e) when the goniometer adsorbs in the desired face-up orientation. We define the goniometer rotation angle as the rotation angle with respect to the axis parallel to the DNA stage helical axis.
Extended Data Fig. 3
Extended Data Fig. 3. Cadnano design strand diagram schematics.
a, Bit and rotation angles for each column. b, +90 tilt, 414-nt rotation bit designs. TILT bit is inactive (red outline in bottom right corner of each schematic). c, –90 tilt, 414-nt rotation bit designs. TILT bit is active. d, +90 tilt, 222-nt rotation bit designs. TILT bit is inactive.
Extended Data Fig. 4
Extended Data Fig. 4. 2D cryo-EM class averages goniometers with BurrH.
a, +90 tilt, 414-nt bit b, –90 tilt, 414-nt bit (flipped), c, +90 tilt, 222-nt bit. Scale bars: 100 nm.
Extended Data Fig. 5
Extended Data Fig. 5. Cryo-EM data analysis workflow for BurrH 3D reconstruction and refinement.
a, Centering goniometer classes at tilt DNA. b, Picking protein particles from the center of goniometers. c, 2D classification of BurrH particles and removing “bad” classes. d, Recentering “good” classes. e, Building an initial model 3D model with tilt and rot angle constraints. f, Aligning BurrH particles to initial model with tilt and rot angle constraints and regularization parameter, T, set to 6 for better alignment. g, Classifying particles into five 3D classes with tilt angle constraint on and regularization parameter, T, set to 2 to minimize overfitting during classification. Best 3D class (magenta) is at 7.3 Å resolution. h, Refining the best 3D class with only the tilt angle constraint. Estimated resolution of the refined map is 6.5 Å.
Extended Data Fig. 6
Extended Data Fig. 6. 2D classification of goniometer stage DNA with BurrH.
Representative 2D classes of stage DNA with BurrH after one round of 2D classification. Classes with high background signal, with empty tilt DNA and DNA origami signal are removed before further 2D classification of BurrH bound to stage DNA. b, “Good” 2D classes retained for 3D reconstruction and refinement of BurrH. Scale bar is 20 nm.
Extended Data Fig. 7
Extended Data Fig. 7. Measured tilt, rotation, and psi angle distributions for all goniometer designs.
Polar plots and histograms follow the convention from Figure 6. The inner tick mark represents the goal angle, and the arc shows the bounds of the Gaussian angle prior. Average rotation angles are plotted as magenta lines for tilt and rotation plots.
Extended Data Fig. 8
Extended Data Fig. 8. Directional FSC Plots for BurrH.
a, Individual directional FSCs (gray lines), global FSC value (blue line) and ±1 standard deviation from global FSC (magenta dashed lines). b, Directional FSC map and its 2D projections. The minimum resolution (blue) and maximum resolution (magenta) are indicated for each 2D projection.
Extended Data Fig. 9
Extended Data Fig. 9. Comparison of particle count and defocus effects on final BurrH resolution.
a, ResLog plots showing FSC vs. resolution for 3D refinement of BurrH using 1,000 to 68,482 particles. b, Resolution estimates from FSC0.143 vs. particles count. The resolution plateaus at 40k particles, suggesting our resolution is not limited by particle count. c, BurrH resolution vs. maximum micrograph defocus used in 3D reconstruction. d, Resolution estimates from FSC0.143 vs. maximum defocus. The resolution reaches a plateau at 1.5 μm and the addition of higher defocus particles doesn’t comprise the resolution. Inset shows the distribution of BurrH particle defocus in μm.
Extended Data Fig. 10
Extended Data Fig. 10. Filtering particles by estimated rotation angle.
FSC and ResLog plots for BurrH 3D reconstructions in which particles are filtered when their estimated angles from the unfiltered 3D refinement differ from the goniometer goal angle. a, We compared three conditions: No filter (i.e., identical to Fig. 6), and two conditions in which particles with assigned rotation angles that differ by >45°, and >90° from the goal angle. b, FSC curves comparing the 3D reconstruction for the three filtering conditions. c, Plot of particle count versus resolution estimate. Filtering reduces the particle count available for the 3D reconstruction, which in turn reduces the final resolution (see Extended Data Figure 8b). Compared to the unfiltered reconstructions, removing particles in the indicated angle ranges does not improve the final BurrH resolution.
Figure 1 |
Figure 1 |. Design and grid adsorption of molecular goniometers built from DNA origami.
a, A representative configuration is shown (+90° tilt, 0° rotation). DNA origami chassis (grey) grasps and controls the tilt and rotation of the 56-bp DNA stage (yellow) containing the 19-bp binding site for the BurrH protein (magenta). The TILT barcode bit (salmon) and ROTATION barcode domains (teal) identify each unique DNA stage configuration. b, 2D schematic of origami scaffold and staples. c, Chassis aspect ratio can promote the preferred orientation of goniometer adsorption onto the grid surface. d, The DNA stage is positioned with a 150 Å gap from the origami chassis. e, DNA stage tilt angle is set by the polarity of the origami scaffold route and the chassis attachment locations. f, Rotation angle is controlled by shifting the register of the DNA stage relative to the chassis. A 1-nt linear shift of the stage corresponds to a 34° angular rotation of the protein binding site. g, The DNA stage is flanked by unpaired 2-nt regions to provide rotational flexibility. An SD of 15° is used for the Gaussian rotation priors. h, A mixture containing BurrH and goniometers (at a 10:1 molar ratio) is deposited on a gold quantifoil grid with an amino graphene oxide support. A cropped region of 1 of 15,658 micrographs is shown. Circles indicate typical bound BurrH (yellow circle) and unbound BurrH (white circle). Scale bar: 100 nm.
Figure 2 |
Figure 2 |. Scaffold-integrated BurrH binding site and its relation to folded goniometers.
a, p9344-BurrH plasmid map. The custom scaffold was created by cloning an insert containing a BurrH binding region (yellow, magenta), an ampicillin resistance gene (green), and a plasmid origin of replication (blue) into M13mp18-RF. b, Representative goniometer scaffold path schematic (left) and cartoon 3D render (right), both annotated with the location of the cloned insert (orange). c, Sequence detail and 3D render of the DNA stage, which consists of the scaffold-integrated BurrH binding region (bottom) and a single complementary 56-nt staple strand (top). d, Sequence detail and 3D render of the BurrH binding site (magenta) and binding residues (blue), based on PDB id 4cja.
Figure 3 |
Figure 3 |. Determination of protein classes with angle priors from goniometer image data.
a, Goniometer data processing pipeline. Top right: representative 2D class, prior to sorting by tilt barcode. b, Example +90° and –90° tilt classes, with barcode detail below. Only the –90° tilt class has the 582-nt barcode bit enabled. Magenta arrowhead indicates N-to-C orientation of BurrH. c, The 222-nt rotation barcode bit consists of 108-nt scaffold paired with 3 staples of 114-nt combined length. d, An alternate 414-nt bit design (186 nt scaffold + 228 nt combined staple length) was also used. e, 2D consensus classes derived from goniometers with stages configured at +90° and –90° tilt angles, and 7 rotation angles (0°, ±34°, ±69°, and ±103°). See Figure 5 for statistics and Extended Data Figure 4 for all 20 classes of each goniometer. Scale bars: (a–d) 20 nm, e, 10 nm.
Figure 4 |
Figure 4 |. Cryo-EM data analysis workflow for DNA origami goniometer barcode classification.
a, Picking goniometers. b, Removing bad goniometer classes (purple outlines). c, Preparing well-centered classes. d, Aligning goniometer classes to a reference. e, Subtracting top region of goniometers for bottom (tilt) barcode classification. f, Focused classification on the left-bottom tilt barcode. g, Focused classification on the right-bottom tilt barcode. h, Separating +90° tilt and –90° tilt goniometers based on the barcode classifications. i, Flipping –90° gonimeters to align BurrH N-to-C direction. j, Subtracting the central region of goniometers for rotation-barcode classification. Focused classification on k, left-side and l, right-side rotation barcodes, with representative “bad” classes. m, Separating goniometers into 7 sub-classes based on the rotation-barcode classifications. Scale bars: a: 100 nm, b–m: 20 nm.
Figure 5 |
Figure 5 |. Sankey diagram for particle selection, classification, prior assignment, and 3D reconstruction.
a, “Total goniometers” is the count of particles successfully identified as a DNA origami goniometer. b, “Tilt barcode found” means tilt barcode (Fig. 2b) was successfully classified. c, “Rotation barcode found” means both tilt barcode and rotation barcode (Figs. 3b–d) were successfully classified. d, Subclassification by rotation barcode for angle prior assignment. e, “BurrH found” describes goniometers from c, that contained a BurrH particle, and “Good” means the 2D BurrH subimage had a low background signal. f, Good BurrH particles were used as input for 3D classification, and the highest-resolution class was used for final refinement.
Figure 6 |
Figure 6 |. 3D refinement of BurrH structure using molecular goniometer-derived angle priors.
a, BurrH 2D class averages; 3 of 50 are shown, see Extended Data Figure 6. b, 3D reconstruction of BurrH using a priori tilt and rotation angles from molecular goniometers and FSC curve calculated from two half-maps of the final 3D reconstruction. FSC0.143 line crosses the curve at 6.5 Å resolution. c, BurrH consensus 2D class averages and 2D projections of the 3D reconstruction. A single 2D consensus was generated for each angle projection. Projections are low-pass filtered to a resolution of 30 Å. d, Euler angle distribution derived from 3D refinement, with blue-red color scale. e, Representative polar plots for stage tilt angles for +90° and –90° designs. The inner red tick mark represents the goal tilt angle, and the ±45° arc shows the bounds of the Gaussian tilt angle prior. The tilt angle distributions reported by Relion are plotted as histograms. Average tilt angles (magenta line) were +83° and –96°, respectively. f, Representative polar angle plots for seven stage rotation angles reported by Relion, derived from goniometers with +90° tilt and 414-nt barcode bits. The inner blue tick mark represents the goal rotation angle (integer value in blue text), and the ±45° arc shows the bounds of the Gaussian rotation angle prior. Average rotation angles are plotted as magenta lines (integer values in pink text). g, Comparison of 3D reconstructions obtained without angle priors (blue: cryoSPARC, red: cisTEM, yellow: Relion), and with priors (magenta: Relion with goniometer-derived angle priors), with BurrH crystal structure (cyan) fit to each density map. Areas where cyan is visible indicate a poor fit. Tilt-direction accuracy is compared to the true orientations derived from gonimeters. h, FSC curves showing goodness-of-fit of BurrH crystal structure into 3D cryo-EM density maps of BurrH. FSC curve is computed following a rigid body fit of BurrH crystal structure into each cryo-EM density map. FSC0.5 shown as a dashed line. Scale bars in a, c: 10 nm.

References

    1. Bai X-C, McMullan G & Scheres SHW How cryo-EM is revolutionizing structural biology. Trends Biochem. Sci 40, 49–57 (2015). - PubMed
    1. Cheng Y Single-particle cryo-EM-How did it get here and where will it go. Science 361, 876–880 (2018). - PMC - PubMed
    1. Wu S et al. Fabs enable single particle cryoEM studies of small proteins. Structure 20, 582–592 (2012). - PMC - PubMed
    1. Zhang C et al. Analysis of discrete local variability and structural covariance in macromolecular assemblies using Cryo-EM and focused classification. Ultramicroscopy 203, 170–180 (2019). - PMC - PubMed
    1. Liu Y, Gonen S, Gonen T & Yeates TO Near-atomic cryo-EM imaging of a small protein displayed on a designed scaffolding system. Proc. Natl. Acad. Sci. U. S. A 115, 3362–3367 (2018). - PMC - PubMed

Online Methods References

    1. Heymann JB, Chagoyen M & Belnap DM Common conventions for interchange and archiving of three-dimensional electron microscopy information in structural biology. J. Struct. Biol 151, 196–207 (2005). - PubMed
    1. Nafisi PM, Aksel T & Douglas SM Construction of a novel phagemid to produce custom DNA origami scaffolds. Synth. Biol 3, (2018). - PMC - PubMed
    1. Douglas SM et al. Rapid prototyping of 3D DNA-origami shapes with caDNAno. Nucleic Acids Res. 37, 5001–5006 (2009). - PMC - PubMed
    1. Wagenbauer KF et al. How We Make DNA Origami. Chembiochem 18, 1873–1885 (2017). - PubMed
    1. Zheng SQ et al. MotionCor2: anisotropic correction of beam-induced motion for improved cryo-electron microscopy. Nat. Methods 14, 331–332 (2017). - PMC - PubMed

Publication types

MeSH terms