. 2021 Jun;76(6):1731-1742.
doi: 10.1111/all.14633. Epub 2020 Nov 5.

Single-cell molecular profiling provides a high-resolution map of basophil and mast cell development

Affiliations

Single-cell molecular profiling provides a high-resolution map of basophil and mast cell development

Fiona K Hamey et al. Allergy. 2021 Jun.

Abstract

Background: Basophils and mast cells contribute to the development of allergic reactions. Whereas these mature effector cells are extensively studied, the differentiation trajectories from hematopoietic progenitors to basophils and mast cells are largely uncharted at the single-cell level.

Methods: We performed multicolor flow cytometry, high-coverage single-cell RNA sequencing analyses, and cell fate assays to chart basophil and mast cell differentiation at single-cell resolution in mouse.

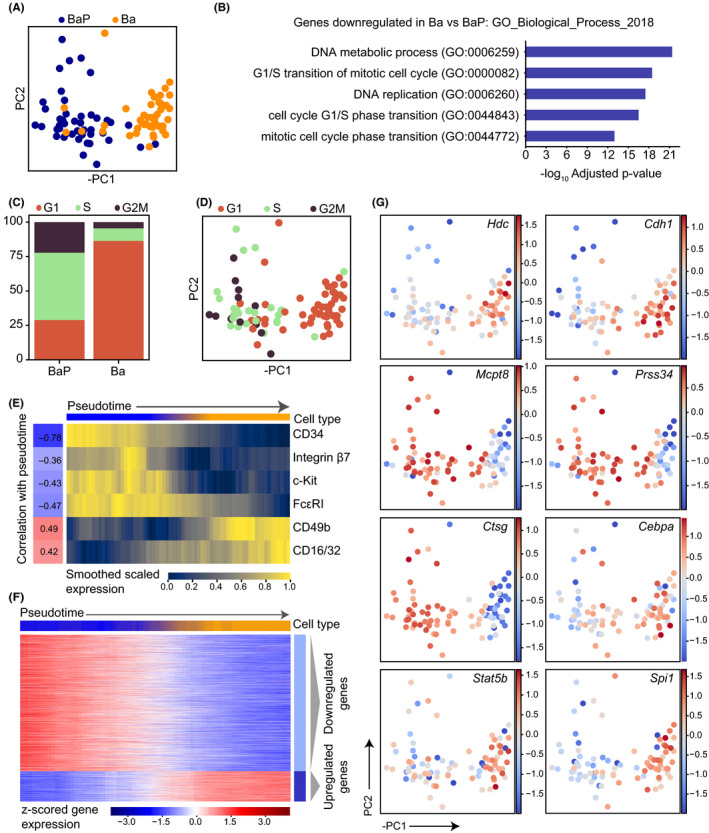
Results: Analysis of flow cytometry data reconstructed a detailed map of basophil and mast cell differentiation, including a bifurcation of progenitors into two specific trajectories. Molecular profiling and pseudotime ordering of the single cells revealed gene expression changes during differentiation. Cell fate assays showed that multicolor flow cytometry and transcriptional profiling successfully predict the bipotent phenotype of a previously uncharacterized population of peritoneal basophil-mast cell progenitors.

Conclusions: A combination of molecular and functional profiling of bone marrow and peritoneal cells provided a detailed road map of basophil and mast cell development. An interactive web resource was created to enable the wider research community to explore the expression dynamics for any gene of interest.

Keywords: basophils; differentiation; mast cells; single-cell RNA sequencing; transcriptomics.


Conflict of interest statement

The authors declare that they have no competing interests.

Figures

Figure 1
Figure 1
Flow cytometry analysis reveals differentiation trajectories from bipotent basophil‐mast cell progenitors to basophils and mast cells. A, Illustration outlining the basophil and mast cell differentiation trajectories. B, Flow cytometry‐based gating strategies of (Bi) bipotent basophil‐mast cell progenitors (BMCPs) from bone marrow, (Bii) basophil progenitors (BaP) and basophils (Ba) from bone marrow, and (Biii) P1 cells and mast cells from peritoneal cavity. Lineage markers include 7‐4, CD5, CD11b, CD19, CD45R/B220, Ly6G/C (Gr‐1), and TER119. C, Diffusion map visualization of the flow cytometry data colored by cell type. D, Diffusion map visualization of the flow cytometry data colored by protein expression or light scatter parameters. The surface expression parameters and light scatter parameters are visualized on log‐transformed and linear scales, respectively. Expression of lineage markers and viability staining are not shown. The data are representative of 4 independent experiments
Figure 2
Figure 2
Bone marrow basophil progenitors downregulate cell cycle genes during differentiation. A, PCA of scRNA‐seq profiles colored by cell surface marker phenotype. PC, principal component. B, Top 5 GO Biological Process terms associated with the genes significantly upregulated in BaP cells compared to Ba cells, ranked by adjusted P‐value. Benjamini‐Hochberg correction for multiple hypotheses testing. Genes upregulated in Ba compared to BaP are presented in Figure S1B. C, Proportion of scRNA‐seq profiles from each phenotype computationally assigned to G1, S or G2M cell cycle states based on gene expression using the scanpy score_genes_cell_cycle function. D, PCA colored by cell cycle state. E, Levels of cell surface markers for cells ordered by PC1 pseudotime. Index data values were log‐transformed, smoothed along pseudotime by using a sliding window of size 20 and scaled between 0 and 1 for each marker. Correlation values indicate the pearson correlation coefficient between pseudotime and the unsmoothed expression values for each surface marker. Colorbar at the top indicates the phenotypic cell type proportions within each window. Blue corresponds to entirely BaPs and orange to Ba cells. F, Heatmap displaying the expression of genes dynamically expressed along the PC1 pseudotime ordering. The top colorbar indicates the cell type proportion in each window. Expression is smoothed along a sliding window and z‐scored for each gene, and genes were clustered using Louvain clustering into groups showing different dynamics. Dynamic genes defined as adjusted P‐value < .01 in permutation test, details in supplementary methods. G, PCA colored by z‐scored expression of specific genes. The data represent cells pooled from 3 individual mice
Figure 3
Figure 3
Transcriptional profiling of peritoneal mast cell progenitors captures a differentiation continuum. A, Diffusion map dimensionality reduction of scRNA‐seq profiles colored by cell phenotype. DC, diffusion component. B, Bone marrow BMCP cells from Dahlin et al 4 were projected into the PCA space of the peritoneal cells and the 10 closest peritoneal neighbors of each bone marrow cell were identified in these co‐ordinates. Cells are colored by a score representing how frequently each peritoneal cell was the nearest neighbor of a bone marrow BMCP. C, Diffusion map colored by pseudotime ordering of cells. DPT, diffusion pseudotime. D, Levels of cell surface markers for pseudotime ordered cells. Index data values were log‐transformed, smoothed along pseudotime by using a sliding window of size 20 and scaled between 0 and 1 for each marker. Correlation values indicate the pearson correlation coefficient between pseudotime and the unsmoothed expression values for each surface marker. Colorbar at the top indicates the phenotypic cell type proportions within each window. Green corresponds to entirely P1 cells and purple to MCs. E, Heatmap displaying the expression of genes dynamically expressed along the pseudotime ordering. The top colorbar indicates the proportion of cell type in each window. Expression is smoothed along a sliding window and z‐scored for each gene, and genes were clustered using Louvain clustering into groups showing different dynamics. Dynamic genes defined as adjusted P‐value < .01 in permutation test, details in supplementary methods. F, Heatmap of dynamically regulated proteases showing z‐scored gene expression along pseudotime. Genes were ordered using the hierarchical clustering indicated by the dendrogram. Colorbar indicates the Louvain cluster from (E) for each gene. G, Expression trends of specific genes along pseudotime. Genes are scaled by their maximum expression value rather than z‐scoring as in the heatmap. H, Diffusion map colored by z‐score scaled expression of specific genes. The data represent cells pooled from 4 individual mice
Figure 4
Figure 4
P1 peritoneal cells exhibit potential to form basophils and mast cells. A‐B, May‐Grünwald Giemsa staining of primary and in vitro cultured P1 cells and mast cells extracted from the peritoneal cavity. Ba, basophil; MC, mast cell. Two or seven independent experiments revealed the morphology of primary P1 cells and mast cells, respectively. C, Flow cytometry gating strategy to identify basophils and mast cells cultured from primary P1 cells and mast cells. D, Quantification of cell type output following bulk‐culture and flow cytometry analysis of P1 cells and mast cells. Pooled data from 4 independent experiments per population are shown. The means and SEMs are shown. E, Principal component analysis of the flow cytometry reference dataset, provided in Figure 1C, colored by cell type. F, Projection of index‐sorted cells into the principal component space of the reference dataset. The point size represents log10‐transformed colony size and the colors represent colony type following cell culture. Panel F shows data pooled from 2 independent experiments. The cells were cultured with IL‐3 and stem cell factor. G, UMAP visualization of the Human Cell Atlas single‐cell transcriptomics data colored by cell type. Identity of the clusters was assigned based on established marker genes. H, UMAP visualization of the basophil‐mast cell differentiation trajectory colored by cluster or expression of different genes

References

    1. Nathan C. Points of control in inflammation. Nature. 2002;420:846‐852. - PubMed
    1. Akashi K, Traver D, Miyamoto T, Weissman IL. A clonogenic common myeloid progenitor that gives rise to all myeloid lineages. Nature. 2000;404:193‐197. - PubMed
    1. Tusi BK, Wolock SL, Weinreb C, et al. Population snapshots predict early haematopoietic and erythroid hierarchies. Nature. 2018;555:54‐60. - PMC - PubMed
    1. Dahlin JS, Hamey FK, Pijuan‐Sala B, et al. A single‐cell hematopoietic landscape resolves 8 lineage trajectories and defects in Kit mutant mice. Blood 2018;131:e1‐11. - PMC - PubMed
    1. Drissen R, Thongjuea S, Theilgaard‐Monch K, Nerlov C. Identification of two distinct pathways of human myelopoiesis. Sci Immunol. 2019;4:eaau7148. - PubMed

Publication types