

Dynamics and Dispersal of Local Human Immunodeficiency Virus Epidemics Within San Diego and Across the San Diego-Tijuana Border
- PMID: 33079188
- PMCID: PMC8492140
- DOI: 10.1093/cid/ciaa1588
Dynamics and Dispersal of Local Human Immunodeficiency Virus Epidemics Within San Diego and Across the San Diego-Tijuana Border
Abstract
Background: Evolutionary analyses of well-annotated human immunodeficiency virus (HIV) sequence data can provide insights into viral transmission patterns and associated factors. Here, we explored the transmission dynamics of the HIV-1 subtype B epidemic across the San Diego (US) and Tijuana (Mexico) border region to identify factors that could help guide public health policy.
Methods: HIV pol sequences were collected from people with HIV in San Diego County and Tijuana between 1996-2018. A multistep phylogenetic approach was used to characterize the dynamics of spread. The contributions of geospatial factors and HIV risk group to the local dynamics were evaluated.
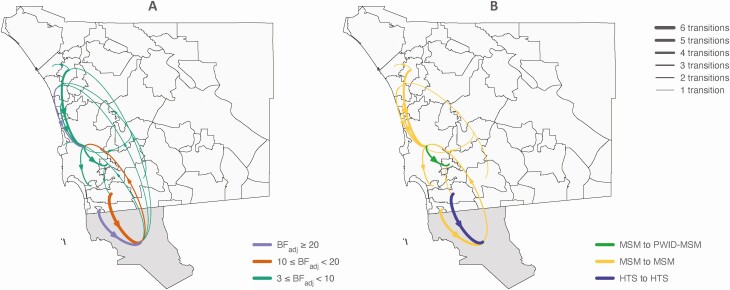
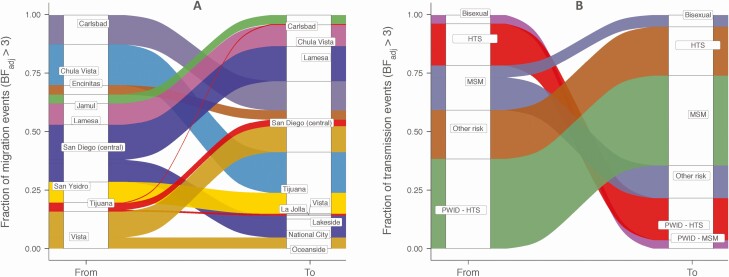
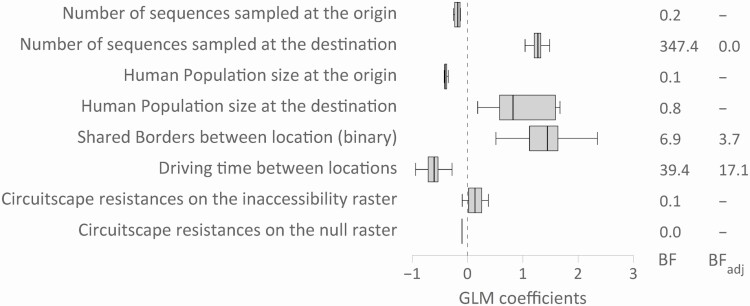
Results: Phylogeographic analyses of the 2034 sequences revealed an important contribution of local transmission in sustaining the epidemic, as well as a complex viral migration network across the region. Geospatial viral dispersal between San Diego communities occurred predominantly among men who have sex with men, with central San Diego being the main source (34.9%) and recipient (39.5%) of migration events. HIV migration was more frequent from San Diego county towards Tijuana than vice versa. Migrations were best explained by the driving time between locations.
Conclusions: The US-Mexico border may not be a major barrier to the spread of HIV, which may stimulate coordinated transnational intervention approaches. Whereas a focus on central San Diego has the potential to avert most spread, the substantial viral migration independent of central San Diego shows that county-wide efforts will be more effective. Combined, this work shows that epidemiological information gleaned from pathogen genomes can uncover mechanisms that underlie sustained spread and, in turn, can be a building block of public health decision-making.
Keywords: Bayesian discrete phylogeography; HIV; generalized linear model; phylogeography.
© The Author(s) 2020. Published by Oxford University Press for the Infectious Diseases Society of America. All rights reserved. For permissions, e-mail: journals.permissions@oup.com.
Figures
References
-
- Health and Human Services Agency County of San Diego. HIV/AIDS epidemiology report 2015. San Diego, California: County of San Diego, 2016.
-
- AIDSVu. AIDSVu: an interactive online mapping tool that visualizes the impact of the HIV epidemic on communities across the United States. Available at: https://aidsvu.org/. Accessed 30 March 2019.
-
- Centro Nacional para la Prevención y el Control del VIH y el SIDA (CENSIDA). Vigilancia epidemiológica de casos de HIV/AIDS en México, Registro Nacional de Casos de SIDA. Washington, DC: Bureau Of Transportation Statistics, U.S. Department of Transportation. Accessed 11 November 2019.
-
- United States Department of Transportation. Bureau of transportation statistics (BTS). Available at: https://www.bts.gov/topics/national-transportation-statistics. Accessed 15 April 2019.
Publication types
MeSH terms
Grants and funding
LinkOut - more resources
Full Text Sources
Medical
