Comparative Study
. 2021 Apr 15;203(8):946-956.
doi: 10.1164/rccm.202005-1989OC.

Airspace Macrophages and Monocytes Exist in Transcriptionally Distinct Subsets in Healthy Adults

Affiliations
Comparative Study

Airspace Macrophages and Monocytes Exist in Transcriptionally Distinct Subsets in Healthy Adults

Kara J Mould et al. Am J Respir Crit Care Med. .

Abstract

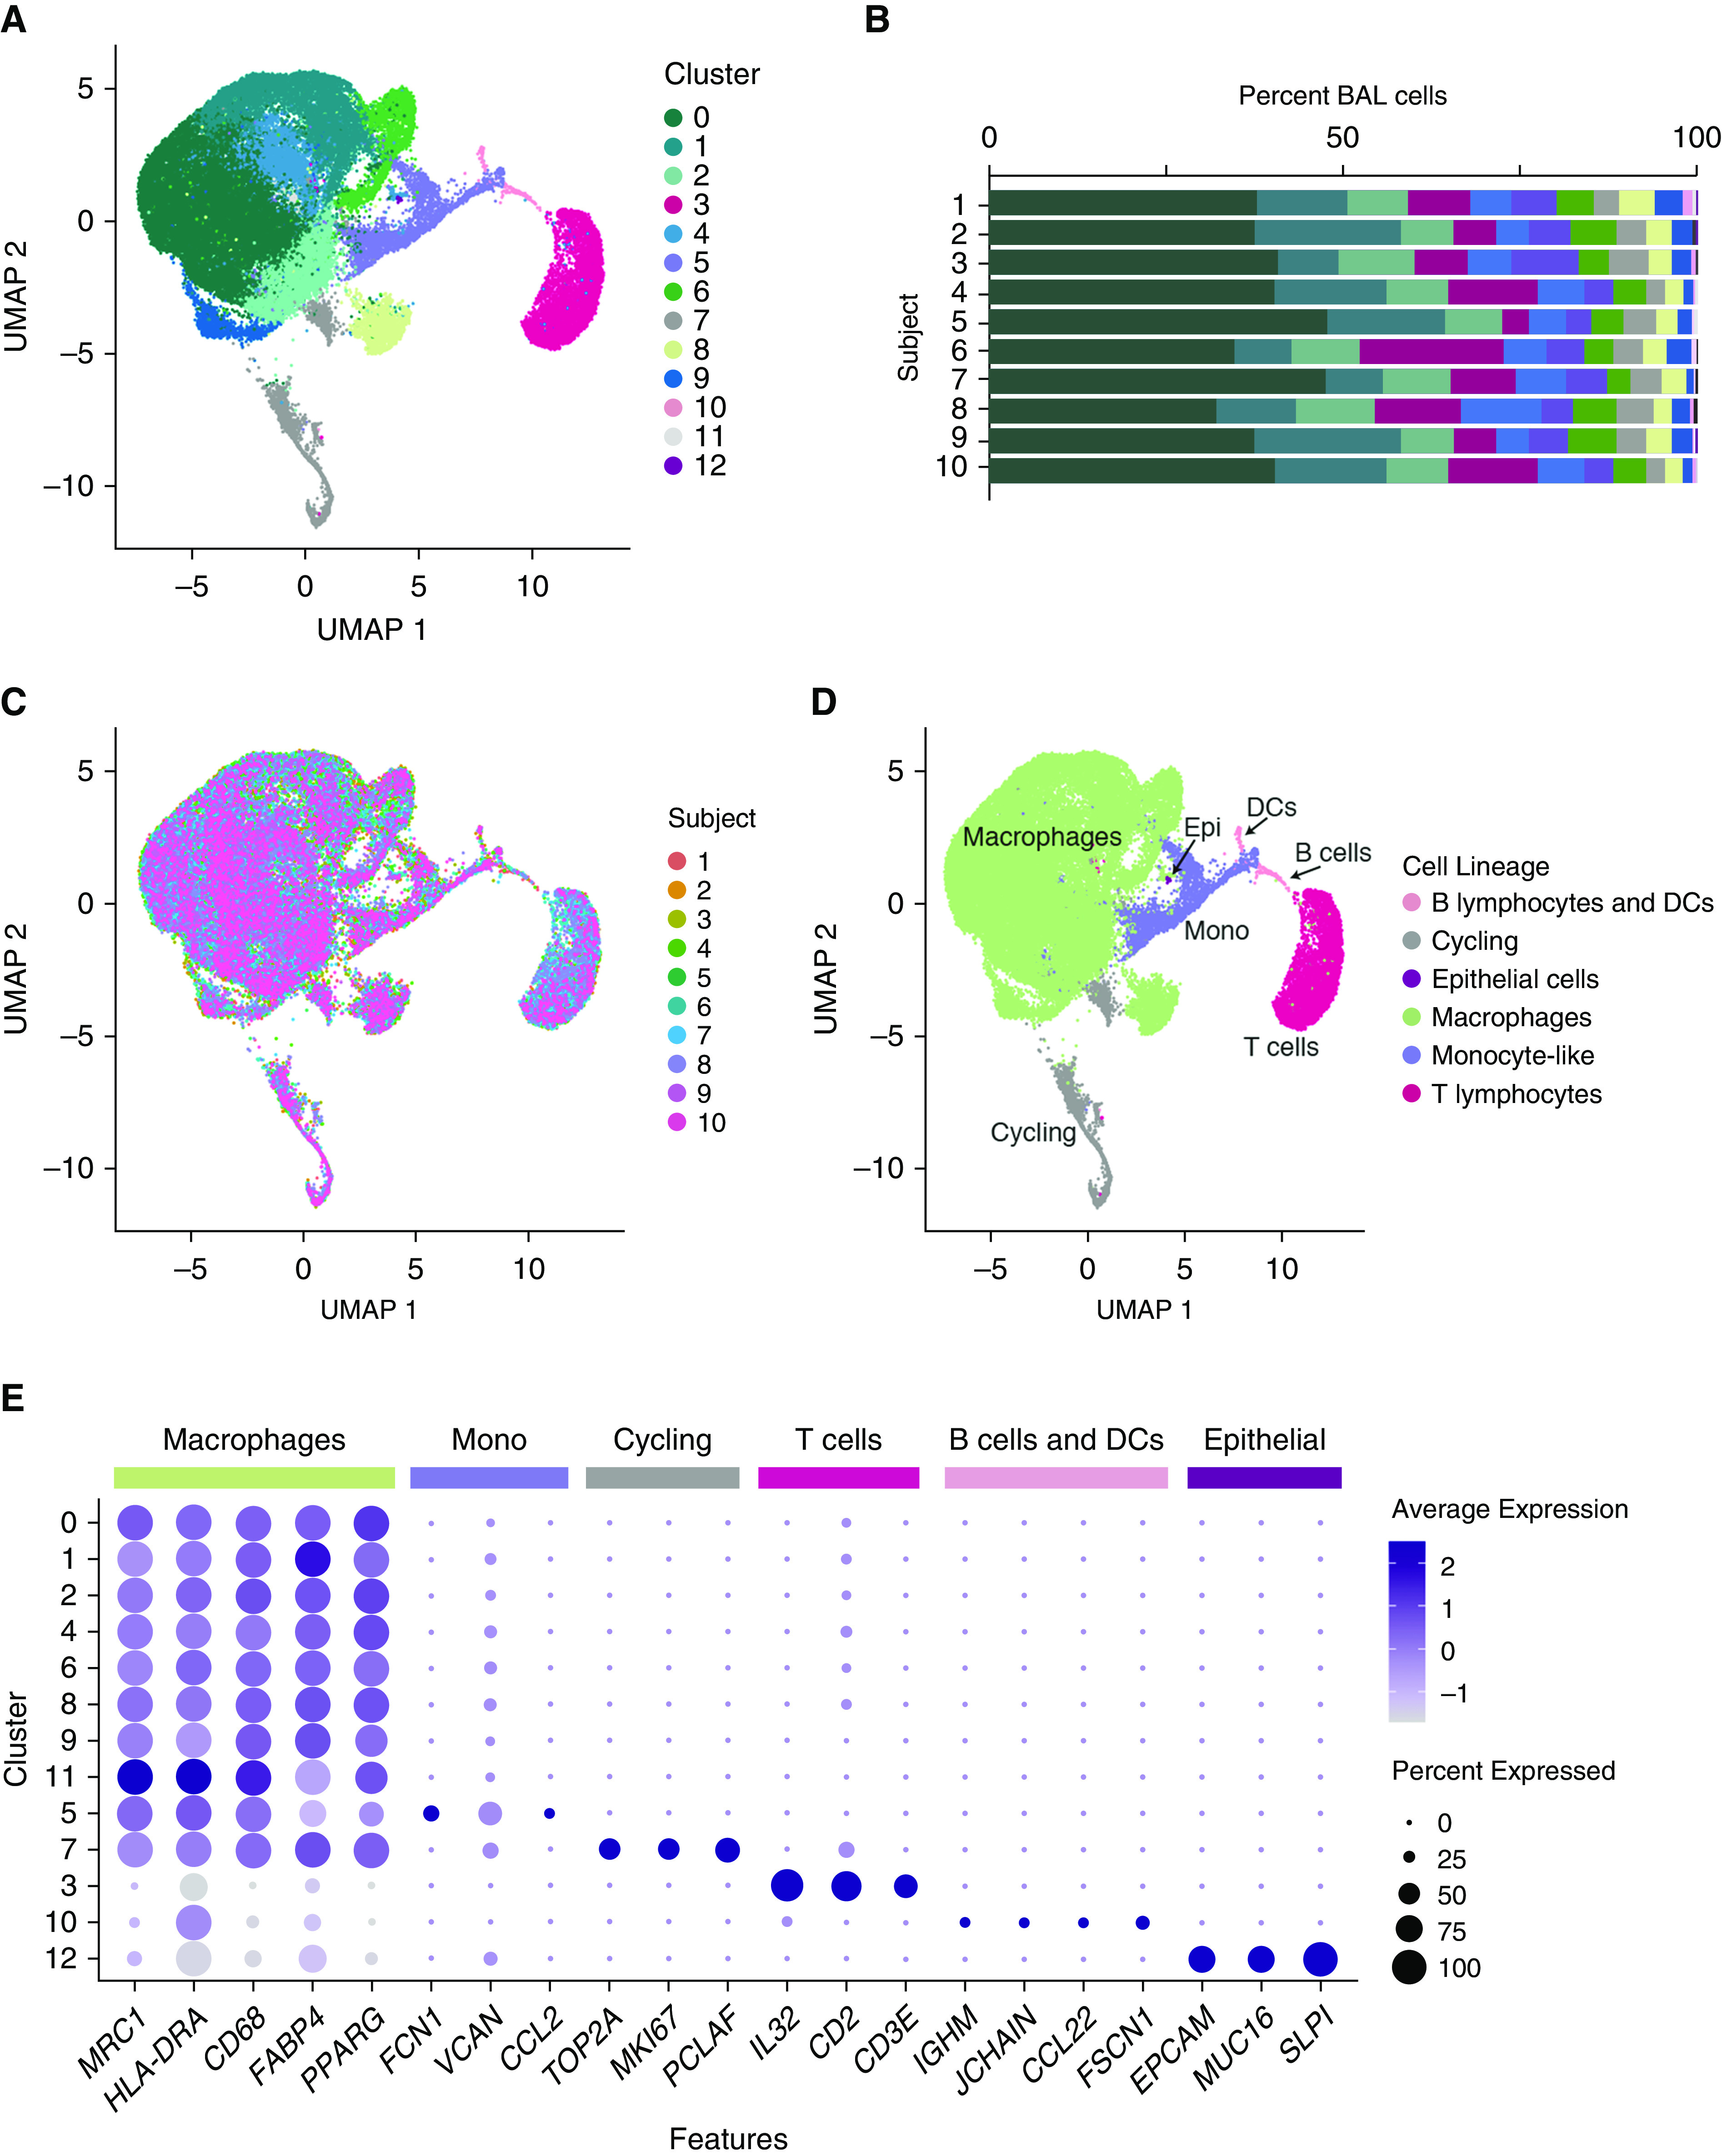
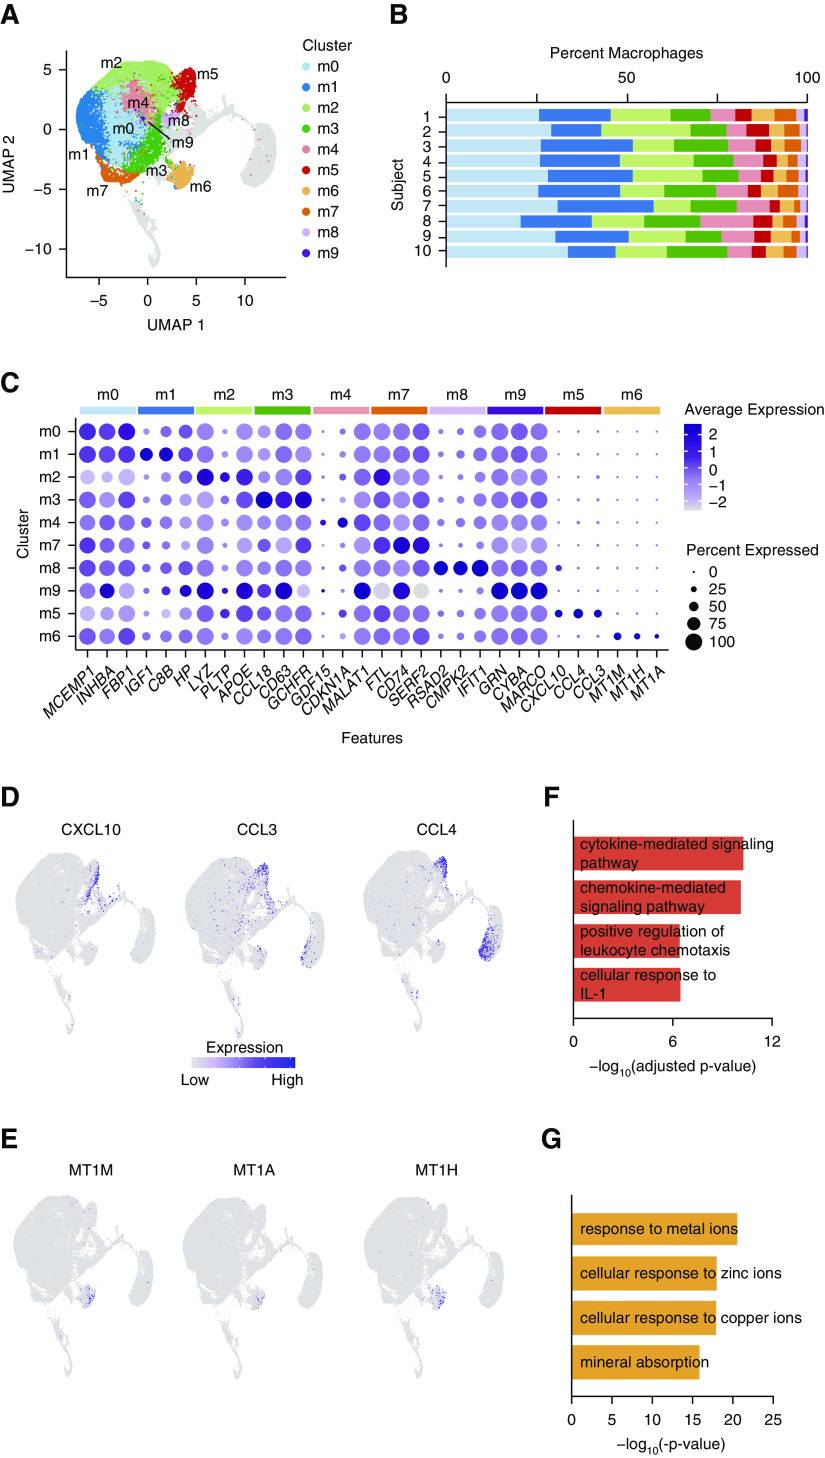
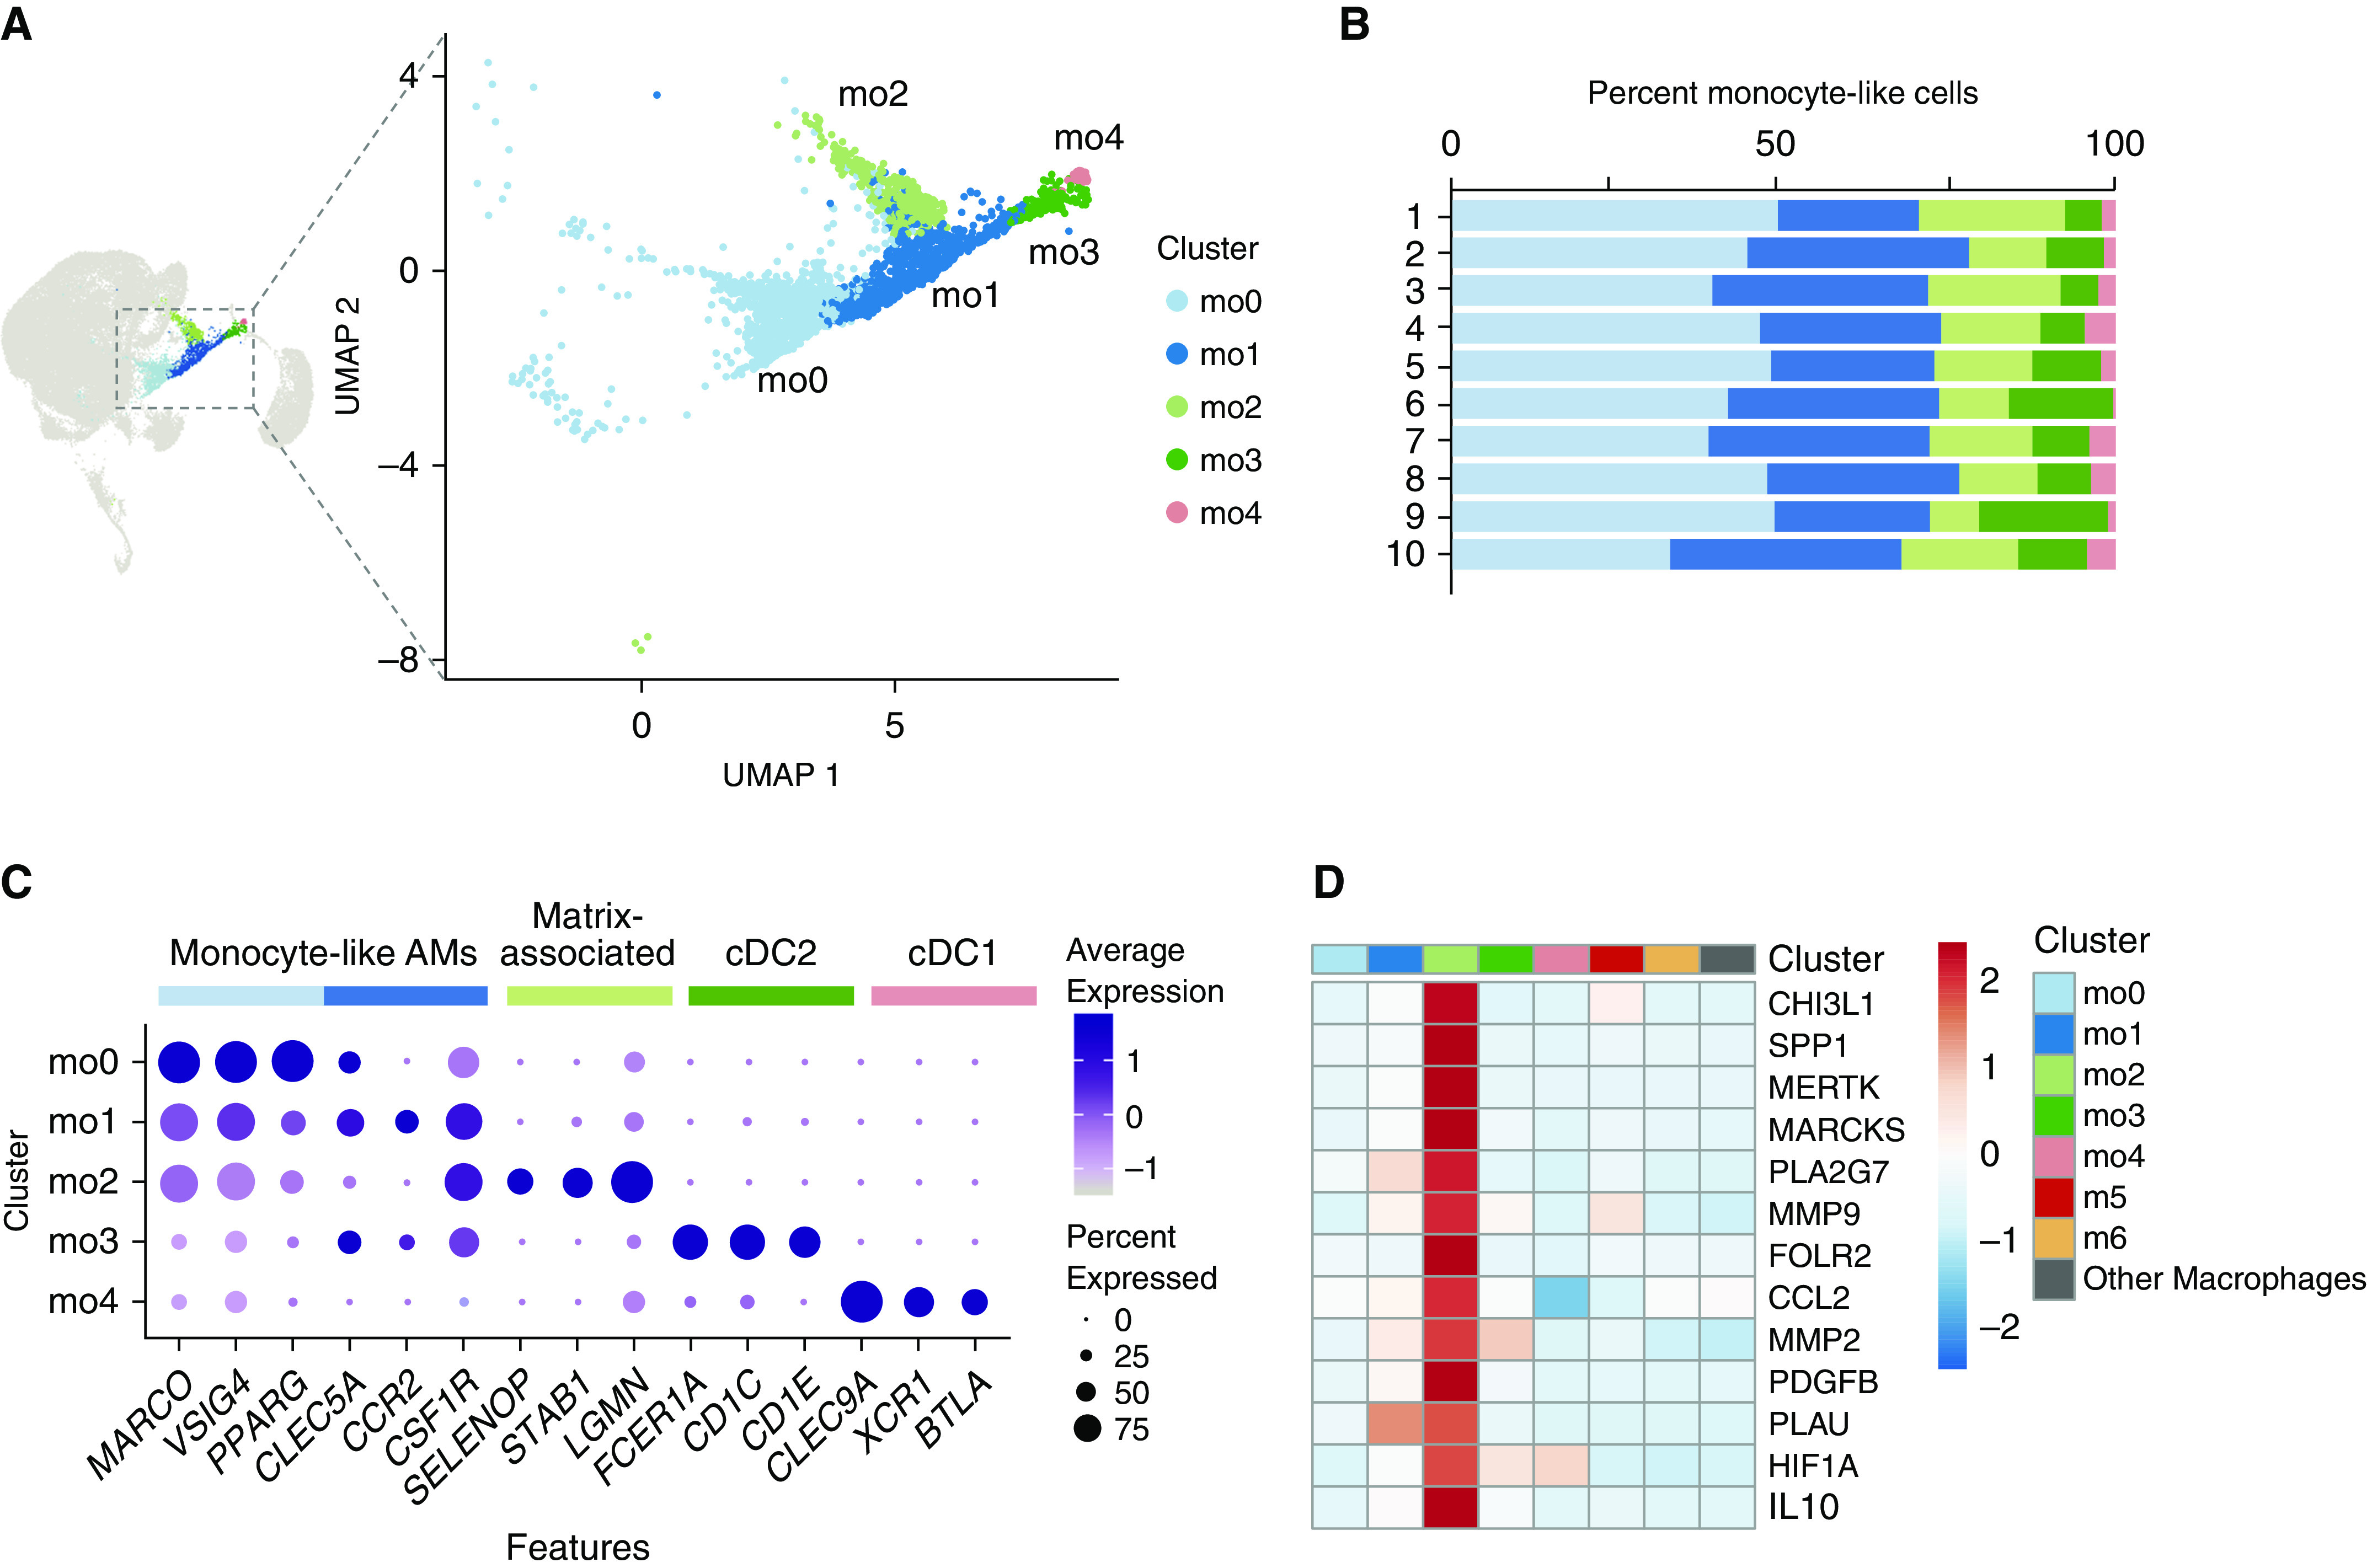
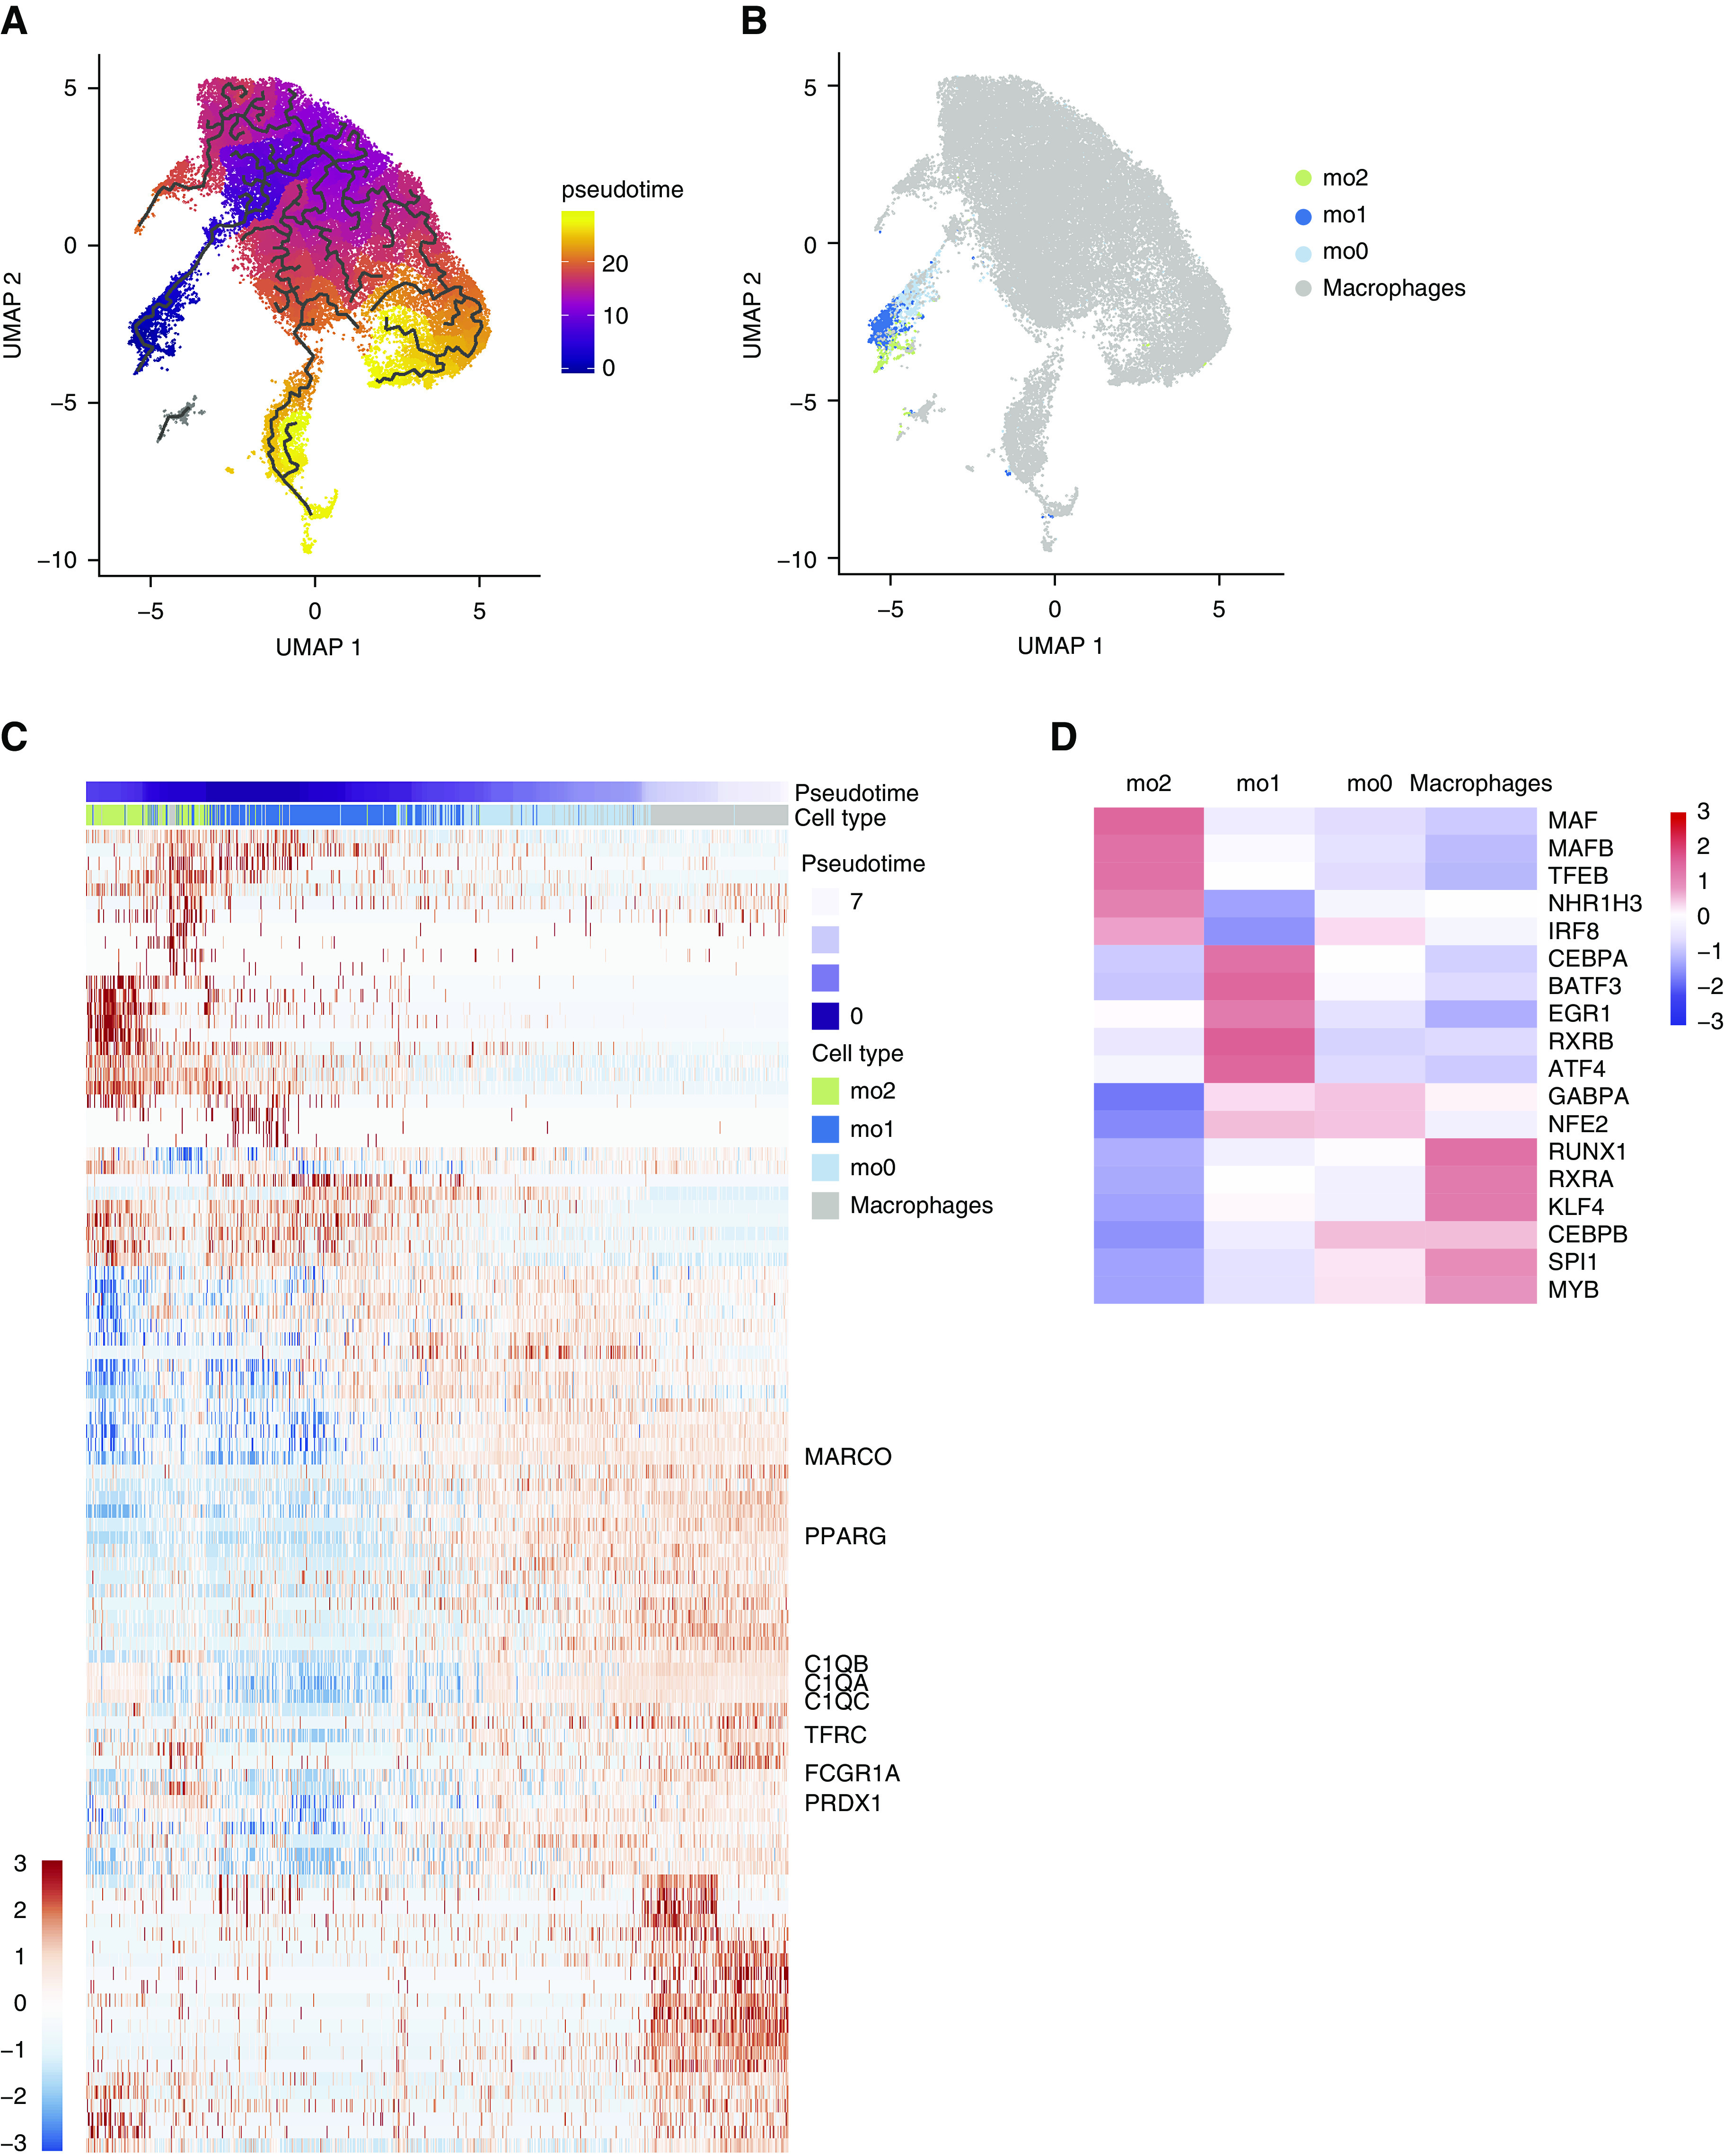
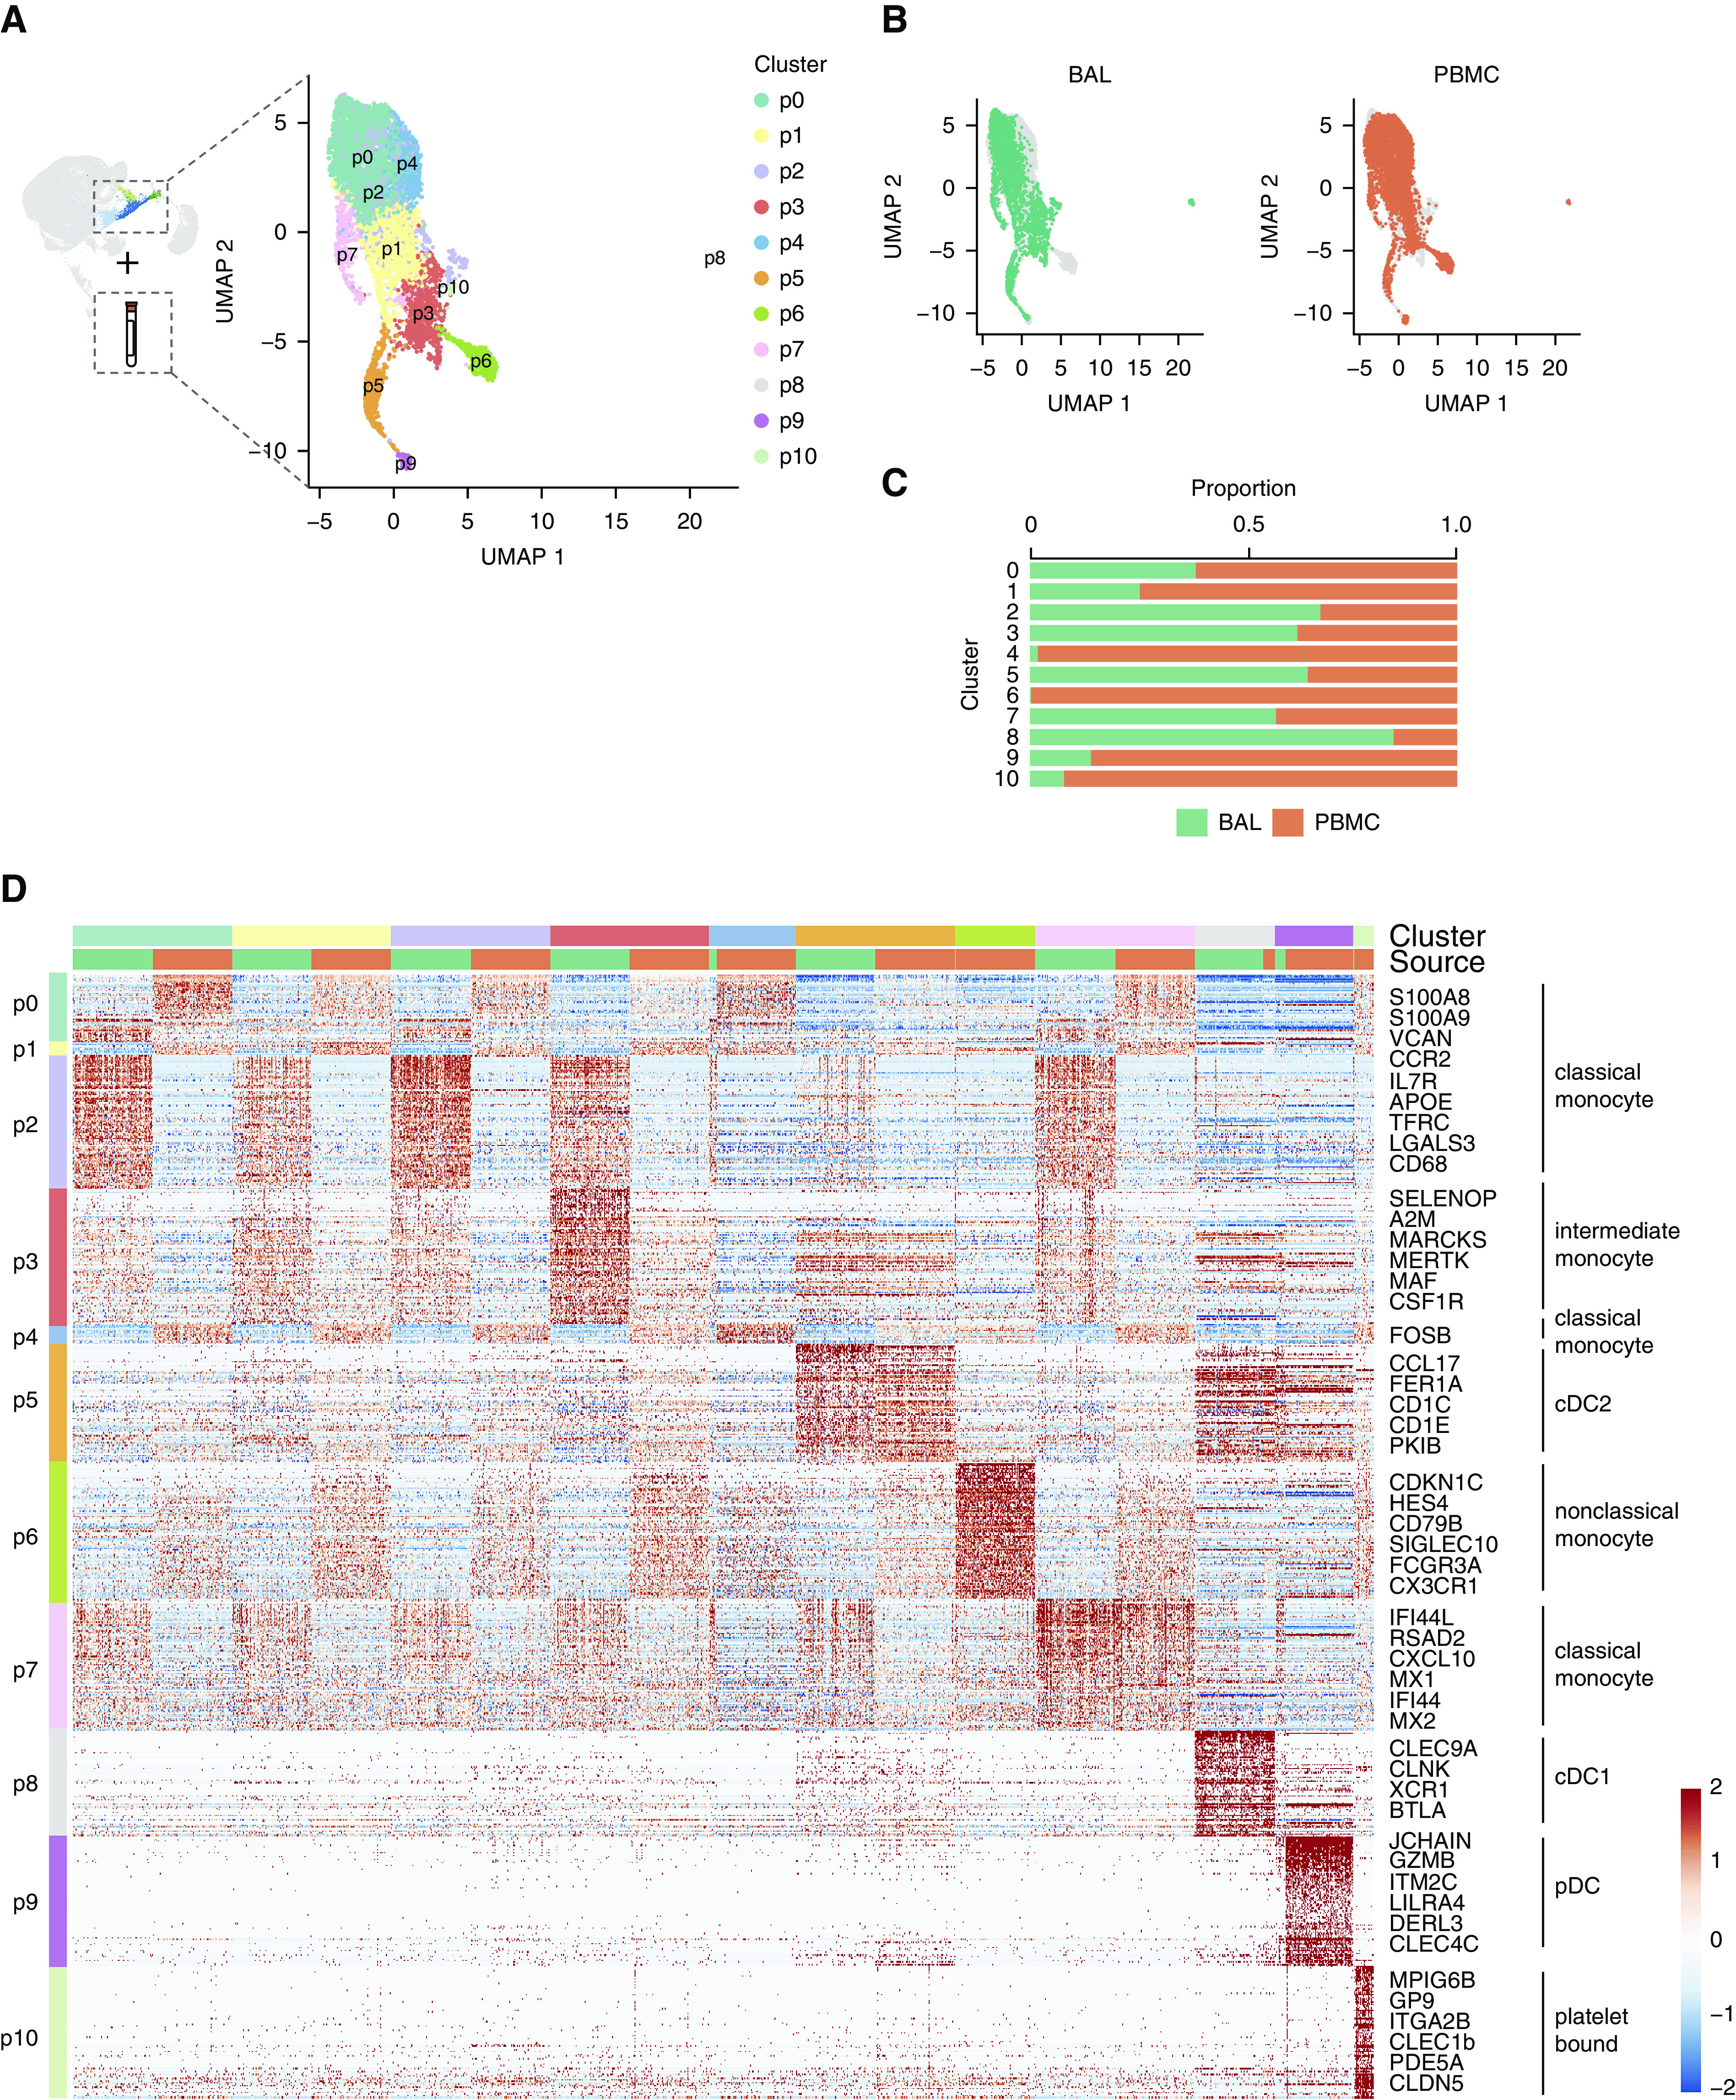
Rationale: Macrophages are the most abundant immune cell in the alveoli and small airways and are traditionally viewed as a homogeneous population during health. Whether distinct subsets of airspace macrophages are present in healthy humans is unknown. Single-cell RNA sequencing allows for examination of transcriptional heterogeneity between cells and between individuals. Understanding the conserved repertoire of airspace macrophages during health is essential to understanding cellular programing during disease.Objectives: We sought to determine the transcriptional heterogeneity of human cells obtained from BAL of healthy adults.Methods: Ten subjects underwent bronchoscopy with BAL. Cells from lavage were subjected to single-cell RNA sequencing. Unique cell populations and putative functions were identified. Transcriptional profiles were compared across individuals.Measurements and Main Results: We identify two novel subgroups of resident airspace macrophages-defined by proinflammatory and metallothionein gene expression profiles. We define subsets of monocyte-like cells and compare them with peripheral blood mononuclear cells. Finally, we compare global macrophage and monocyte programing between males and females.Conclusions: Healthy human airspaces contain multiple populations of myeloid cells that are highly conserved between individuals and between sexes. Resident macrophages make up the largest population and include novel subsets defined by inflammatory and metal-binding profiles. Monocyte-like cells within the airspaces are transcriptionally aligned with circulating blood cells and include a rare population defined by expression of cell-matrix interaction genes. This study is the first to delineate the conserved heterogeneity of airspace immune cells during health and identifies two previously unrecognized macrophage subsets.

Keywords: RNA sequencing; alveolar macrophages; bronchoalveolar lavage.


Figures

Figure 1.
Figure 1.
Single-cell transcriptional profiling of healthy human BAL cells. Ten healthy subjects underwent endoscopic BAL and single cells were isolated and assessed by single-cell RNA sequencing. (A) Uniform manifold approximation and projection (UMAP) plot shows clustering of 49,384 cells based on gene expression. Color specifies assignment of cells to one of 13 clusters inferred using shared nearest neighbor clustering. (B) Relative percentage of cells within each cluster by individual subject. (C) Subject information overlaid on UMAP plot. (D) Cell lineage inferred from expression of marker gene signatures. (E) Dot plot comparing expression of marker genes across cell clusters, where the x-axis denotes marker genes and the y-axis refers to clusters in A. Colored bars across the top of the figure denote inferred annotations of clusters based on the corresponding marker genes. Dot size is proportional to the percentage of cells expressing the gene in each cluster. Color intensity is proportional to averaged scaled log-normalized expression within a cluster. DCs = dendritic cells; Epi = epithelial cells; Mono = monocyte-like cells.
Figure 2.
Figure 2.
Distinct populations of airspace macrophages exist during health. (A) Cells identified as macrophages (Figure 1 clusters 0–2, 4, 6, 8, 9, and 11) were reclustered. Color specifies assignment of cells to one of 10 clusters. (B) Relative proportion of cells within each cluster by individual subject. (C) Dot plot comparing expression of marker genes across cell clusters, where the x-axis denotes marker genes and the y-axis refers to clusters in A. Colored bars across the top of the figure denote the subcluster from which the marker genes were identified. Dot size is proportional to the percentage of cells expressing the gene in each cluster. Color intensity is proportional to averaged scaled log-normalized expression within a cluster. (D and E) Feature plots demonstrating scaled log-normalized expression of selected genes differentially expressed in clusters m5 (D) and m6 (E). (F and G) Functional enrichment analysis of cluster markers. Representative pathways are shown for m5 (F) and m6 (G). m0–9 = macrophage clusters 0–9; UMAP = uniform manifold approximation and projection.
Figure 3.
Figure 3.
Monocyte-like cells are composed of dendritic cells and monocyte-like airspace macrophages. (A) Cells identified as monocyte-like (Figure 1 cluster 5) were reclustered. Color specifies assignment of cells to one of five clusters. (B) Relative proportion of cells within each cluster by individual subject. (C) Dot plot comparing expression of marker genes across cell clusters, where the x-axis denotes marker genes and the y-axis refers to clusters in A. Colored bars across the top of the figure denote inferred annotations of clusters based on the corresponding marker genes. Dot size is proportional to the percentage of cells expressing the gene in each cluster. Color intensity is proportional to averaged scaled log-normalized expression within a cluster. (D) Heat map demonstrating expression of select cell–matrix interaction genes (“other macrophages” are composed of clusters m0–4 and m7–9). The heat map is colored by the average scaled log-normalized expression in each cluster. AM = airspace macrophage; cDC = conventional dendritic cell; m0–9 = macrophage clusters 0–9; mo0–4 = monocyte-like clusters 0–4; UMAP = uniform manifold approximation and projection.
Figure 4.
Figure 4.
Airspace monocyte-to-macrophage maturation trajectory. (A) UMAP of 36,452 macrophages and monocytes colored by pseudotime. Black lines represent the principal graph trajectories. (B) UMAP colored by monocyte subclusters (from Figure 3 clusters mo0–2) or macrophages (Figure 2 clusters m0–9). (C) Heat map of the top 100 pseudotime differentially expressed genes across the monocyte-to-macrophage branch. The heat map is colored by scaled log-normalized expression for each cell. (D) Heat map of scaled regulon activity scores for select transcription factor motifs implicated in monocyte-to-macrophage maturation (“macrophages” are composed of clusters m0–4 and m6–9). m0–9 = macrophage clusters 0–9; mo0–2 =monocyte-like cell clusters 0–2; UMAP = uniform manifold approximation and projection.
Figure 5.
Figure 5.
Monocyte-like cells are aligned but distinct from circulating blood cells. (A) Monocyte-like cells from BAL (Figure 1 cluster 5) were integrated with peripheral blood monocytes and reclustered. Color specifies assignment of cells to one of 11 clusters, labeled p0–11. (B) Contributions of cells from BAL or PBMCs to UMAP projection. (C) Relative proportion of cells within each cluster from BAL or PBMCs. (D) Heat map of cell clusters with select marker genes and annotations highlighted. Up to 100 cells were randomly selected from BAL and PBMC samples in each cluster for inclusion in the heat map. Up to the top 100 markers significant in at least two individual samples were included for each cluster. The heat map is colored by scaled log-normalized expression. cDC = conventional dendritic cell; PBMC = peripheral blood mononuclear cell; pDC = plasmacytoid dendritic cell; UMAP = uniform manifold approximation and projection.

Comment in

References

    1. Mould KJ, Jackson ND, Henson PM, Seibold M, Janssen WJ. Single cell RNA sequencing identifies unique inflammatory airspace macrophage subsets. JCI Insight. 2019;4:126556. - PMC - PubMed
    1. Han X, Wang R, Zhou Y, Fei L, Sun H, Lai S, et al. Mapping the mouse cell atlas by microwell-seq. Cell. 2018;173:1307. - PubMed
    1. Jakubzick C, Gautier EL, Gibbings SL, Sojka DK, Schlitzer A, Johnson TE, et al. Minimal differentiation of classical monocytes as they survey steady-state tissues and transport antigen to lymph nodes. Immunity. 2013;39:599–610. - PMC - PubMed
    1. Yu YR, Hotten DF, Malakhau Y, Volker E, Ghio AJ, Noble PW, et al. Flow cytometric analysis of myeloid cells in human blood, bronchoalveolar lavage, and lung tissues. Am J Respir Cell Mol Biol. 2016;54:13–24. - PMC - PubMed
    1. Jardine L, Wiscombe S, Reynolds G, McDonald D, Fuller A, Green K, et al. Lipopolysaccharide inhalation recruits monocytes and dendritic cell subsets to the alveolar airspace. Nat Commun. 2019;10:1999. - PMC - PubMed

Publication types