. 2021 Jan 4;131(1):e139929.
doi: 10.1172/JCI139929.

Guanosine triphosphate links MYC-dependent metabolic and ribosome programs in small-cell lung cancer

Affiliations

Guanosine triphosphate links MYC-dependent metabolic and ribosome programs in small-cell lung cancer

Fang Huang et al. J Clin Invest. .

Abstract

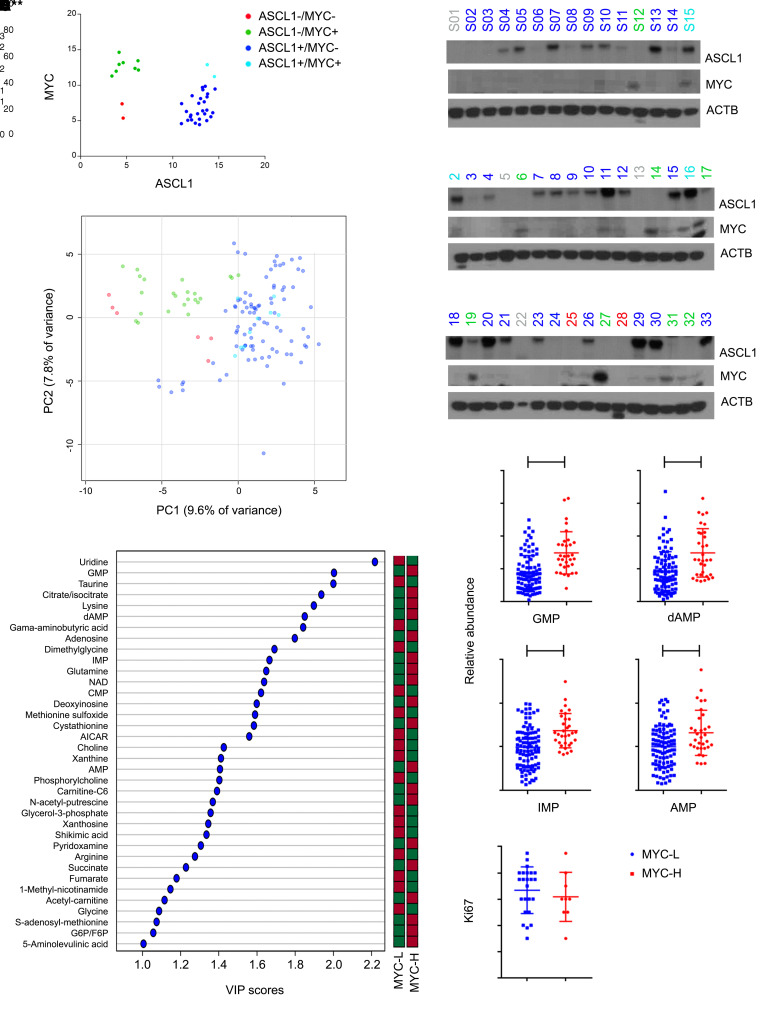
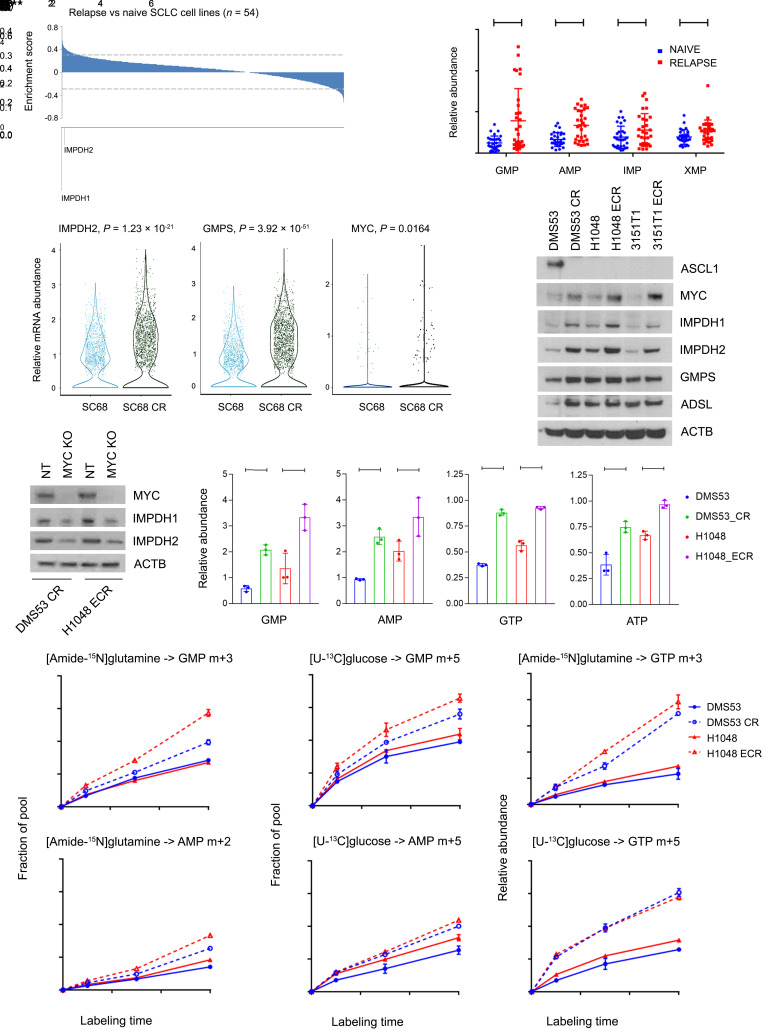
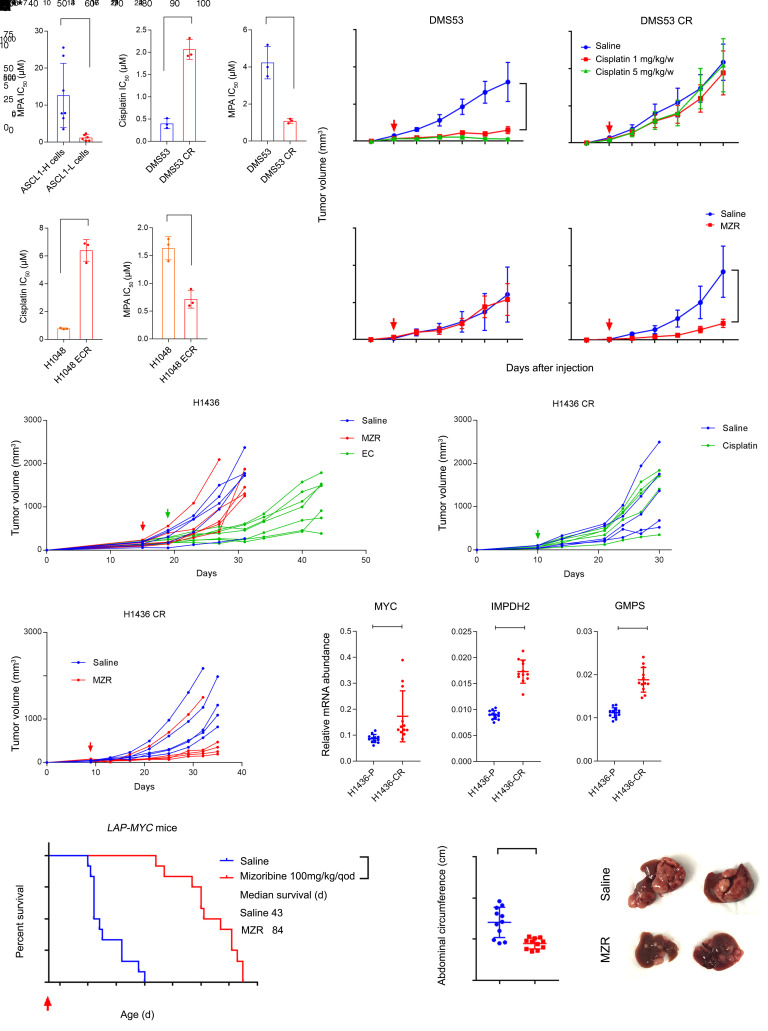
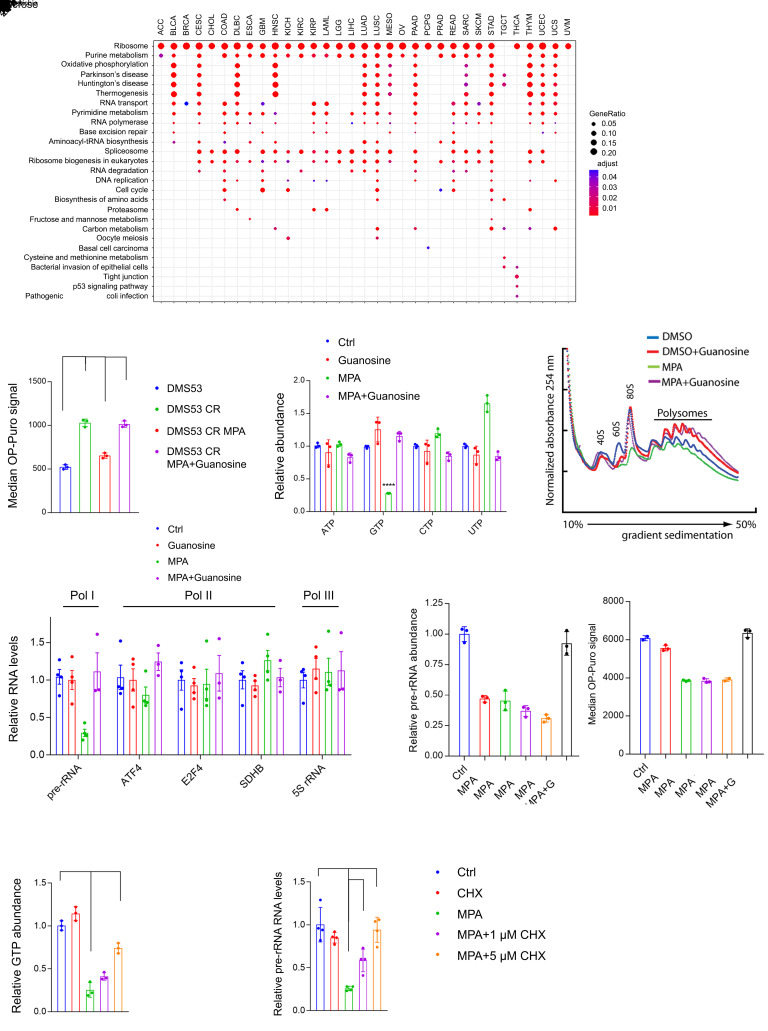
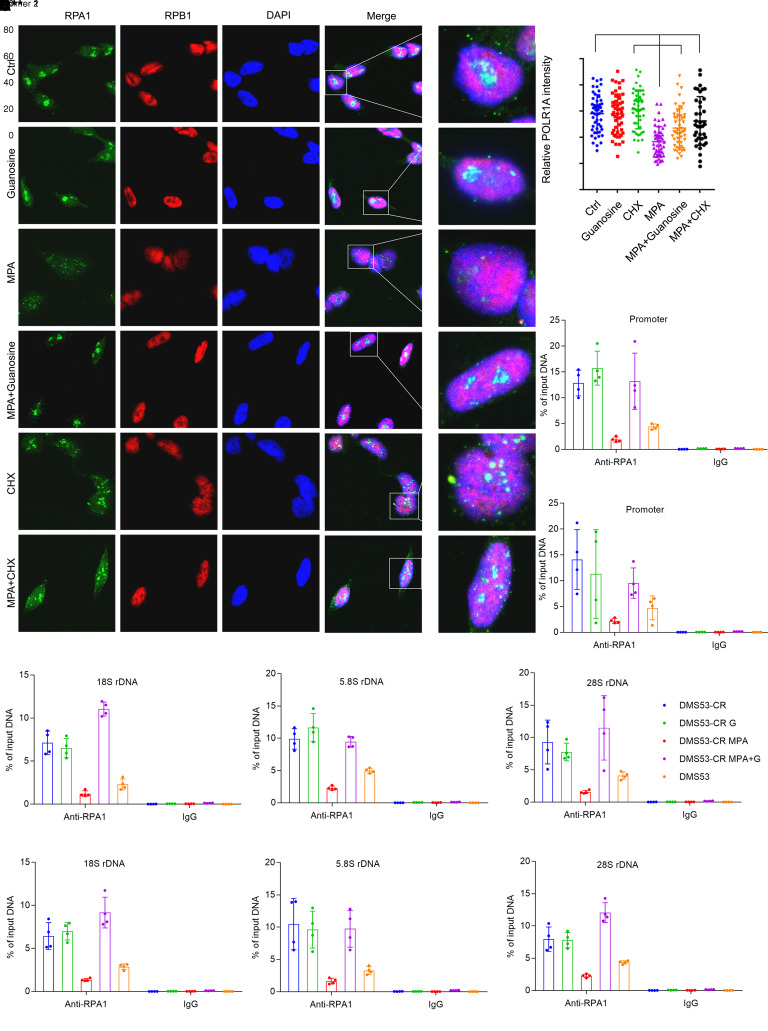
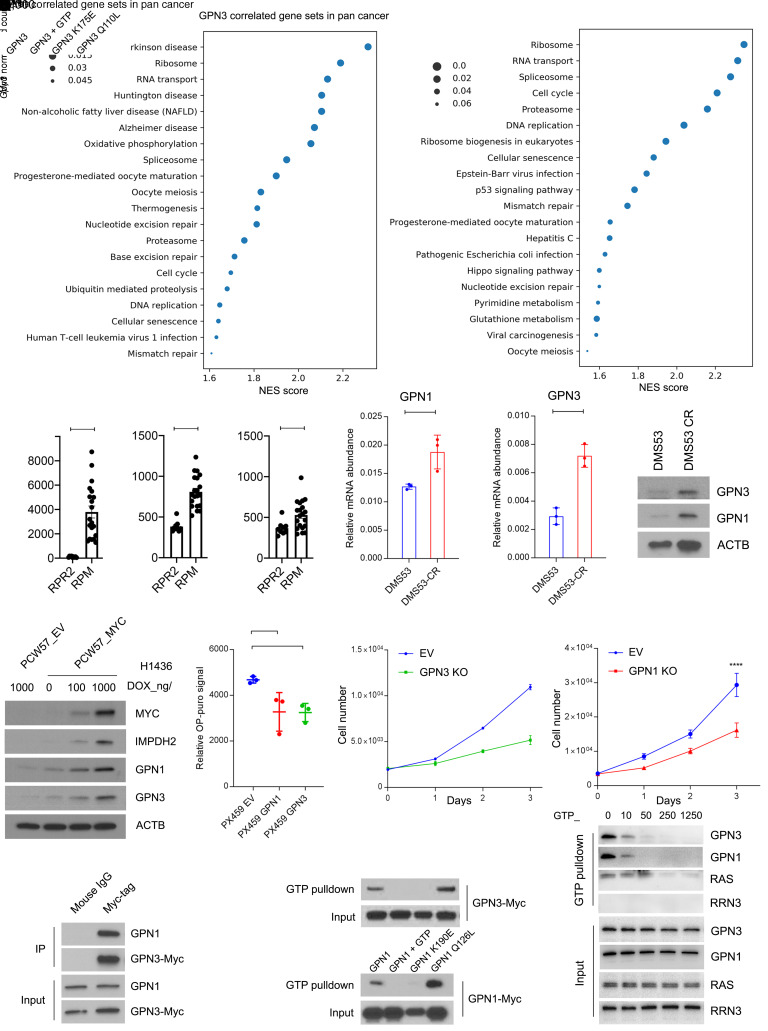
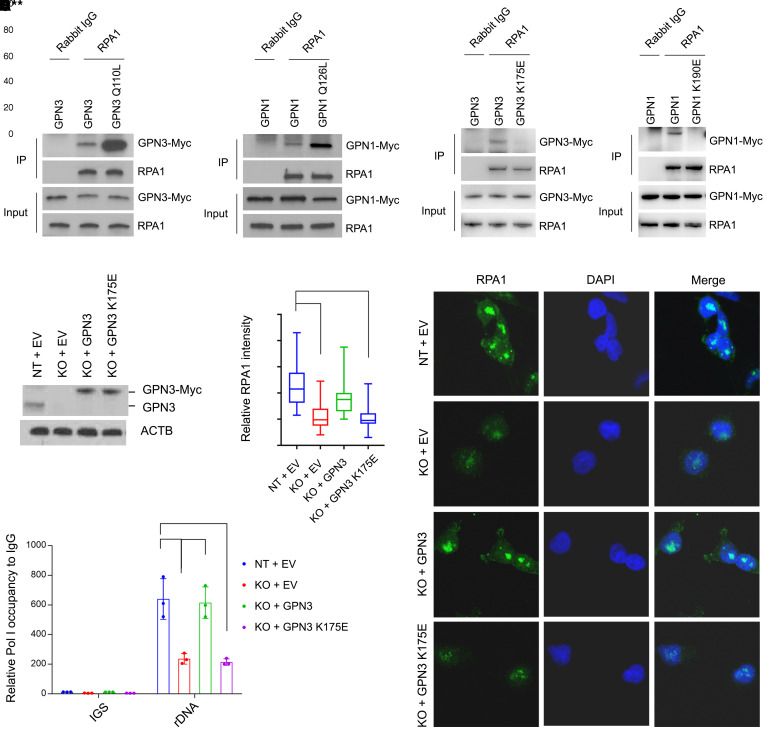
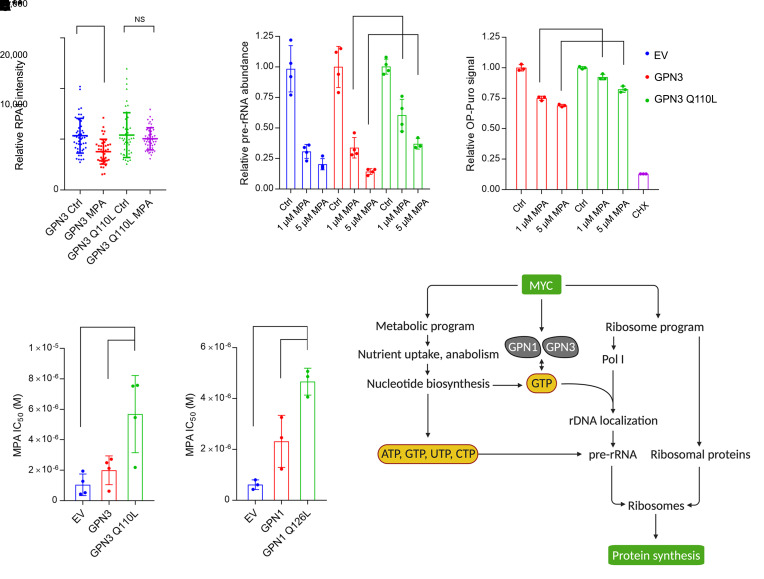
MYC stimulates both metabolism and protein synthesis, but how cells coordinate these complementary programs is unknown. Previous work reported that, in a subset of small-cell lung cancer (SCLC) cell lines, MYC activates guanosine triphosphate (GTP) synthesis and results in sensitivity to inhibitors of the GTP synthesis enzyme inosine monophosphate dehydrogenase (IMPDH). Here, we demonstrated that primary MYChi human SCLC tumors also contained abundant guanosine nucleotides. We also found that elevated MYC in SCLCs with acquired chemoresistance rendered these otherwise recalcitrant tumors dependent on IMPDH. Unexpectedly, our data indicated that IMPDH linked the metabolic and protein synthesis outputs of oncogenic MYC. Coexpression analysis placed IMPDH within the MYC-driven ribosome program, and GTP depletion prevented RNA polymerase I (Pol I) from localizing to ribosomal DNA. Furthermore, the GTPases GPN1 and GPN3 were upregulated by MYC and directed Pol I to ribosomal DNA. Constitutively GTP-bound GPN1/3 mutants mitigated the effect of GTP depletion on Pol I, protecting chemoresistant SCLC cells from IMPDH inhibition. GTP therefore functioned as a metabolic gate tethering MYC-dependent ribosome biogenesis to nucleotide sufficiency through GPN1 and GPN3. IMPDH dependence is a targetable vulnerability in chemoresistant MYChi SCLC.

Keywords: Intermediary metabolism; Lung cancer; Metabolism; Oncogenes; Oncology.


Conflict of interest statement

Conflict of interest: The authors have declared that no conflict of interest exists.

Figures

Figure 1
Figure 1. Distinct metabolomic subsets of primary human SCLC.
(A and B) Protein abundance of ASCL1 and MYC in tumors from treatment-naive SCLC patients. Tumors labeled gray in B were excluded from further study owing to inadequate metabolite content. (C) Principal component analysis of metabolomics in tumors from A. Individual data points are displayed for 3 fragments from each tumor. (D) Metabolites discriminating between MYChi and MYClo tumors. These metabolites have variable importance in the projection (VIP) scores over 1.0, indicating statistically significant differences between the groups. The bar indicates whether each metabolite is more (red) or less abundant (green) in each group. (E) Relative abundance of purines in MYChi and MYClo tumors. Individual data points are shown with mean and SD for 3 fragments from each tumor. **P < 0.01, ***P < 0.001, ****P < 0.0001. (F) Ki67 values from 33 tumors. Individual data points are shown with mean and SD. Statistical significance was assessed using a 2-tailed Student’s t test (E). Metabolomics was performed once. All other experiments were repeated twice or more.
Figure 2
Figure 2. Enhanced purine biosynthesis in chemoresistant SCLC.
(A) Enrichment scores reporting transcript abundance between 20 cell lines from relapsed patients and 34 cell lines from treatment-naive patients. Dashed lines demarcate P = 0.05. (B) Relative abundance of GMP, AMP, IMP, and XMP in 22 of the cell lines from A. Individual data points are shown with mean and SD for 3 cultures of each line. *P < 0.05, **P < 0.01, ****P < 0.0001. (C) IMPDH2, GMPS, and MYC abundance from single- cell RNA sequencing of SC68 PDX tumors and their chemoresistant counterpart SC68-CR. (D) Immunoblot analysis of ASCL1, MYC, IMPDH1, IMPDH2, GMPS, and ADSL in 3 pairs of treatment-naive and chemoresistant SCLC cell lines. CR, cisplatin resistant; ECR, etoposide and cisplatin resistant. (E) MYC, IMPDH1, and IMPDH2 expression in DMS53-CR and H1048-ECR cells with CRISPR/Cas9-mediated MYC KO or transfected with nontargeting (NT) guide RNA. (F) Relative GMP, AMP, GTP, and ATP abundance in 2 cell line pairs. *P < 0.05, **P < 0.01, ***P < 0.001, ****P < 0.0001. (G and H) Fractional labeling of GMP and AMP in pairs of treatment-naive and chemoresistant cells cultured in medium containing [amide-15N]glutamine (G) or [U-13C]glucose (H) for 1, 3, and 6 hours. **P < 0.01, ***P < 0.001, ****P < 0.0001. (I) Relative abundance of GTP m + 3 and GTP m + 5 isotopologues in pairs of treatment-naive and chemoresistant cells cultured in medium containing [amide-15N]glutamine or [U-13C]glucose for 1, 3, and 6 hours. ***P < 0.001, ****P < 0.0001. Data are shown as mean and SD (FI). Statistical significance was assessed using a 2-tailed Student’s t test (B and C), 1-way ANOVA with Tukey’s multiple-comparison test (FI). Metabolomics in B was performed once. All other experiments were repeated twice or more.
Figure 3
Figure 3. IMPDH dependence is a generalizable metabolic liability in MYC-driven tumors.
(A) Upper left, MPA IC50 in 8 ASCL1hi and 6 ASCL1lo cell lines. Others, IC50 of MPA and cisplatin in treatment-naive and chemoresistant pairs. *P < 0.05, **P < 0.01, ***P < 0.001. (B) Xenograft growth, displaying mean and SD for tumor volume (n = 5 mice per group). Arrows indicate start of treatment. ****P < 0.0001. (C) Treatment-naive H1436 xenograft growth. Four cycles of cisplatin (5 mg/kg/w) and etoposide (10 mg/kg/w, EC), or mizoribine (100 mg/kg/d) were administered, starting at the arrow. Individual volumes are displayed. **P < 0.01, ****P < 0.0001. (D and E) H1436 tumors pretreated with cisplatin and etoposide in C, then implanted into new mice. The arrow indicates start of treatment. Individual volumes are displayed. **P < 0.01, ****P < 0.0001. (F) mRNA abundance in parental (P) and chemoresistant (CR) H1436 tumors. Individual data points are shown with mean and SD for 3 replicates of 4 tumors from each group. **P < 0.01, ****P < 0.0001. (G) Survival analysis of LAP-MYC mice treated with saline or mizoribine (n = 12 per group). Dosing began on day 26 after birth (arrow). ****P < 0.0001. (H) Abdominal circumference of LAP-MYC mice treated with saline or mizoribine. Measurements were taken on day 42. ***P < 0.001. (I) Livers of LAP-MYC mice treated with saline or mizoribine. Dissections were performed on day 42. Statistical significance was assessed using a 2-tailed Student’s t test (A, F, and H), 2-way ANOVA with Tukey’s multiple comparisons (BE), log-rank (Mantel-Cox) test (G). In panels CE, individual tumors are displayed to demonstrate variability, but statistical comparisons were made with the average and standard error among the groups. Mizoribine treatment of LAP-MYC mice was performed once. All other experiments were repeated twice or more.
Figure 4
Figure 4. Enhanced de novo GTP synthesis promotes Pol I activity in chemoresistant SCLC cells.
(A) Gene sets associated with IMPDH2 mRNA across human cancers in the TCGA database. All KEGG gene sets were included in the analysis. (B) Median OP-Puro signal in DMS53 treatment-naive and chemoresistant cells treated with vehicle or 1 μM MPA, with or without 20 μM guanosine for 12 hours. ***P < 0.001. (C) ATP, GTP, CTP, and UTP levels in DMS53-CR treated with vehicle or 5 μM MPA, with or without 10 μM guanosine for 8 hours. **P < 0.01, ****P < 0.0001. (D) Ribosome abundance in DMS53-CR treated with vehicle, 1 μM MPA, with or without 20 μM guanosine for 48 hours. (E) Abundance of Pol I, II, or III transcripts in DMS53-CR cells treated with vehicle or 5 μM MPA with or without 20 μM guanosine for 8 hours. ***P < 0.001. (F) Abundance of pre-rRNA and median OP-Puro signal in H82 treated with vehicle or 1 μM MPA, with or without 10 μM guanosine. ****P < 0.0001. (G and H) Abundance of GTP and pre-rRNA in DMS53-CR treated with vehicle or 5 μM MPA, with or without 1–5 μM cycloheximide for 6 hours. **P < 0.01, ****P < 0.0001. Data are shown as mean and SD (B, C, and FH), mean and SEM (E). Statistical significance was assessed using 1-way ANOVA with Tukey’s multiple-comparison test (B, C, and EH). All experiments were repeated twice or more.
Figure 5
Figure 5. Pol I localization to the ribosomal DNA is sensitive to GTP abundance.
(A) Localization of RPA1 and RPB1 in DMS53-CR cells treated with vehicle or MPA, with or without guanosine or cycloheximide for 8 hours. Nuclei are stained with DAPI (blue). Original magnification, 63×. (B) Nuclear RPA1 immunofluorescence signals for cells in A. 50–100 cells were quantified in each group. **P < 0.01, ****P < 0.0001. (CF) qPCR for the rDNA promoter and 18S, 5.8S, and 28S coding regions after ChIP with an anti-RPA1 antibody or IgG control. DMS53-CR cells were treated with MPA or vehicle, with or without guanosine for 12 hours. DMS53, the treatment-naive parental cell line of DMS53-CR, is included as a reference. Two independent primer pairs (P1, P2) were designed for each region. *P < 0.05, **P < 0.01, ***P < 0.001, ****P < 0.0001. Data are shown as mean and SD (BF). Statistical significance was assessed using 1-way ANOVA with Tukey’s multiple-comparison test (BF). All experiments were repeated twice or more.
Figure 6
Figure 6. GTP abundance regulates Pol I function in Mychi cells in part through GPN1 and GPN3.
(A) Gene sets correlated with GPN3 or GPN1 mRNA from 9,879 tumors in the pan-cancer TCGA database. Gene set enrichment analysis was performed on the top 2% of genes positively correlated with GPN3 or GPN1. (B) mRNA abundance of Myc, Gpn1, and Gpn3 in SCLCs obtained from genetically engineered mouse models with mutant Trp53, Rb1, and Rbl2 (RPR2) and tumors with mutant Trp53 and Rb1 plus transgenic MycT58A (RPM). *P < 0.05, ****P < 0.0001. (C) GPN1 and GPN3 mRNA abundance in DMS53 and DMS53-CR. **P < 0.01, ***P < 0.001. (D) Abundance of GPN1 and GPN3 in DMS53 and DMS53-CR. (E) Abundance of MYC, IMPDH2, GPN1, and GPN3 in H1436 cells expressing dox-inducible empty vector (EV) or MYC treated with doxycycline at the indicated doses for 6 days. (F) OP-Puro signal in pooled H82 cells expressing an EV or with CRISPR/Cas9-mediated knockout of GPN3 or GPN1. **P < 0.01. (G) Proliferation of H82 pools shown in F. **P < 0.01, ****P < 0.0001. (H) Immunoprecipitation with anti-Myc-tag or mouse IgG followed by Western blot for GPN1 or Myc in H82 cells with CRISPR/Cas9-mediated GPN3 knockout and reexpression of wild-type GPN3. (I) GTP pulldown for wild-type or mutant isoforms of GPN3-Myc or GPN1-Myc. GTP was used to compete for binding of GPN1/3 to GTP-agarose beads. (J) GTP pulldown for GPN3, GPN1, RAS, or RRN3 using H82 lysates with increasing concentrations of GTP to compete for binding to GTP-agarose beads. Data are shown as mean and SD (B, C, F, and G). Statistical significance was assessed using a 2-tailed Student’s t test (B and C), 1-way ANOVA with Tukey’s multiple-comparison test (F and G). All experiments were repeated twice or more.
Figure 7
Figure 7. GTP abundance regulates Pol I function in Mychi cells in part through GPN1 and GPN3.
(A and B) Immunoprecipitation with anti-RPA1 or rabbit IgG followed by Western blot for RPA1, GPN3-Myc, or GPN1-Myc in H82 cells with CRISPR/Cas9-mediated knockout of GPN3 or GPN1 followed by reexpression of wild-type or mutant GPN3 or GPN1. (C) Abundance of native GPN3 and Myc-tagged GPN3 in DMS53-CR cells with CRISPR/Cas9-mediated GPN3 knockout and reexpression of empty vector (EV), wild-type, or mutant GPN3. KO, cells functionally null for GPN3; NT, nontargeting guide RNA. (D and E) Nuclear RPA1 immunofluorescence and sample images of cells from C. ****P < 0.0001. Original magnification, 63×. (F) qPCR for rDNA promoter and IGS sequences after ChIP with anti-RPA1 antibody or IgG control in cells from C. Data are ChIP enrichment with anti-RPA1 relative to IgG control. Data are shown as mean and SD (F). Statistical significance was assessed using 1-way ANOVA with Tukey’s multiple-comparison test (D and F). All experiments were repeated twice or more.
Figure 8
Figure 8. GTP abundance regulates Pol I function in Mychi cells in part through GPN1 and GPN3.
(A) Nuclear RPA1 immunofluorescence signal in H82 cells with CRISPR/Cas9-mediated GPN3 knockout and reexpression of wild-type or mutant GPN3, treated with 1 μM MPA or vehicle for 12 hours. ***P < 0.001, NS, not significant. (B) Abundance of pre-rRNA in H82 cells with CRISPR/Cas9-mediated GPN3 knockout and reexpression of wild-type or mutant GPN3, treated with 0, 1, or 5 μM MPA for 8 hours. **P < 0.01, ***P < 0.001. (C) OP-Puro signal in H82 cells with CRISPR/Cas9-mediated GPN3 knockout and reexpression of wild-type or mutant GPN3, treated with 0, 1, or 5 μM MPA for 24 hours. A 30-minute cycloheximide treatment was used as a positive control. ***P < 0.001, ****P < 0.0001. (D and E) MPA IC50 in GPN3- or GPN1-deficient H82 cells reconstituted with empty vector (EV), wild-type, or mutant GPN3 or GPN1. **P < 0.01, ***P < 0.001. (F) GTP functions as a metabolic gate for Pol I function and ribosome biogenesis in cells with oncogenic MYC. Data are shown as mean and SD (AE). Statistical significance was assessed using 1-way ANOVA with Tukey’s multiple-comparison test (AE). All experiments were repeated twice or more.

References

    1. Dang CV. MYC on the path to cancer. Cell. 2012;149(1):22–35. doi: 10.1016/j.cell.2012.03.003. - DOI - PMC - PubMed
    1. Schaub FX, et al. Pan-cancer alterations of the MYC oncogene and its proximal network across the Cancer Genome Atlas. Cell Syst. 2018;6(3):282–300.e2. doi: 10.1016/j.cels.2018.03.003. - DOI - PMC - PubMed
    1. Herranz D, et al. A NOTCH1-driven MYC enhancer promotes T cell development, transformation and acute lymphoblastic leukemia. Nat Med. 2014;20(10):1130–1137. doi: 10.1038/nm.3665. - DOI - PMC - PubMed
    1. Muncan V, et al. Rapid loss of intestinal crypts upon conditional deletion of the Wnt/Tcf-4 target gene c-Myc. Mol Cell Biol. 2006;26(22):8418–8426. doi: 10.1128/MCB.00821-06. - DOI - PMC - PubMed
    1. Gabay M, Li Y, Felsher DW. MYC activation is a hallmark of cancer initiation and maintenance. Cold Spring Harb Perspect Med. 2014;4(6):a014241. doi: 10.1101/cshperspect.a014241. - DOI - PMC - PubMed

Publication types

MeSH terms