. 2020 Oct 20;16(10):e1008357.
doi: 10.1371/journal.pcbi.1008357. eCollection 2020 Oct.

Rapid prediction of crucial hotspot interactions for icosahedral viral capsid self-assembly by energy landscape atlasing validated by mutagenesis

Affiliations

Rapid prediction of crucial hotspot interactions for icosahedral viral capsid self-assembly by energy landscape atlasing validated by mutagenesis

Ruijin Wu et al. PLoS Comput Biol. .

Abstract

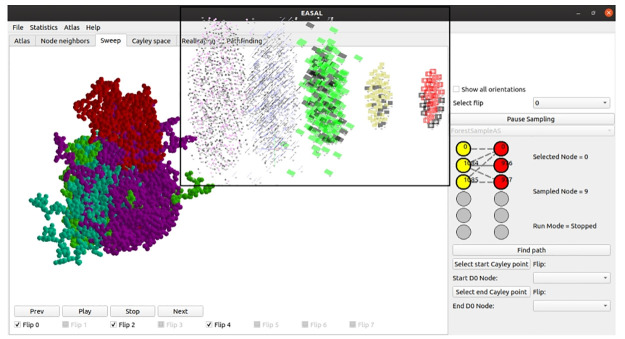
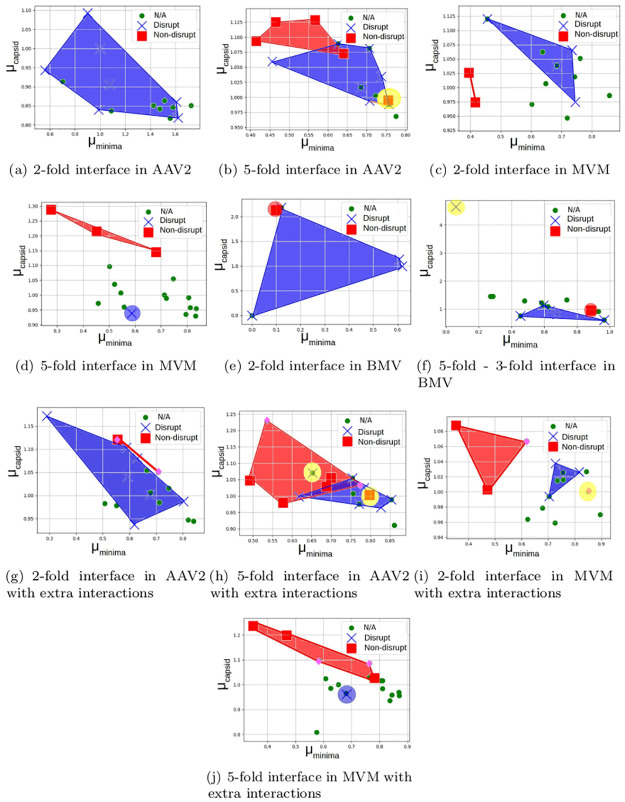
Icosahedral viruses are under a micrometer in diameter, their infectious genome encapsulated by a shell assembled by a multiscale process, starting from an integer multiple of 60 viral capsid or coat protein (VP) monomers. We predict and validate inter-atomic hotspot interactions between VP monomers that are important for the assembly of 3 types of icosahedral viral capsids: Adeno Associated Virus serotype 2 (AAV2) and Minute Virus of Mice (MVM), both T = 1 single stranded DNA viruses, and Bromo Mosaic Virus (BMV), a T = 3 single stranded RNA virus. Experimental validation is by in-vitro, site-directed mutagenesis data found in literature. We combine ab-initio predictions at two scales: at the interface-scale, we predict the importance (cruciality) of an interaction for successful subassembly across each interface between symmetry-related VP monomers; and at the capsid-scale, we predict the cruciality of an interface for successful capsid assembly. At the interface-scale, we measure cruciality by changes in the capsid free-energy landscape partition function when an interaction is removed. The partition function computation uses atlases of interface subassembly landscapes, rapidly generated by a novel geometric method and curated opensource software EASAL (efficient atlasing and search of assembly landscapes). At the capsid-scale, cruciality of an interface for successful assembly of the capsid is based on combinatorial entropy. Our study goes all the way from resource-light, multiscale computational predictions of crucial hotspot inter-atomic interactions to validation using data on site-directed mutagenesis' effect on capsid assembly. By reliably and rapidly narrowing down target interactions, (no more than 1.5 hours per interface on a laptop with Intel Core i5-2500K @ 3.2 Ghz CPU and 8GB of RAM) our predictions can inform and reduce time-consuming in-vitro and in-vivo experiments, or more computationally intensive in-silico analyses.


Conflict of interest statement

The authors have declared that no competing interests exist.

Figures

Fig 1
Fig 1. Structures of a T = 1 and T = 3 viruses, and a cartoon showing the types of VP monomers and interfaces in the former.
(a) X-ray structure of AAV2 (a T = 1 virus). All VP monomers are identical, and the VP monomers colored using the non-dominant colors are used only to highlight the 3 types of interfaces. VP monomers at the 5-fold interface are colored shades of green, light green and blue form a 2-fold interface assembly, and dark green, blue and yellow pairwise form 3-fold interface assemblies. (b) X-ray structure of BMV (a T = 3 virus) showing 3 types of VP monomers (green, blue, and red). (c) A cartoon of a T = 3 virus showing the 3 types of VP monomers (green, blue, and red), 7 types of interfaces, and 3 symmetries (shown in pink). See the introduction.
Fig 2
Fig 2. Flow chart of the methodology in this paper and connections to existing methods.
See the introduction and related work sections.
Fig 3
Fig 3. Screenshot of the EASAL software showing all configurations in an active constraint region in the atlas of the interface assembly system of the two VP monomers shown on top right.
The region’s active constraint graph is shown at bottom right, with red and yellow representing atoms in different VP monomers, the single bold edge representing a single active constraint or interaction c, and the dashed lines representing the 5 Cayley parameters that are used to convexify this effectively 5-dimensional region. On the main screen, the red VP monomer is held fixed and all of the second VP monomer’s relative positions (satisfying the one active constraint c) are shown. The 3 different colors (cyan, green and purple) of the second VP monomer sweeps represent distinct orientations within the same active constraint region. (inset) Atlas with changes when an interaction is disabled. Active constraint regions (nodes of the atlas) of different dimensions are shown in different colors, with red nodes representing regions with 2 active constraints, or 4 effective dimensions, and each of the successive strata (from right to left) showing regions of one more active constraint, or one lower energy level or effective dimension. The left most are the 0-dimensional or lowest energy regions, each of which is the bottom of a potential energy basin, with all its ancestor regions participating in the basin. The black nodes are the active constraint regions that disappear from the atlas due to the removal of a candidate inter-atomic interaction. See the section on entropy computation and the section on interaction cruciality.
Fig 4
Fig 4. An assembly tree of a T = 3 viral capsid.
The root node represents a successfully assembled viral capsid. Each internal node represents an interface assembly system that contains a stable subassembly configuration that is part of the known, successfully assembled capsid configuration. Children of a node are the participating multimers for the node’s interface assembly system. The leaf nodes represent the VP monomers. To the right of the nodes are their candidate stable subassembly configurations taken from the T = 3 BMV X-ray capsid structure. At internal nodes, a choice is made between multiple candidate interface assembly systems. On the left we highlight an internal node with 2 available choices for hexamer-hexamer interfaces, of which one is chosen: the inset shows the choices—a single VP dimer interface highlighted in red; and two VP dimer interfaces, highlighted in yellow. See the background section on combinatorial entropy.
Fig 5
Fig 5. Prediction using cruciality bar-codes described in the section on interaction cruciality for two VP monomers assembling across a hexamer interface in BMV.
Each node in the atlas roadmap in the middle represents an active constraint region (macrostate) in EASAL. Example active constraint graphs are shown at far left: the yellow and red circles represent atoms participating in active constraints (interactions) in the two VP monomers. At each successive level, the number of active constraints increases by 1 and the energy level and effective dimension decrease by 1. The atlas nodes in the bottom-most row represent the 0-dimensional, lowest energy, stable assembly configurations; example configurations shown below them. Their total number (for a given interface s, on removal of a given interaction or constraint r) gives νminimar,s in the computation of the cruciality bar-code. Each such configuration together with nearby higher-energy configurations in all of their ancestor nodes constitute one potential energy basin. Their sum, across all basins, weighted by energy level gives the denominator of νcapsidr,s. The rightmost of the stable assembly configurations at the bottom corresponds to the true realization. Above it, the 3 solid configurations and the transparent sweeps around them show the closest configurations to the true realization in successively higher energy regions in its basin (one region each for 3 energy levels shown). To the far left, these sweeps are shown as orange highlights in the corresponding Cayley parameterized regions. The colorful basin plot shows the total weighted configurations in the true basin, stratified by dimension or energy level. Their sum is the numerator of νcapsidr,s.
Fig 6
Fig 6. The dual graphs of T = 1 and T = 3 capsid polyhedra.
Faces of the capsid polyhedra are shown with black edges and the colored edges give the dual graph. See the section on interaction cruciality.
Fig 7
Fig 7. T = 1 capsid polyhedra showing all 3 possible connectivity pathways.
See the section on interface cruciality.
Fig 8
Fig 8. T = 3 capsid polyhedra.
(a) Only the 5 fold and 3 fold interfaces are shown. This does not correspond to a connectivity pathway. (b) 5 fold, 3 fold and 5 fold-3 fold 2 interfaces are shown. This corresponds to a connectivity pathway. See the section on interface cruciality.
Fig 9
Fig 9. AAV2 [91], MVM [92], and BMV [93] monomers showing the list of residues that were analyzed in this manuscript.
Fig 10
Fig 10. Cruciality bar-codes.
Each row shows μminimar, μcapsidr and their ratio in two BMV 5-fold interface assembly systems (VP monomer-monomer and VP monomer-dimer shown at bottom right) where the interaction r—listed as the row label—is removed. The row labeled ‘None’ is the “wild-type” assembly system where no interaction has been removed, whose νminima and νcapsid values have been normalized. The rows are sorted according to the largest value of μcapsid. See the section on output of cruciality prediction.
Fig 11
Fig 11. Validation of direct interface-scale cruciality prediction: 2D plot of cruciality bar-codes for each interface.
The blue cross marks and red squares are residues found, through mutagenesis, to disrupt and non-disrupt assembly. The green circles are residues on which no mutagenesis was performed. The convex hulls are computational predictions from our method. The blue convex hull delineates the residues that are shown to disrupt, the red convex hull delineates the residues that are shown to not disrupt the assembly process, yellow convex hull delineates the outliers. In (g)-(j), the pink diamonds are the extra interactions that were added to test for biases arising due to the paucity of mutagenesis data. The black line shows a linear separation of the crucial and non-crucial residues. See the section on validating the first two-scale prediction.
Fig 12
Fig 12. Validation of two-scale cruciality prediction using our statistical model for (a) AAV2, (b) MVM, and (c) BMV.
The residues listed higher in the table are computationally predicted through our method as more crucial and the ones lower in the table are predicted as less crucial. Experimental mutagenesis results are used to mark all the residues by color. Blue indicates that the residue disrupts assembly while red indicates that it does not. See the section on validating the second two-scale prediction.
Fig 13
Fig 13. Full list of two-scale cruciality predictions using our statistical model for (a) AAV2, (b) MVM, and (c) BMV.
The residues listed higher in the table are computationally predicted through our method as more crucial and the ones lower in the table are predicted as less crucial. Experimental mutagenesis results are used to mark all the residues by color. Blue indicates that the residue disrupts assembly while red indicates that it does not. White indicates residues that do not yet have mutagenesis results for validation at the time of this writing. See the section on validating the second two-scale prediction.

Similar articles

Cited by

References

    1. Schlicksup CJ, Wang JCY, Francis S, Venkatakrishnan B, Turner WW, VanNieuwenhze M, et al. Hepatitis B virus core protein allosteric modulators can distort and disrupt intact capsids. Elife. 2018;7:e31473 10.7554/eLife.31473 - DOI - PMC - PubMed
    1. Mietzsch M, Agbandje-McKenna M. The Good That Viruses Do. Annual Review of Virology. 2017;4(1):iii–v. 10.1146/annurev-vi-04-071217-100011 - DOI - PubMed
    1. Caspar DL, Klug A. Physical principles in the construction of regular viruses In: Cold Spring Harbor symposia on quantitative biology. vol. 27 Cold Spring Harbor Laboratory Press; 1962. p. 1–24. - PubMed
    1. Elrad OM, Hagan MF. Encapsulation of a polymer by an icosahedral virus. Physical biology. 2010;7(4):045003 10.1088/1478-3975/7/4/045003 - DOI - PMC - PubMed
    1. Reguera D, Hernández-Rojas J, Llorente JG. Kinetics of empty viral capsid assembly in a minimal model. Soft matter. 2019;15(36):7166–7172. 10.1039/C9SM01593K - DOI - PubMed

Publication types

MeSH terms

Substances