

Variation in racial/ethnic disparities in COVID-19 mortality by age in the United States: A cross-sectional study
- PMID: 33079941
- PMCID: PMC7575091
- DOI: 10.1371/journal.pmed.1003402
Variation in racial/ethnic disparities in COVID-19 mortality by age in the United States: A cross-sectional study
Erratum in
-
Correction: Variation in racial/ethnic disparities in COVID-19 mortality by age in the United States: A cross-sectional study.PLoS Med. 2021 Feb 4;18(2):e1003541. doi: 10.1371/journal.pmed.1003541. eCollection 2021 Feb. PLoS Med. 2021. PMID: 33539382 Free PMC article.
Abstract
Background: In the United States, non-Hispanic Black (NHB), Hispanic, and non-Hispanic American Indian/Alaska Native (NHAIAN) populations experience excess COVID-19 mortality, compared to the non-Hispanic White (NHW) population, but racial/ethnic differences in age at death are not known. The release of national COVID-19 death data by racial/ethnic group now permits analysis of age-specific mortality rates for these groups and the non-Hispanic Asian or Pacific Islander (NHAPI) population. Our objectives were to examine variation in age-specific COVID-19 mortality rates by racial/ethnicity and to calculate the impact of this mortality using years of potential life lost (YPLL).
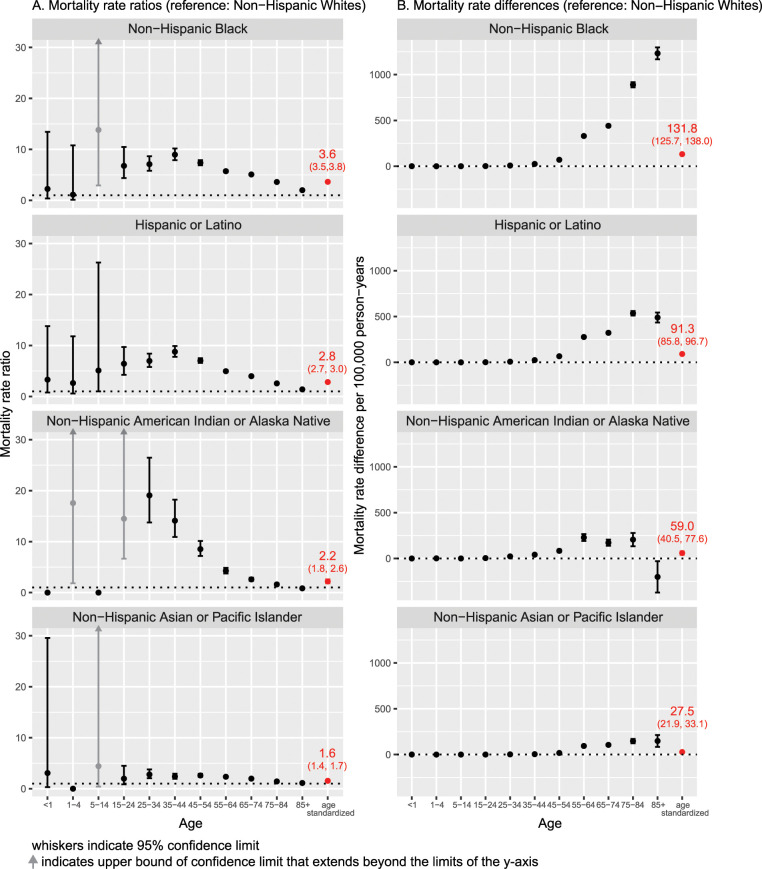
Methods and findings: This cross-sectional study used the recently publicly available data on US COVID-19 deaths with reported race/ethnicity, for the time period February 1, 2020, to July 22, 2020. Population data were drawn from the US Census. As of July 22, 2020, the number of COVID-19 deaths equaled 68,377 for NHW, 29,476 for NHB, 23,256 for Hispanic, 1,143 for NHAIAN, and 6,468 for NHAPI populations; the corresponding population sizes were 186.4 million, 40.6 million, 2.6 million, 19.5 million, and 57.7 million. Age-standardized rate ratios relative to NHW were 3.6 (95% CI 3.5, 3.8; p < 0.001) for NHB, 2.8 (95% CI 2.7, 3.0; p < 0.001) for Hispanic, 2.2 (95% CI 1.8, 2.6; p < 0.001) for NHAIAN, and 1.6 (95% CI 1.4, 1.7; p < 0.001) for NHAP populations. By contrast, NHB rate ratios relative to NHW were 7.1 (95% CI 5.8, 8.7; p < 0.001) for persons aged 25-34 years, 9.0 (95% CI 7.9, 10.2; p < 0.001) for persons aged 35-44 years, and 7.4 (95% CI 6.9, 7.9; p < 0.001) for persons aged 45-54 years. Even at older ages, NHB rate ratios were between 2.0 and 5.7. Similarly, rate ratios for the Hispanic versus NHW population were 7.0 (95% CI 5.8, 8.7; p < 0.001), 8.8 (95% CI 7.8, 9.9; p < 0.001), and 7.0 (95% CI 6.6, 7.5; p < 0.001) for the corresponding age strata above, with remaining rate ratios ranging from 1.4 to 5.0. Rate ratios for NHAIAN were similarly high through age 74 years. Among NHAPI persons, rate ratios ranged from 2.0 to 2.8 for persons aged 25-74 years and were 1.6 and 1.2 for persons aged 75-84 and 85+ years, respectively. As a consequence, more YPLL before age 65 were experienced by the NHB and Hispanic populations than the NHW population-despite the fact that the NHW population is larger-with a ratio of 4.6:1 and 3.2:1, respectively, for NHB and Hispanic persons. Study limitations include likely lag time in receipt of completed death certificates received by the Centers for Disease Control and Prevention for transmission to NCHS, with consequent lag in capturing the total number of deaths compared to data reported on state dashboards.
Conclusions: In this study, we observed racial variation in age-specific mortality rates not fully captured with examination of age-standardized rates alone. These findings suggest the importance of examining age-specific mortality rates and underscores how age standardization can obscure extreme variations within age strata. To avoid overlooking such variation, data that permit age-specific analyses should be routinely publicly available.
Conflict of interest statement
The authors have declared no competing interests exist.
Figures
Comment in
-
Tired of science being ignored? Get political.Nature. 2020 Oct;586(7829):337. doi: 10.1038/d41586-020-02854-9. Nature. 2020. PMID: 33051602 No abstract available.
References
-
- Eligon J, Burch ADS, Searcey D, Oppel RA Jr. Black Americans face alarming rates of virus infection in some states. New York Times. 2020. April 14 [cited 2020 Jun 24]. Available from: https://www.nytimes.com/2020/04/07/us/coronavirus-race.html.
-
- Bauer S. Milwaukee’s black community hit hard by coronavirus. AP News. 2020. March 27 [cited 2020 Jun 24]. Available from: https://apnews.com/b52e4e9a63d64e3a25109f09010508b6.
-
- Krieger N, Gonsalves G, Bassett MT, Hanage W. Krumholz HM. The fierce urgency of now: closing glaring gaps in us surveillance data on COVID-19. Health Affairs Blog, 2020. April 14 [cited 2020 Jun 24]. Available from: https://www.healthaffairs.org/do/10.1377/hblog20200414.238084/full/. - DOI
-
- New York City Department of Health and Mental Hygiene. COVID-19: data. New York: New York City Department of Health and Mental Hygiene; 2020. [cited 2020 Jun 24]. Available from: https://www1.nyc.gov/site/doh/covid/covid-19-data.page.
MeSH terms
LinkOut - more resources
Full Text Sources
Medical
Research Materials
