

Rapid Epidemiological Analysis of Comorbidities and Treatments as risk factors for COVID-19 in Scotland (REACT-SCOT): A population-based case-control study
- PMID: 33079969
- PMCID: PMC7575101
- DOI: 10.1371/journal.pmed.1003374
Rapid Epidemiological Analysis of Comorbidities and Treatments as risk factors for COVID-19 in Scotland (REACT-SCOT): A population-based case-control study
Abstract
Background: The objectives of this study were to identify risk factors for severe coronavirus disease 2019 (COVID-19) and to lay the basis for risk stratification based on demographic data and health records.
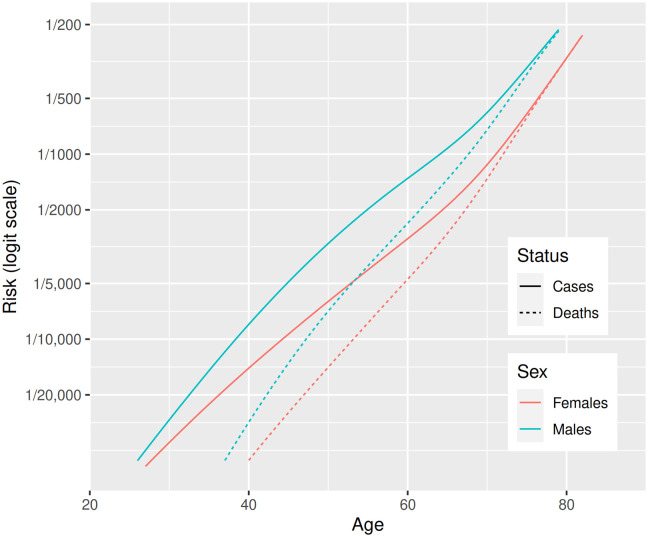
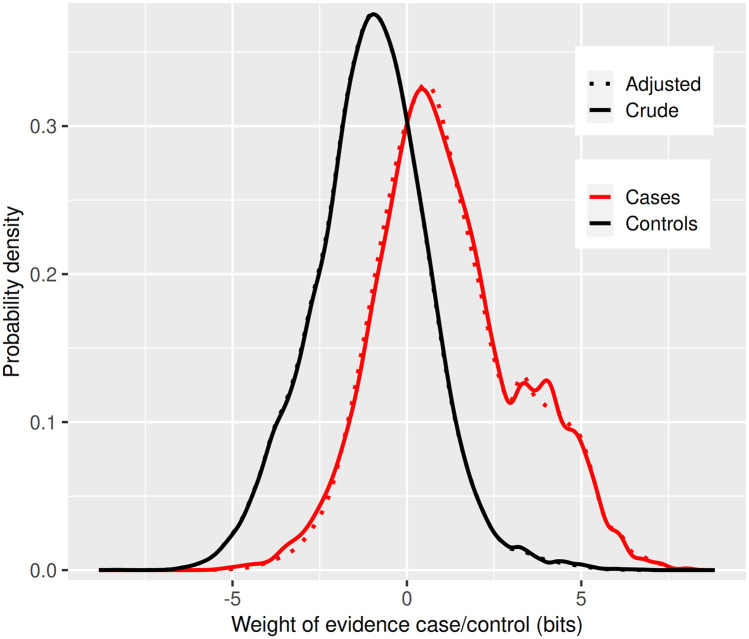
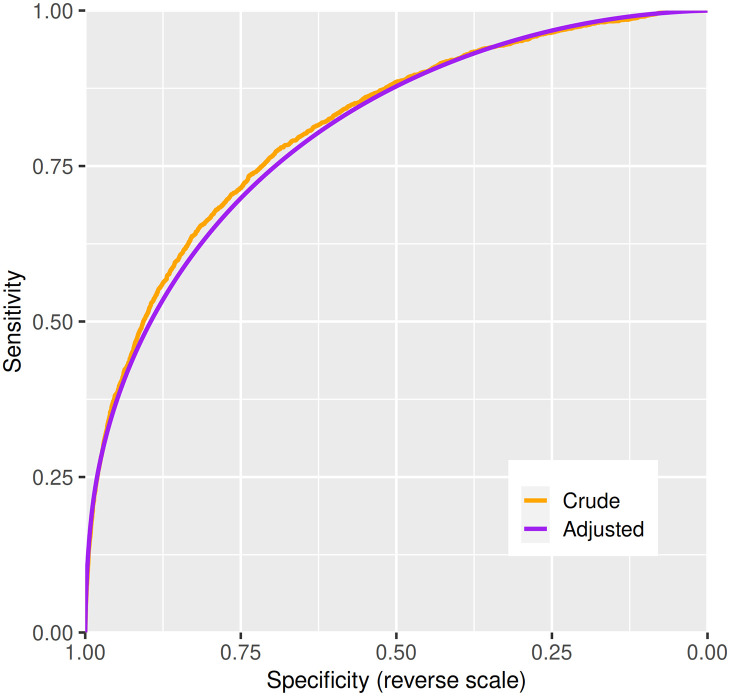
Methods and findings: The design was a matched case-control study. Severe COVID-19 was defined as either a positive nucleic acid test for severe acute respiratory syndrome coronavirus 2 (SARS-CoV-2) in the national database followed by entry to a critical care unit or death within 28 days or a death certificate with COVID-19 as underlying cause. Up to 10 controls per case matched for sex, age, and primary care practice were selected from the national population register. For this analysis-based on ascertainment of positive test results up to 6 June 2020, entry to critical care up to 14 June 2020, and deaths registered up to 14 June 2020-there were 36,948 controls and 4,272 cases, of which 1,894 (44%) were care home residents. All diagnostic codes from the past 5 years of hospitalisation records and all drug codes from prescriptions dispensed during the past 240 days were extracted. Rate ratios for severe COVID-19 were estimated by conditional logistic regression. In a logistic regression using the age-sex distribution of the national population, the odds ratios for severe disease were 2.87 for a 10-year increase in age and 1.63 for male sex. In the case-control analysis, the strongest risk factor was residence in a care home, with rate ratio 21.4 (95% CI 19.1-23.9, p = 8 × 10-644). Univariate rate ratios for conditions listed by public health agencies as conferring high risk were 2.75 (95% CI 1.96-3.88, p = 6 × 10⁻⁹) for type 1 diabetes, 1.60 (95% CI 1.48-1.74, p = 8 × 10-30) for type 2 diabetes, 1.49 (95% CI 1.37-1.61, p = 3 × 10-21) for ischemic heart disease, 2.23 (95% CI 2.08-2.39, p = 4 × 10-109) for other heart disease, 1.96 (95% CI 1.83-2.10, p = 2 × 10-78) for chronic lower respiratory tract disease, 4.06 (95% CI 3.15-5.23, p = 3 × 10-27) for chronic kidney disease, 5.4 (95% CI 4.9-5.8, p = 1 × 10-354) for neurological disease, 3.61 (95% CI 2.60-5.00, p = 2 × 10-14) for chronic liver disease, and 2.66 (95% CI 1.86-3.79, p = 7 × 10⁻⁸) for immune deficiency or suppression. Seventy-eight percent of cases and 52% of controls had at least one listed condition (51% of cases and 11% of controls under age 40). Severe disease was associated with encashment of at least one prescription in the past 9 months and with at least one hospital admission in the past 5 years (rate ratios 3.10 [95% CI 2.59-3.71] and 2.75 [95% CI 2.53-2.99], respectively) even after adjusting for the listed conditions. In those without listed conditions, significant associations with severe disease were seen across many hospital diagnoses and drug categories. Age and sex provided 2.58 bits of information for discrimination. A model based on demographic variables, listed conditions, hospital diagnoses, and prescriptions provided an additional 1.07 bits (C-statistic 0.804). A limitation of this study is that records from primary care were not available.
Conclusions: We have shown that, along with older age and male sex, severe COVID-19 is strongly associated with past medical history across all age groups. Many comorbidities beyond the risk conditions designated by public health agencies contribute to this. A risk classifier that uses all the information available in health records, rather than only a limited set of conditions, will more accurately discriminate between low-risk and high-risk individuals who may require shielding until the epidemic is over.
Conflict of interest statement
I have read the journal’s policy and the authors of this manuscript have the following competing interests:HC receives research support and honoraria and is a member of advisory panels or speaker bureaus for Sanofi Aventis, Regeneron, Novartis, Novo-Nordisk and Eli Lilly. HC receives or has recently received non-binding research support from AstraZeneca and Novo-Nordisk. SH received honoraria from Gilead. TMC is a Diabetes UK ‘Sir George Alberti Clinical Research Fellow’ (Grant number: 18/0005786), although the views represented in this article are his own and not those of Diabetes UK. CR reports grants from Public Health Scotland, grants from MRC, during the conduct of the study; and Member of Chief Medical Officer of Scotland Scientific Advisory Group for COVID19 Member of SPI-M a subgroup of the UK Scientific Advisory Group for Epidemics Member of MHRA Advisory Group for Vaccine Safety. All other co-authors declare that no competing interest exists.
Figures
References
-
- Docherty AB, Harrison EM, Green CA, Hardwick HE, Pius R, Norman L, et al. Features of 20 133 UK patients in hospital with covid-19 using the ISARIC WHO Clinical Characterisation Protocol: Prospective observational cohort study. BMJ (Clinical research ed). 2020;369: m1985 10.1136/bmj.m1985 - DOI - PMC - PubMed
-
- McGoogan C, Steafel E. Why are young, healthy people dying of coronavirus? The symptoms to look out for. The Telegraph. 2020.
MeSH terms
Grants and funding
LinkOut - more resources
Full Text Sources
Miscellaneous
