. 2021 Jul 1;73(1):e215-e223.
doi: 10.1093/cid/ciaa1599.

A Comparative Analysis of Statistical Methods to Estimate the Reproduction Number in Emerging Epidemics, With Implications for the Current Coronavirus Disease 2019 (COVID-19) Pandemic

Affiliations

A Comparative Analysis of Statistical Methods to Estimate the Reproduction Number in Emerging Epidemics, With Implications for the Current Coronavirus Disease 2019 (COVID-19) Pandemic

Megan O'Driscoll et al. Clin Infect Dis. .

Abstract

Background: As the severe acute respiratory syndrome coronavirus 2 (SARS-CoV-2) pandemic continues its rapid global spread, quantification of local transmission patterns has been, and will continue to be, critical for guiding the pandemic response. Understanding the accuracy and limitations of statistical methods to estimate the basic reproduction number, R0, in the context of emerging epidemics is therefore vital to ensure appropriate interpretation of results and the subsequent implications for control efforts.

Methods: Using simulated epidemic data, we assess the performance of 7 commonly used statistical methods to estimate R0 as they would be applied in a real-time outbreak analysis scenario: fitting to an increasing number of data points over time and with varying levels of random noise in the data. Method comparison was also conducted on empirical outbreak data, using Zika surveillance data from the 2015-2016 epidemic in Latin America and the Caribbean.

Results: We find that most methods considered here frequently overestimate R0 in the early stages of epidemic growth on simulated data, the magnitude of which decreases when fitted to an increasing number of time points. This trend of decreasing bias over time can easily lead to incorrect conclusions about the course of the epidemic or the need for control efforts.

Conclusions: We show that true changes in pathogen transmissibility can be difficult to disentangle from changes in methodological accuracy and precision in the early stages of epidemic growth, particularly for data with significant over-dispersion. As localized epidemics of SARS-CoV-2 take hold around the globe, awareness of this trend will be important for appropriately cautious interpretation of results and subsequent guidance for control efforts.

Keywords: SARS-CoV-2; emerging epidemics; estimation method comparison; outbreak analysis; reproduction number.


Figures

Figure 1.
Figure 1.
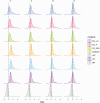
Density distributions of bias in R0 estimates (estimated R0—actual R0) obtained when fitting to the case time series on simulated data, without noise, by method and time point (in weeks), using only results from simulations that peaked at or after 15 weeks (n = 145). Columns represent the number of data points (weeks) each method was fitted to in the case time series (6, 9, 12, and 15 weeks, approximating to 2, 3, 4, and 5 generation times), and colors represent the method. Black dashed lines highlight the ideal bias value of 0, and colored lines represent method-specific values of median bias. Abbreviations: BR, Bettencourt and Ribeiro; EG_Lin, linear exponential growth rate method; EG_MLE, maximum likelihood exponential growth rate method; EG_P, Poisson exponential growth rate method; WP, White and Pagano method; WT, Wallinga and Teunis.
Figure 2.
Figure 2.
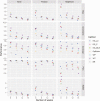
Comparative analysis of the performance of the 6 methods at different stages of the epidemic. Columns represent the 3 data noise scenarios explored (no noise, Poisson noise, and negative binomial noise). Rows represent different performance metrics: absolute bias (the absolute average difference between estimated and true R0 values), uncertainty (95% confidence interval width), coverage (proportion of times in which the true R0 value is within the estimated 95% confidence intervals), PCC, and RMSE. Abbreviations: BR, Bettencourt and Ribeiro; EG_Lin, linear exponential growth rate method; EG_MLE, maximum likelihood exponential growth rate method; EG_P, Poisson exponential growth rate method; PCC, Pearson correlation coefficient; RMSE, root mean squared error; WP, White and Pagano method; WT, Wallinga and Teunis.
Figure 3.
Figure 3.
R0 estimates obtained from each of the 6 methods, fitted at different stages of the 2015–2016 Zika epidemics in French Guyana, Martinique, Puerto Rico, and the US Virgin Islands. The top panel for each country shows the time series of reported Zika cases, with dashed lines showing the different stages at which each method was fitted to the data (first 6, 9, 12, etc.; in weeks) up to the peak of the epidemic, marked by the black line. The bottom panel for each country shows the mean and 95% confidence intervals of the R0 estimates produced with each method fitted to each time series. Abbreviations: BR, Bettencourt and Ribeiro; EG_Lin, linear exponential growth rate method; EG_MLE, maximum likelihood exponential growth rate method; EG_P, Poisson exponential growth rate method; WP, White and Pagano method; WT, Wallinga and Teunis.
Figure 4.
Figure 4.
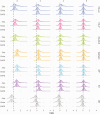
Density distribution of bias in R0 estimates (estimated R0—actual R0) obtained when fitting to the case time series of simulated data, without noise, by method and time point (in approximate generations), using only results from simulations that peaked at or after 15 weeks. Columns represent the approximate number of disease generations fitted in the case time series, and colors represent the method. Black dashed lines highlight the ideal bias value of 0, and colored lines represent method-specific values of median bias. The generation time distribution used, both for data simulation and method fitting, is shown on the y-axis. Mean and standard deviation, in days, for generation time distributions used: Zika (20 ± 7.4); Ebola (16 ± 9.3); and SARS (8 ± 3.8). Abbreviations: BR, Bettencourt and Ribeiro; EG_Lin, linear exponential growth rate method; EG_MLE, maximum likelihood exponential growth rate method; EG_P, Poisson exponential growth rate method; SARS, severe acute respiratory syndrome; WP, White and Pagano method; WT, Wallinga and Teunis.

Similar articles

Cited by

References

    1. Heesterbeek JA. A brief history of R0 and a recipe for its calculation. Acta Biotheor 2002; 50:189–204. - PubMed
    1. Anderson RM, May RM.. Infectious diseases of humans : dynamics and control. Oxford, United Kingdom: Oxford University Press, 1991.
    1. Fraser C, Riley S, Anderson RM, Ferguson NM. Factors that make an infectious disease outbreak controllable. Proc Natl Acad Sci USA 2004; 101:6146–51. - PMC - PubMed
    1. Funk S, Camacho A, Eggo RM, et al. . The impact of control strategies and behavioural changes on the elimination of Ebola from Lofa county, Liberia. Philos Trans R Soc B Biol Sci 2017; 372. - PMC - PubMed
    1. Nishiura H, Chowell G, Safan M, Castillo-Chavez C. Pros and cons of estimating the reproduction number from early epidemic growth rate of influenza A (H1N1) 2009. Theor Biol Med Model 2010; 7:1. - PMC - PubMed

Publication types