. 2020 Nov 17;36(45):13439-13447.
doi: 10.1021/acs.langmuir.0c01813. Epub 2020 Oct 20.

Structural Changes in Films of Pulmonary Surfactant Induced by Surfactant Vesicles

Affiliations

Structural Changes in Films of Pulmonary Surfactant Induced by Surfactant Vesicles

Konstantin Andreev et al. Langmuir. .

Abstract

When compressed by the shrinking alveolar surface area during exhalation, films of pulmonary surfactant in situ reduce surface tension to levels at which surfactant monolayers collapse from the surface in vitro. Vesicles of pulmonary surfactant added below these monolayers slow collapse. X-ray scattering here determined the structural changes induced by the added vesicles. Grazing incidence X-ray diffraction on monolayers of extracted calf surfactant detected an ordered phase. Mixtures of dipalmitoyl phosphatidylcholine and cholesterol, but not the phospholipid alone, mimic that structure. At concentrations that stabilize the monolayers, vesicles in the subphase had no effect on the unit cell, and X-ray reflection showed that the film remained monomolecular. The added vesicles, however, produced a concentration-dependent increase in the diffracted intensity. These results suggest that the enhanced resistance to collapse results from enlargement by the additional material of the ordered phase.


Conflict of interest statement

The authors declare no competing financial interest.

Figures
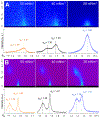
Figure 1.
Figure 1.
GIXD from monolayers of (A) CLSE and (B) DPPC spread from organic solvent and compressed to different γ. The upper row gives the imaged intensities. The lower row provides the variation of intensities integrated over qz. Continuous curves represent the best fits to the data using Lorentz–Gauss crossed peaks. Symbols give mean ± SD, with errors assumed to be Poisson-distributed.
Figure 2.
Figure 2.
Effect of the subphase material on the diffracted intensity. (A) GIXD from CLSE films at γ = 26 mN·m−1. Adsorbed films formed from dispersed vesicles injected below a clean interface to achieve the final concentrations indicated in brackets. Deposited films were formed by adding droplets of the dispersed material on the air/water interface. The dispersion had the same concentration and volume that was added to the subphase to reach the concentration there of 1.50 mM phospholipid. Symbols indicate experimental measurements with errors assumed to have Poisson distributions. Continuous curves give the best fit of Lorentz–Gauss peak functions to the data after subtraction of background. Fits were weighted by their statistical significance. The diagram in the insert represents the unit cell of the hexagonal lattice. a, b, and φ = parameters of the unit cell; τ = angle of molecular tilt from the surface normal. (B) Cartoon illustrating a possible arrangement of lipids within the crystalline domains (colored) and in the surrounding disordered phase (gray).
Figure 3.
Figure 3.
Effect of the subphase material on the transverse structure for films of CLSE. (A) XRR. Experiments measured the reflectivity from the same films used to obtain GIXD (Figure 2). The reflected intensity, R, is normalized relative to the Fresnel reflectivity, RF, for an ideally flat air–water interface. Symbols give measured values, where vertical bars indicate the error assuming Poisson distributions about the counted intensity. The continuous curves give the best fit to the data by the Fourier transform of the two-slab model of electron density. (B) Electron density profiles, normalized relative to the electron density of the aqueous buffer (ρaqua ~ 0.334 e·Å−3), derived from the data in (A). Z denotes the distance from the top of the upper slab (slab 1). The superimposed molecular cartoon suggests the general orientation of lipids in the monolayer.

Similar articles

Cited by

References

    1. Goerke J; Clements JA Alveolar surface tension and lung surfactant. In Handbook of Physiology—The Respiratory System Vol III, Part 1; Macklem PT, Mead J, Ed.; American Physiological Society: Washington, D.C., 1985; Vol. III, pp 247–261.
    1. Bastacky J; Lee CY; Goerke J; Koushafar H; Yager D; Kenaga L; Speed TP; Chen Y; Clements JA Alveolar lining layer is thin and continuous: low-temperature scanning electron microscopy of rat lung. J. Appl. Physiol 1995, 79, 1615–1628. - PubMed
    1. Fisher MJ; Wilson MF; Weber KC Determination of alveolar surface area and tension from in situ pressure-volume data. Respir. Physiol 1970, 10, 159–171. - PubMed
    1. Horie T; Hildebrandt J Dynamic compliance, limit cycles, and static equilibria of excised cat lung. J. Appl. Physiol 1971, 31, 423–430. - PubMed
    1. Schürch S; Goerke J; Clements JA Direct determination of surface tension in the lung. Proc. Natl. Acad. Sci. U.S.A 1976, 73, 4698–4702. - PMC - PubMed

Publication types