. 2020 Dec 7;55(5):629-647.e7.
doi: 10.1016/j.devcel.2020.09.025. Epub 2020 Oct 19.

Functional Diversification of SRSF Protein Kinase to Control Ubiquitin-Dependent Neurodevelopmental Signaling

Affiliations

Functional Diversification of SRSF Protein Kinase to Control Ubiquitin-Dependent Neurodevelopmental Signaling

Francisco Bustos et al. Dev Cell. .

Abstract

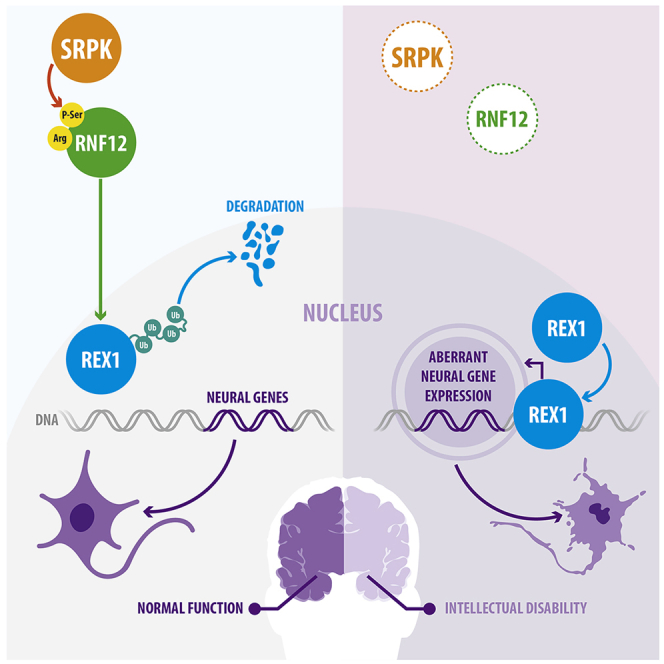
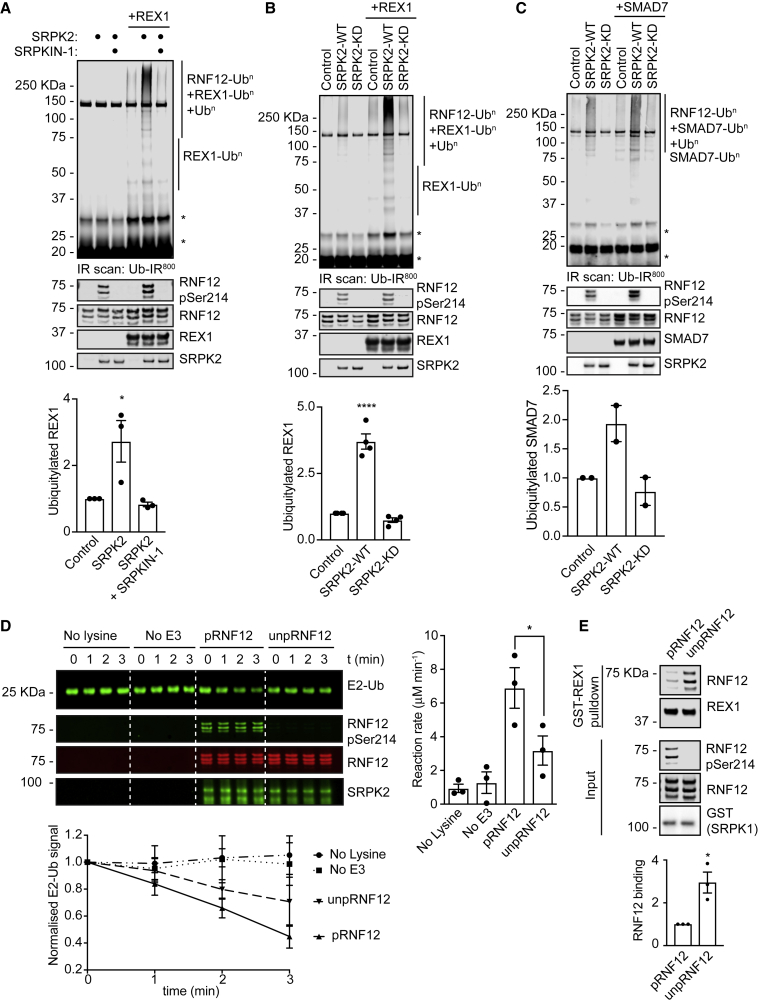
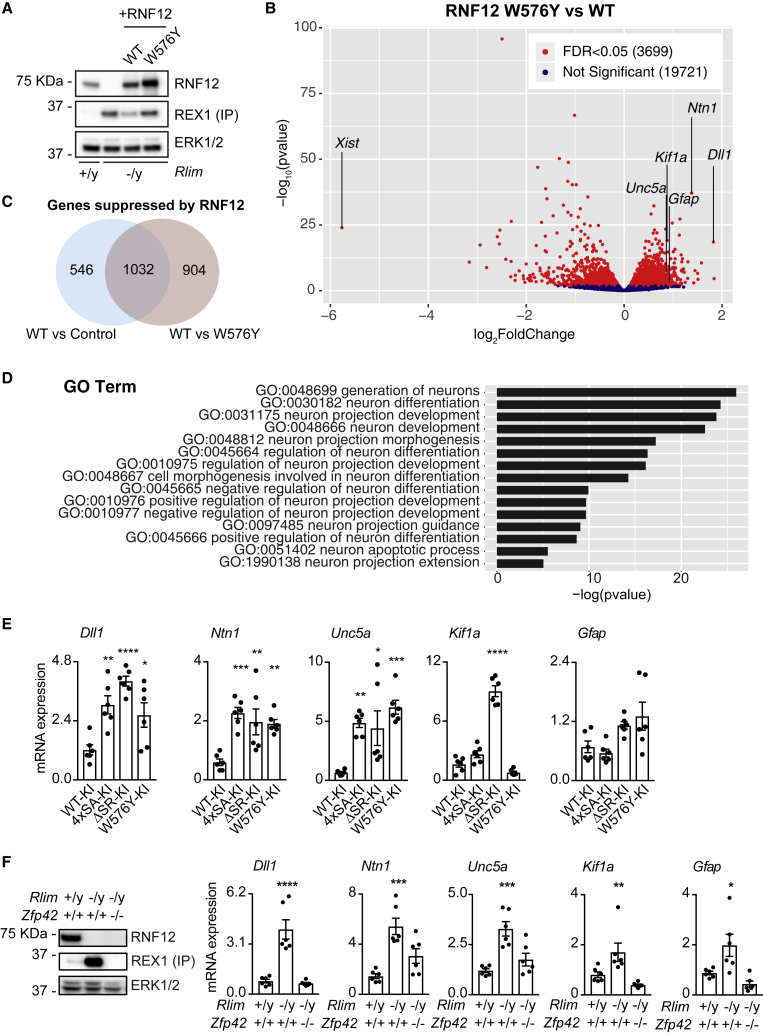
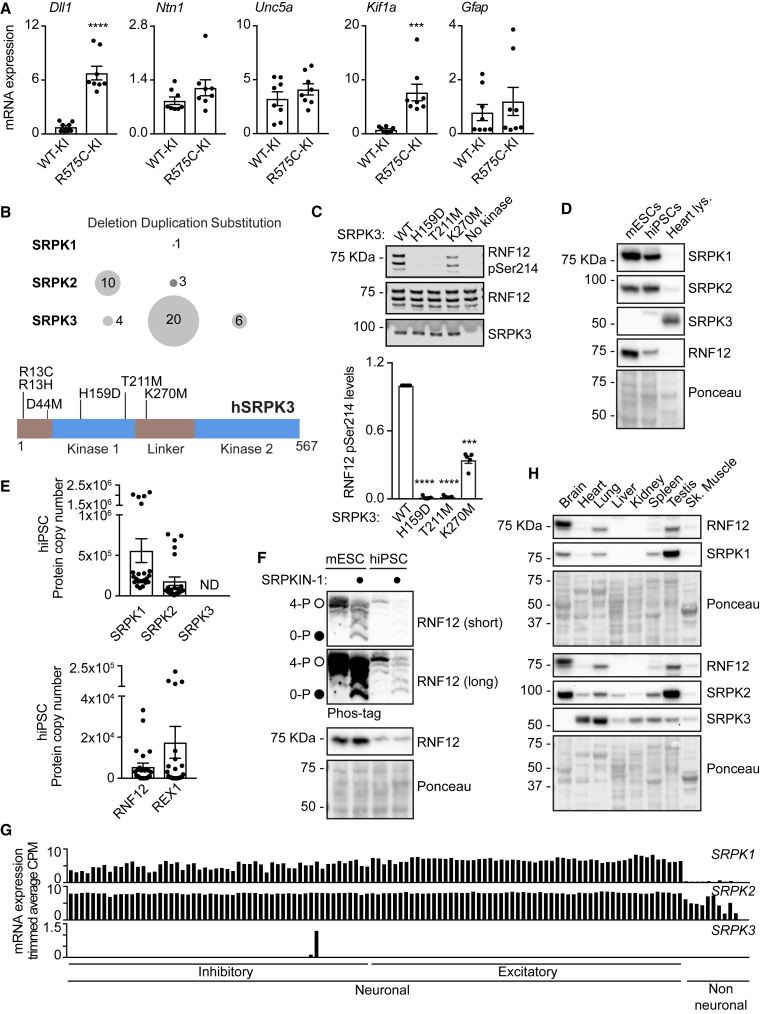
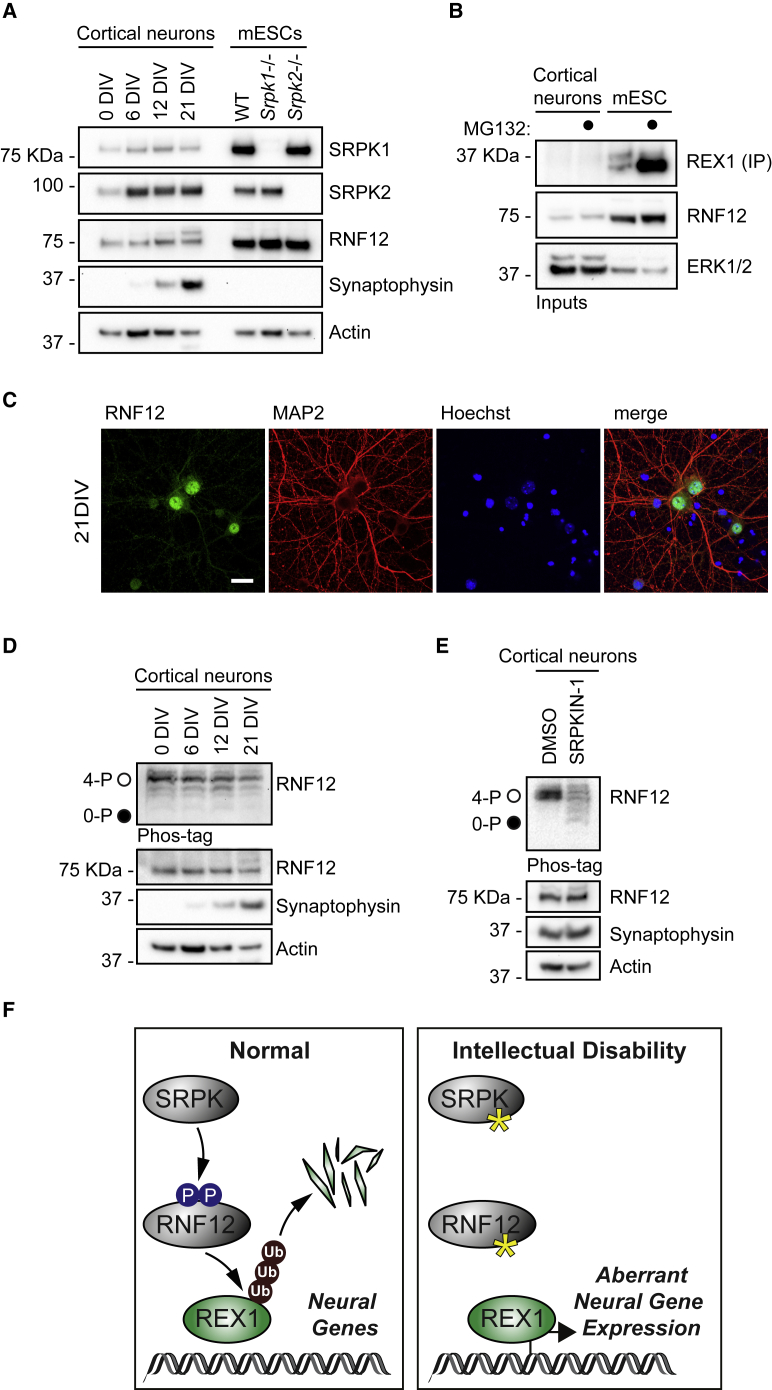
Conserved protein kinases with core cellular functions have been frequently redeployed during metazoan evolution to regulate specialized developmental processes. The Ser/Arg (SR)-rich splicing factor (SRSF) protein kinase (SRPK), which is implicated in splicing regulation, is one such conserved eukaryotic kinase. Surprisingly, we show that SRPK has acquired the capacity to control a neurodevelopmental ubiquitin signaling pathway. In mammalian embryonic stem cells and cultured neurons, SRPK phosphorylates Ser-Arg motifs in RNF12/RLIM, a key developmental E3 ubiquitin ligase that is mutated in an intellectual disability syndrome. Processive phosphorylation by SRPK stimulates RNF12-dependent ubiquitylation of nuclear transcription factor substrates, thereby acting to restrain a neural gene expression program that is aberrantly expressed in intellectual disability. SRPK family genes are also mutated in intellectual disability disorders, and patient-derived SRPK point mutations impair RNF12 phosphorylation. Our data reveal unappreciated functional diversification of SRPK to regulate ubiquitin signaling that ensures correct regulation of neurodevelopmental gene expression.

Keywords: development; metazoan evolution; neural development; neurodevelopmental disorders; protein kinase; protein phosphorylation; signal transduction; stem cells; transcriptomics; ubiquitin signaling.


Conflict of interest statement

Declaration of Interests The authors declare no competing interests.

Figures

None
Graphical abstract
Figure 1
Figure 1
Functional Diversification of SRPK to Control Developmental Ubiquitin Signaling (A) Wild-type (WT) mESCs were treated with 10 μM SRPKIN-1 or CLK-IN-T3 for 4 h, and phosphorylation of Ser-Arg rich splicing factors (SRSF) was assessed (Left). SRSF phosphorylation, SRPK1, SRPK2, and ERK1/2 levels were determined by immunoblotting. Expected positions of SRSFs that are not detected are shown in gray. Quantification of SRSF phosphorylation (Right). Data represented as mean ± SEM (n = 4). One-way ANOVA followed by Tukey’s multiple comparisons test; confidence level 95%. pSRSF4: (∗∗) p = 0.0032, (∗∗∗∗) p < 0.0001, pSRSF6/11: (∗∗∗∗) p < 0.0001. (B) Splice variants of Foxp1 mRNA including mutually exclusive exons 16 (Foxp1, GenBank: NM_053202.2, cyan) or 16b (Foxp1-ESC, GenBank: XM_030255074.1, tan) (Top). mESCs were treated with 1 μM SRPKIN-1 or CLK-IN-T3, or 10 μM Madrasin for 8 h, and Foxp1 exon 16-16b incorporation determined using specific quantitative RT-PCR primers. Neuro 2a is a control for exon 16b exclusion in differentiated cells (Bottom). Data represented as mean ± SEM (n = 3). One-way ANOVA followed by Tukey’s multiple comparisons test; confidence level 95%. Exon 16 inclusion: (∗∗∗∗) p < 0.0001, Exon 16b inclusion: () p = 0.0164, p = 0.0485, and p = 0.0489 (left to right). Ratio exon 16b/16: (∗∗∗∗) p < 0.0001, (∗∗∗) p = 0.0003. (C) SRPK substrates predicted using ScanProsite and grouped according to UniProt functions. (D) RNF12 phosphorylation sites detected by mass-spectrometry. LZL, leucine-zipper like; NLS, nuclear localization signal; NES, nuclear export signal; RING, RING E3 ubiquitin ligase catalytic domain. (E) CMGC family kinase copy numbers in mESCs determined by quantitative proteomics and represented using Kinoviewer. (F) CMGC kinase (200 mU) phosphorylation of the RNF12 SR-motif in vitro was determined by immunoblotting for RNF12 phospho-Ser214 and total RNF12. (G) mESCs were treated with 10 μM of the following kinase inhibitors: AZ-191 (DYRK1B), KH-CB19 (CLK-DYRK), CLK-IN-T3 (CLK), SPHINX31 (SRPK1), SRPKIN-1 (pan-SRPK), CHIR-99021 (GSK-3), PD-0325901 (MEK1/2), VX-745 (p38), JNK-IN-8 (JNK), RO-3306 (CDK1), and flavopiridol (CDK7/9) for 4 h and RNF12 SR-motif phosphorylation determined by immunoblotting for RNF12 phospho-Ser214 and total RNF12. Normalized RNF12 Ser214 phosphorylation is shown below. Data represented as mean ± SEM (n = 3). (H) SRPKIN-1 inhibition of SRPKs in vivo was determined by pre-treatment of mESCs with 10 μM SRPKIN-1 for 4 h followed by SRPK1 or SRPK2 immunoprecipitation kinase assay using RNF12 as a substrate. RNF12 SR-motif phosphorylation was analyzed by immunoblotting for RNF12 phospho-Ser214 and RNF12. SRPK1 and SRPK2 levels are shown as a loading control, Related to Figure S1; Tables S1 and S2.
Figure 2
Figure 2
RNF12/RLIM E3 Ubiquitin Ligase Is Selectively Phosphorylated by SRPKs at a SR-Rich Motif (A) RNF12-deficient (Rlim/y) mESCs were transfected with WT RNF12 or the indicated point mutants and RNF12 SR-motif phosphorylation analyzed by phos-tag immunoblotting for RNF12. Fully phosphorylated (4-P) and unphosphorylated (0-P) RNF12 SR-motifs are indicated by open (○) and closed (●) circles, respectively. RNF12 4xSA = S212A/S214A/S227A/S229A. (B) Rlim/y mESCs were transfected with the indicated RNF12 constructs and lysates treated with λ-phosphatase and analyzed by phos-tag immunoblotting for RNF12. Unphosphorylated recombinant RNF12 is included as a control. (C) mESCs were treated with 10 μM of the following kinase inhibitors: AZ-191 (DYRK1B), KH-CB19 (CLK-DYRK), CLK-IN-T3 (CLK), SPHINX31 (SRPK1), SRPKIN-1 (pan-SRPK), CHIR-99021 (GSK-3), PD-0325901 (MEK1/2), VX-745 (p38), JNK-IN-8 (JNK), RO-3306 (CDK1), and flavopiridol (CDK7/9) for 4 h and RNF12 SR-motif phosphorylation analyzed by phos-tag immunoblotting for RNF12. RNF12 4xSA is included as an unphosphorylated control. (D) mESCs were treated with the indicated concentrations of SRPKIN-1 for 4 h and RNF12 SR-motif phosphorylation analyzed by phos-tag immunoblotting for RNF12. (E) mESCs were treated with 10 μM SRPKIN-1 for 4 h and RNF12 phosphorylation analyzed from HA-RNF12 immunoprecipitates via RNF12 phos-tag and phospho-Ser214 immunoblotting using multiplex infrared immunoblot. (F) Phosphorylated peptides detected by mass spectrometry following in vitro phosphorylation of RNF12 by SRPK1. pS, phospho-serine. (G) Autoradiography of RNF12 WT or S212A/S214A/S227A/S229A (4xSA) following a radioactive kinase reaction with SRPK1, SRPK2, or SRPK3. RNF12 protein is detected by Coomassie staining. (H) Srpk1+/+ and Srpk1−/− mESCs were transfected with control or SRPK2 siRNA and RNF12 SR-motif phosphorylation analyzed by phos-tag immunoblotting for RNF12. SRPK2, SRPK1, RNF12, and ERK1/2 levels were determined by immunoblotting. Related to Figure S2; Tables S3 and S4.
Figure 3
Figure 3
SRPK Phosphorylation of RNF12 Regulates Nuclear Anchoring and E3 Ubiquitin Ligase Activity (A) RNF12 localization in wild-type knockin (WT-KI), SR-motif phosphorylation site knockin (4xSA-KI), or SR-motif deletion (ΔSR-KI) mESCs was determined by immunofluorescence. Scalebar: 20 μm (Left). Quantification of the Nucleus/cytosol fluorescence intensity ratio (Right). Data represented as mean ± SEM. One-way ANOVA followed by Tukey’s multiple comparisons test; confidence level 95%. (∗∗∗∗) p < 0.0001. (B) RNF12 4xSA-KI mESCs were treated with 30 nM leptomycin B for 6 h and RNF12 localization analyzed by immunofluorescence. Scale bar: 20 μm (Top). Quantification of the nucleus/cytosol fluorescence intensity ratio (Bottom). Data represented as mean ± SEM Unpaired Student’s t test, two-sided, confidence level 95%. (∗∗∗∗) p < 0.0001. (C) FLAG-tagged SRPK1 and SRPK2 were expressed in mESCs and localization of SRPKs and RNF12 analyzed by immunofluorescence. Scale bar: 20 μm (Left). Quantification of the cytosol/nucleus fluorescence intensity ratio (Right). Data represented as mean ± SEM Unpaired Student’s t test, two-sided, confidence level 95%. (∗∗∗∗) p < 0.0001. (D) WT, Rlim/y, RNF12 WT-KI, 4xSA-KI, ΔSR-KI, and W576Y-KI mESCs were treated with 10 μM MG132 for 6 h and RNF12-REX1 co-immunoprecipitation analyzed. RNF12, REX1 and ERK1/2 were detected by immunoblotting. () indicates non-specific signal. (E) REX1 levels were analyzed in RNF12 WT-KI, 4xSA-KI, ΔSR-KI, and W576Y-KI mESCs by immunoprecipitation followed by immunoblotting. ERK1/2 levels were detected by immunoblotting. (F) REX1 half-life was determined in RNF12 WT-KI, 4xSA-KI, ΔSR-KI, and W576Y-KI mESCs by immunoblotting. (Top) quantification of HA-REX1 protein levels normalized to ERK1/2 and calculated protein half-life (Bottom). Data represented as mean ± SEM (n = 3). Related to Figure S3.
Figure 4
Figure 4
SRPK Phosphorylation Directly Stimulates RNF12 E3 Ubiquitin Ligase Activity (A) Recombinant RNF12 was incubated with SRPK2 ± 10 μM SRPKIN-1 and REX1 ubiquitylation assessed. Infrared scans of ubiquitylated substrate signal (Top) and quantification (Bottom). Data represented as mean ± SEM (n = 3). One-way ANOVA followed by Tukey’s multiple comparisons test; confidence level 95%. () p = 0.0350. Phospho-Ser214 and total RNF12, REX1, and SRPK2 infrared immunoblots are shown.  = non-specific fluorescent signal. (B) Recombinant RNF12 was incubated with WT or kinase dead (KD) SRPK2 and subjected to REX1 fluorescent ubiquitylation assays. Infrared scans of ubiquitylated substrate signal (Top) and quantification (Bottom). Data represented as mean ± SEM (n = 3). One-way ANOVA followed by Tukey’s multiple comparisons test; confidence level 95%. (∗∗∗∗) p < 0.0001. Phospho-Ser214 and total RNF12, REX1, and SRPK2 infrared immunoblots are shown.  = non-specific fluorescent signal. (C) Recombinant RNF12 was incubated with WT or KD SRPK2 and SMAD7 ubiquitylation assessed. Infrared scans of ubiquitylated substrate signal (Top) and quantification (Bottom). Data represented as mean ± SD (n = 2). Phospho-Ser214 and total RNF12, REX1, and SRPK2 infrared immunoblots are shown.  = non-specific fluorescent signal. (D) Recombinant RNF12 was incubated with WT (pRNF12) or KD (unpRNF12) SRPK2 and subjected to E2 ubiquitin discharge assay. Infrared immunoblot scans (Top Left), reaction rate determinations (Top Right) and normalized quantification of E2-ubiquitin conjugate signal (Bottom) are shown. Data represented as mean ± SEM (n = 3). One-way ANOVA followed by Tukey’s multiple comparisons test; confidence level 95%. () p = 0.0490. (E) Recombinant RNF12 was incubated with WT or KD SRPK1 and subjected to GST-REX1 pull-down assay. RNF12, REX1, phospho-Ser214 RNF12 and SRPK1 infrared immunoblots (Top) and RNF12-REX1 binding quantification (bottom) are shown. Data represented as mean ± SEM (n = 3). Unpaired Student’s t test, two-sided, confidence level 95%. () p = 0.0162. Related to Figure S4.
Figure 5
Figure 5
RNF12-REX1 Signaling Controls a Neurodevelopmental Gene Expression Program (A) Rlim/y mESCs were transfected with WT or catalytically inactive (W576Y) RNF12. REX1 levels were analyzed by immunoprecipitation and immunoblotting, RNF12 and ERK1/2 levels were determined by immunoblotting. (B) Volcano plot of RNA-seq analysis comparing Rlim/y mESCs transfected with WT or W576Y RNF12. RNAs that are significantly altered by RNF12 E3 ubiquitin ligase activity are displayed in red. Selected neurodevelopmental mRNAs are labeled (Dll1, Ntn1, Unc5a, Kif1a, Gfap). Xist is a positive control for RNF12 E3 ubiquitin ligase activity. FDR, false discovery rate. (C) Venn diagram displaying total number of RNAs negatively regulated by RNF12 catalytic activity. Intersection (1,032 genes) represents RNAs whose expression is significantly altered when comparing control versus WT RNF12, and WT RNF12 versus W576Y catalytic mutant. (D) GO category enrichment analysis of genes/RNAs related to the GO term “neuron” whose expression is inhibited by RNF12 (232 genes). (E) RNF12 WT-KI, 4xSA-KI, ΔSR-KI, and W576Y-KI mESCs were subjected to quantitative RT-PCR analysis of relative mRNA expression. Data represented as mean ± SEM (n = 3). One-way ANOVA followed by Tukey’s multiple comparisons test; confidence level 95%. Dll1 (∗∗) p = 0.0058, (∗∗∗∗) p < 0.0001, () p = 0.0377; Ntn1 (∗∗∗) p = 0.0008, (∗∗) p = 0.0057, (∗∗) p = 0.0082; Unc5a (∗∗) p = 0.0079, () p = 0.0188, (∗∗∗) p = 0.0006. Kif1a (∗∗∗∗) p < 0.0001. (F) RNF12, REX1, and ERK1/2 protein levels in WT, Rlim/y and Rlim/y:Zfp42−/− mESCs were determined by immunoblotting (RNF12 and ERK1/2) and immunoprecipitation followed by immunoblotting (REX1) (Left). WT, Rlim-/y and Rlim/y:Zfp42−/− mESCs were analyzed for relative mRNA expression by quantitative RT-PCR (Right). Data represented as mean ± SEM (n = 3). One-way ANOVA followed by Tukey’s multiple comparisons test; confidence level 95%. Dll1 (∗∗∗∗) p < 0.0001; Ntn1 (∗∗∗) p = 0.0002; Unc5a (∗∗∗) p = 0.0003; Kif1a () p = 0.0316; Gfap () p = 0.0261, Related to Figure S5; Tables S5–S7.
Figure 6
Figure 6
The SRPK-RNF12 Signaling Pathway Is Deregulated in Human Intellectual Disability (A) RNF12 WT-KI or R575C-KI mESCs were analyzed for relative mRNA expression by quantitative RT-PCR. Data represented as mean ± SEM (n = 3). Unpaired Student’s t test, two-sided, confidence level 95%. Dll1 (∗∗∗∗) p < 0.0001; Kif1a (∗∗∗) p = 0.0005. (B) Graphical representation of SRPK intellectual disability variants reported in literature grouped by type of chromosomal mutation (Top) and position within the SRPK3 protein (Bottom). (C) RNF12 phosphorylation in vitro by WT SRPK3 or the indicated mutants was analyzed by immunoblotting for RNF12 phospho-Ser214 and total RNF12 (Top). Quantification of infrared RNF12 phospho-Ser214 immunoblotting blotting signal normalized to total RNF12 (Bottom). Data represented as mean ± SEM (n = 3). One-way ANOVA followed by Tukey’s multiple comparisons test; confidence level 95%. (∗∗∗∗) p > 0.0001, (∗∗∗) p = 0.0001. (D) SRPK1, SRPK2, SRPK3, and RNF12 levels in mESCs, hiPSCs (CHiPS4 cell line), and mouse heart lysate were analyzed by immunoblotting. (E) hiPSC (bubh_3 line) extracts were analyzed for average protein copy number via quantitative proteomics. Data were obtained from the human induced pluripotent stem cell initiative database (http://www.hipsci.org/) and represented as mean ± SEM (n = 24), ND, not detected. (F) hiPSCs (CHiPS4 cell line) and mESCs were treated with 10 μM SRPKIN-1 for 4 h and RNF12 SR-motif phosphorylation analyzed by phos-tag immunoblotting for RNF12. Fully phosphorylated (4-P) and unphosphorylated (0-P) RNF12 SR-motif is indicated with open (○) and closed (●) circles, respectively. (G) Single nuclei isolated from post-mortem human brain cortex neurosurgery were analyzed via SMART-seq v4 RNA-seq (data from Hodge et al., 2019). Each bar represents a distinct neuronal sub-type or non-neuronal cell. Trimmed average counts per million (CPM) for SRPK1, SRPK2, and SRPK3 are shown. (H) Expression of RNF12, SRPK1, SRPK2, and SRPK3 in adult mouse tissues was analyzed by immunoblotting. Ponceau S staining is shown as a loading control.
Figure 7
Figure 7
The SRPK-RNF12 Signaling Pathway Operates in Neurons (A) Primary cortical neurons isolated from E16.5 C57BL6 mice were cultured for the indicated number of days in vitro (DIV) and RNF12, SRPK1, and SRPK2, synaptophysin and actin levels analyzed via immunoblotting alongside the indicated mESC lines. (B) Cortical neurons were cultured for 21 days and treated with 10 μM MG132 and protein levels analyzed by immunoprecipitation and immunoblotting (REX1) and immunoblotting (RNF12 and ERK1/2). (C) Cortical neurons were cultured in vitro for the indicated number of days (DIV) and RNF12 and MAP2 neuron specific marker analyzed by immunofluorescence. Scale bar: 20 μm. (D) RNF12 SR-motif phosphorylation during in vitro mouse cortical neuron maturation was analyzed via phos-tag immunoblotting for RNF12. Fully phosphorylated (4-P) and unphosphorylated (0-P) RNF12 SR-motifs are indicated by open (○) and closed (●) circles, respectively. Synaptophysin and actin levels were determined by immunoblotting. (E) Cortical neurons were cultured for 21 days and treated with 10 μM SRPKIN-1 for 4 h RNF12 SR-motif phosphorylation was analyzed by phos-tag immunoblotting for RNF12. Fully phosphorylated (4-P) and unphosphorylated (0-P) RNF12 SR-motif is indicated with open (○) by closed (●) circles, respectively. Synaptophysin and actin levels were determined by immunoblotting. (F) The SRPK-RNF12-REX1 signaling pathway regulates neural gene expression and is disrupted in intellectual disability disorders. SRPK phosphorylates the RNF12 SR-motif to promote REX1 ubiquitylation and proteasomal degradation, which acts as a “brake” for neural gene expression in self-renewing pluripotent stem cells. In intellectual disability, inactivating mutations in SRPKs or RNF12 lead to REX1 accumulation and aberrant induction of neural genes.

Similar articles

Cited by

References

    1. Ackerman S.L., Kozak L.P., Przyborski S.A., Rund L.A., Boyer B.B., Knowles B.B. The mouse rostral cerebellar malformation gene encodes an UNC-5-like protein. Nature. 1997;386:838–842. - PubMed
    1. Anders S., Pyl P.T., Huber W. HTSeq–a python framework to work with high-throughput sequencing data. Bioinformatics. 2015;31:166–169. - PMC - PubMed
    1. Bao Z.Z., Jin Z. Sema3D and Sema7A have distinct expression patterns in chick embryonic development. Dev. Dyn. 2006;235:2282–2289. - PMC - PubMed
    1. Barakat T.S., Gunhanlar N., Pardo C.G., Achame E.M., Ghazvini M., Boers R., Kenter A., Rentmeester E., Grootegoed J.A., Gribnau J. RNF12 activates Xist and is essential for X chromosome inactivation. PLoS Genet. 2011;7:e1002001. - PMC - PubMed
    1. Batson J., Toop H.D., Redondo C., Babaei-Jadidi R., Chaikuad A., Wearmouth S.F., Gibbons B., Allen C., Tallant C., Zhang J. Development of potent, selective SRPK1 inhibitors as potential topical therapeutics for neovascular eye disease. ACS Chem. Biol. 2017;12:825–832. - PubMed

Publication types

MeSH terms