. 2020 Nov 25;183(5):1325-1339.e21.
doi: 10.1016/j.cell.2020.10.004. Epub 2020 Oct 8.

SARS-CoV-2 Disrupts Splicing, Translation, and Protein Trafficking to Suppress Host Defenses

Affiliations

SARS-CoV-2 Disrupts Splicing, Translation, and Protein Trafficking to Suppress Host Defenses

Abhik K Banerjee et al. Cell. .

Abstract

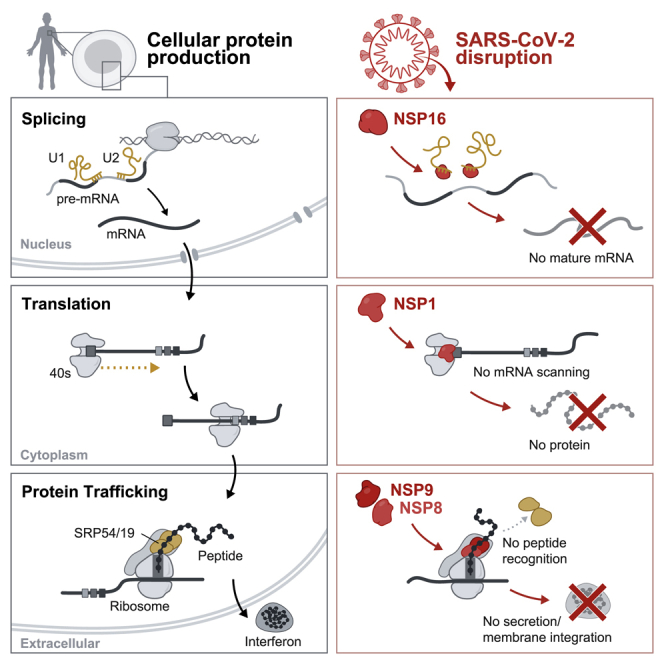
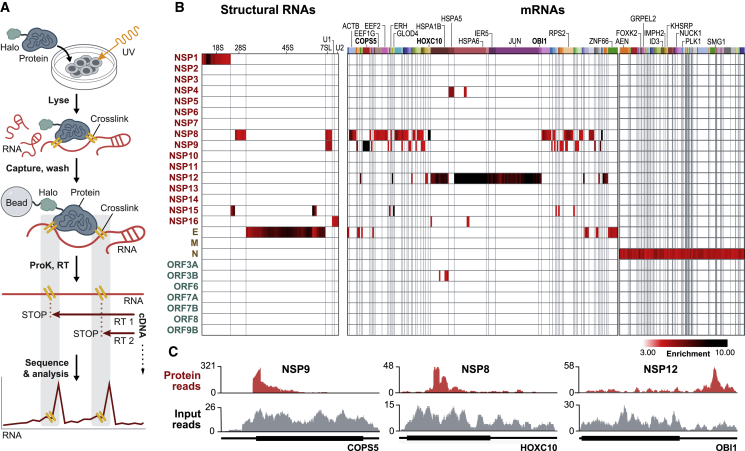
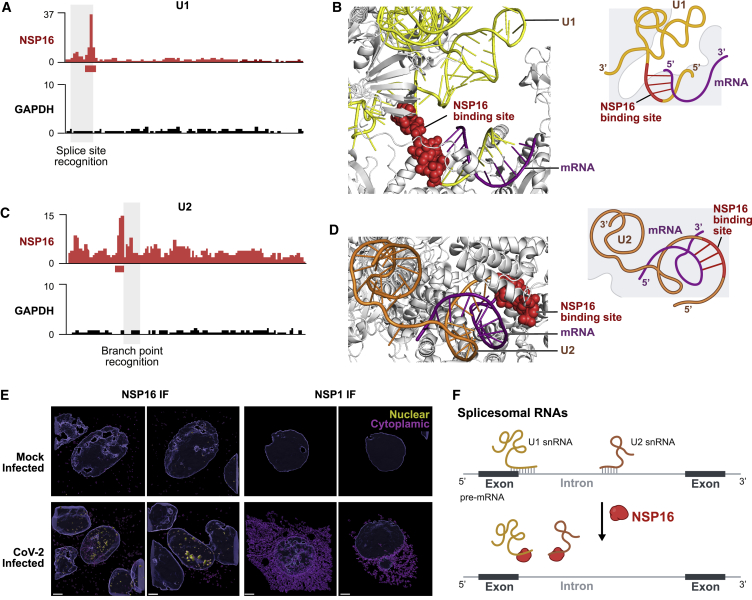
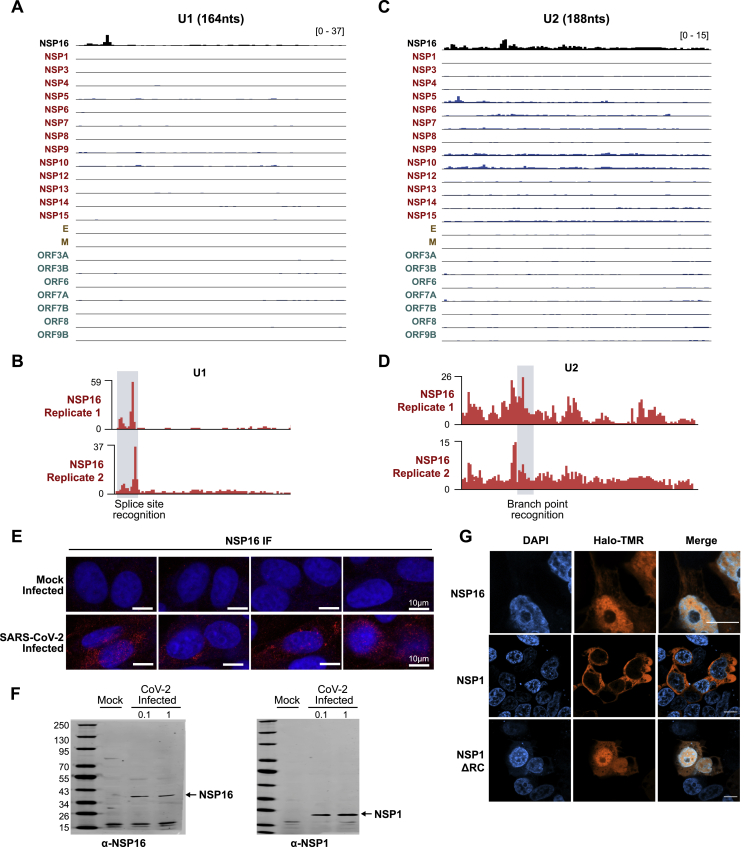
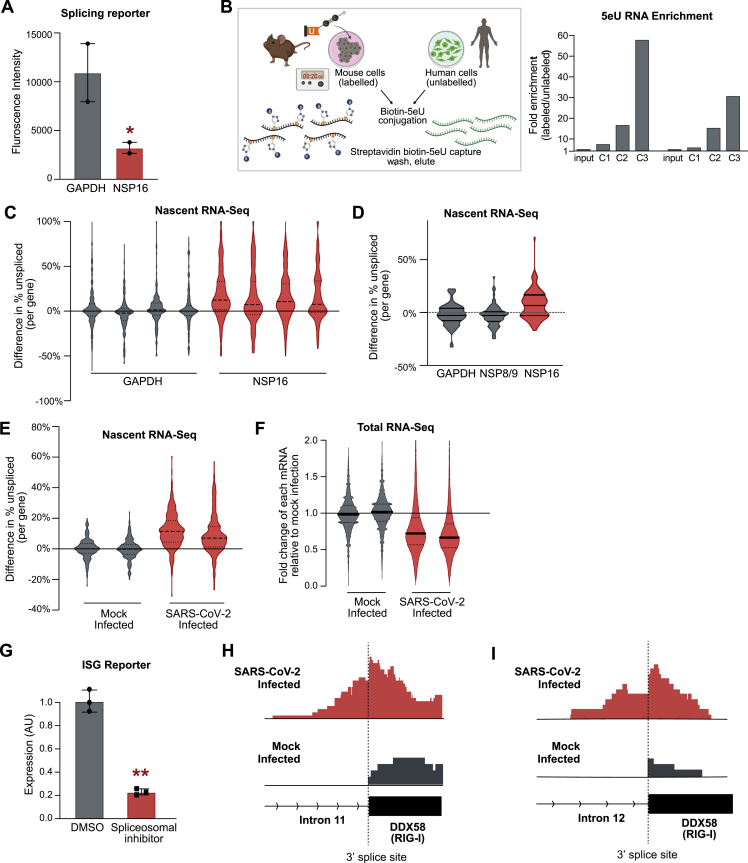
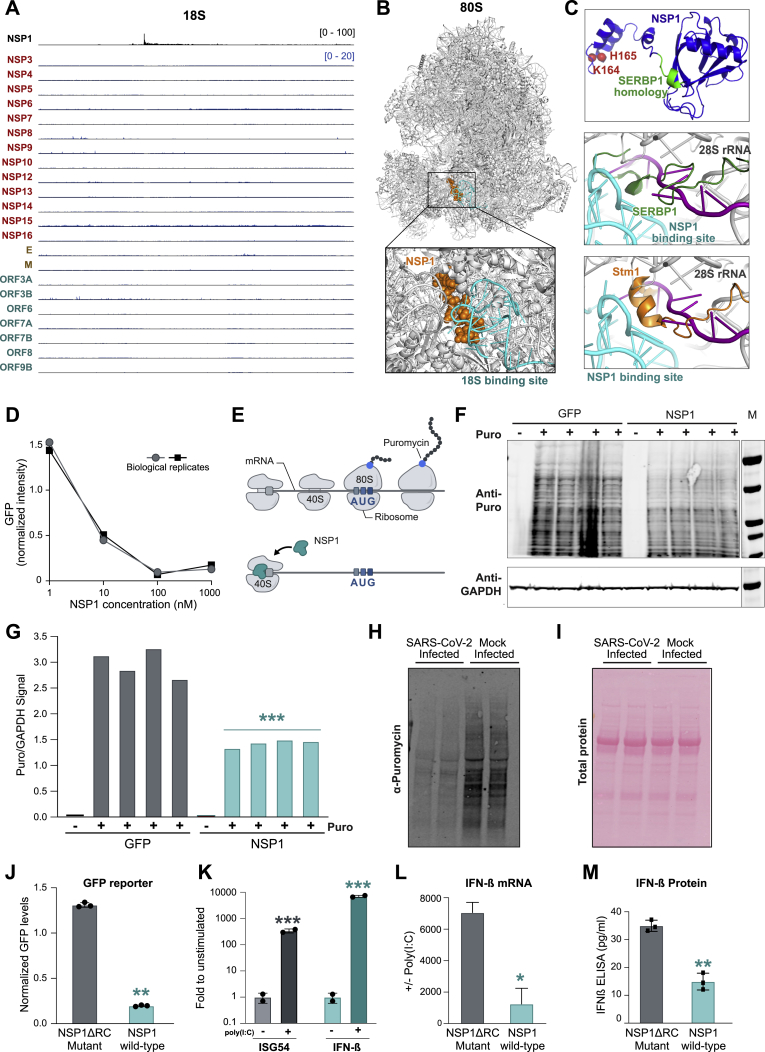
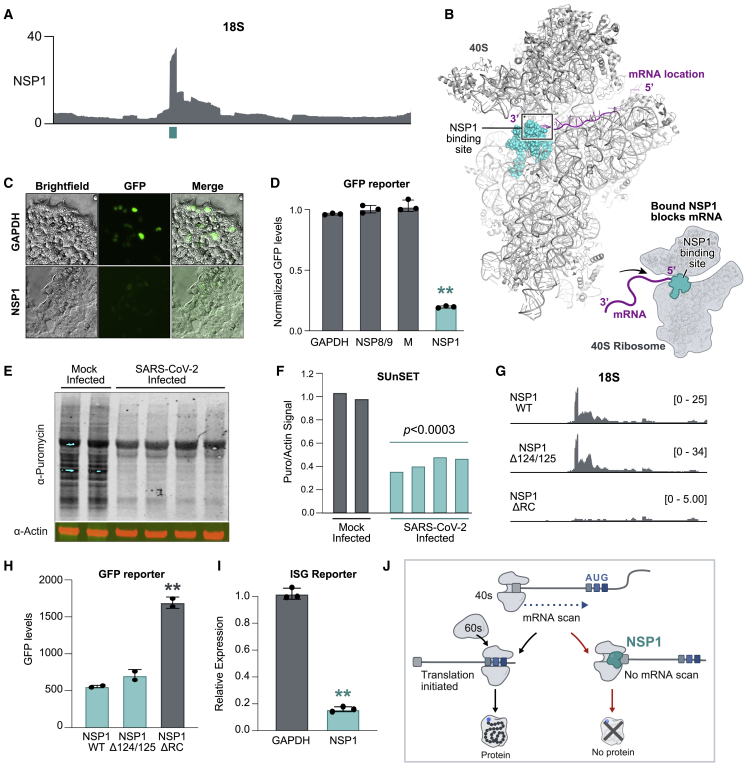
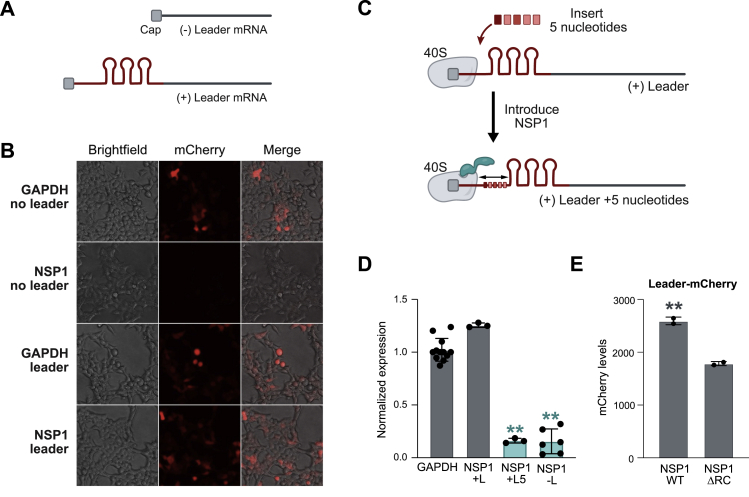
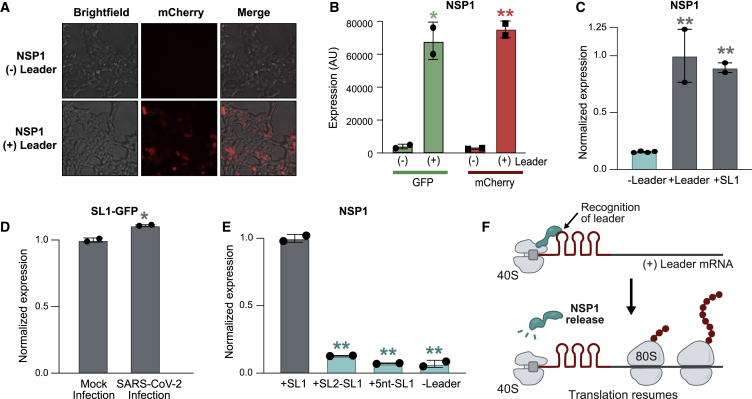
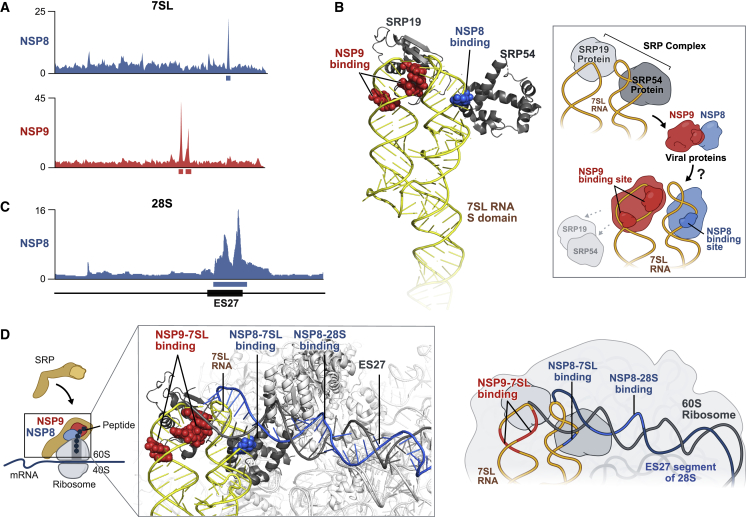
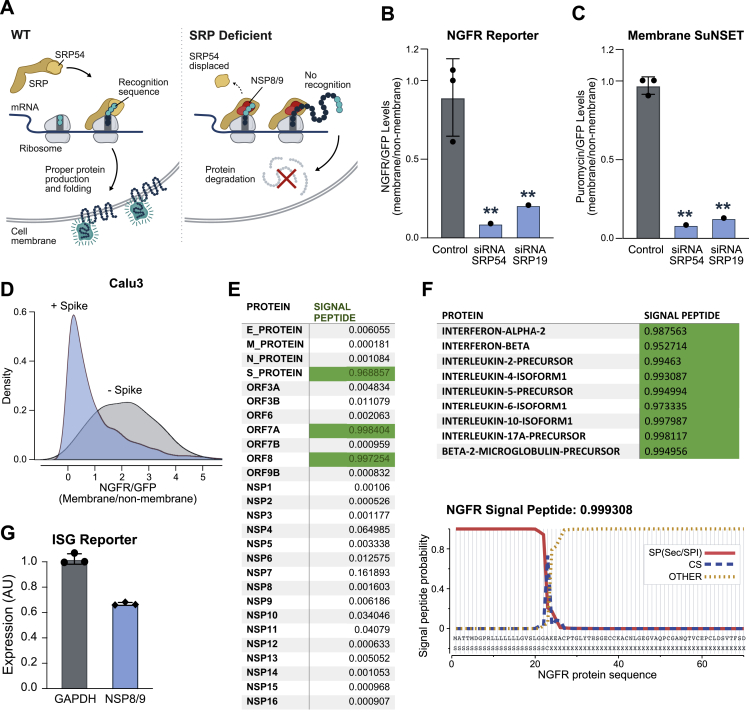
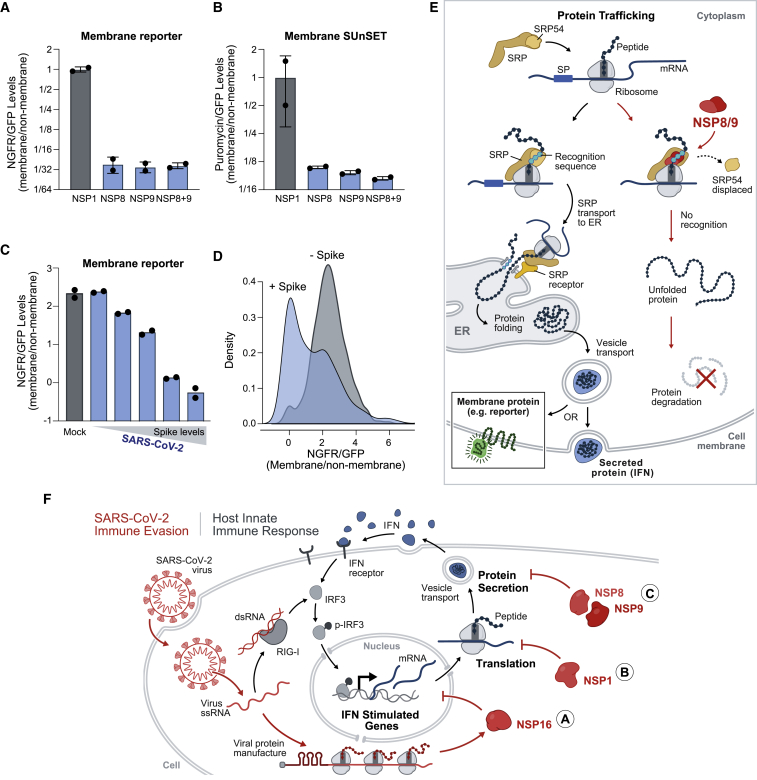
Severe acute respiratory syndrome coronavirus 2 (SARS-CoV-2) is a recently identified coronavirus that causes the respiratory disease known as coronavirus disease 2019 (COVID-19). Despite the urgent need, we still do not fully understand the molecular basis of SARS-CoV-2 pathogenesis. Here, we comprehensively define the interactions between SARS-CoV-2 proteins and human RNAs. NSP16 binds to the mRNA recognition domains of the U1 and U2 splicing RNAs and acts to suppress global mRNA splicing upon SARS-CoV-2 infection. NSP1 binds to 18S ribosomal RNA in the mRNA entry channel of the ribosome and leads to global inhibition of mRNA translation upon infection. Finally, NSP8 and NSP9 bind to the 7SL RNA in the signal recognition particle and interfere with protein trafficking to the cell membrane upon infection. Disruption of each of these essential cellular functions acts to suppress the interferon response to viral infection. Our results uncover a multipronged strategy utilized by SARS-CoV-2 to antagonize essential cellular processes to suppress host defenses.

Keywords: NSP1; NSP16; NSP8; NSP9; RNA-protein interactions; SARS-CoV-2; interferon; mRNA splicing; protein trafficking; translation.


Conflict of interest statement

Declaration of Interests The authors declare no competing interests.

Figures

None
Graphical abstract
Figure S1
Figure S1
Global RNA Binding Maps of SARS-CoV-2 Proteins, Related to Figure 1 (A) Protein expression gels of Halo-tagged SARS-CoV-2 proteins. Expression is visualized via AlexaFluor-660 conjugated Halo-ligand. (B) Example of eCLIP (top) and Halo (bottom) enrichments are plotted for PTBP1 over intronic regions of ITGAD mRNA. The location of the corresponding PTBP1 recognition motif (blue boxes) are shown. (C) Density scatterplot of the enrichment levels of PTBP1 over all human RNA regions as measured by eCLIP (x axis) compared to the enrichment levels as measured by Halo (y axis) for all RNAs identified as significantly enriched by eCLIP. (D) Cartoon illustrating protein-adduct mediated reverse transcriptase read stops at binding motifs (top). PTBP1 crosslink-induced truncation frequency relative to known PTBP1 motif (HYUUUYU, shown in red). (E) Scatterplot of RNA abundance (log scale, x axis) compared to Halo enrichment (log scale, y axis) for the GAPDH protein across all 100-nucleotide windows of all annotated human RNAs (exon and introns) are plotted. Windows with significant enrichment are shown in red. (F) Representative tracks illustrating different mRNA binding patterns in Halo captures of NSP12 (red), NPS9 (blue), NSP15 (black), and N-protein (blue). Input tracks are presented for each mRNA (gray).
Figure 1
Figure 1
Global RNA Binding Maps of SARS-CoV-2 Proteins (A) Schematic of our approach. (B) Enrichment heatmap of each SARS-CoV-2 protein (rows) by significantly enriched 100-nt RNA bins (columns; p < 0.001 and enrichment > 3-fold; STAR Methods). Shared colored bars indicate multiple bins within the same mRNA. For spacing reasons, the 82 mRNAs bound by N protein are displayed separately. (C) Examples of sequencing reads over specific mRNAs for viral proteins (red) relative to input RNA coverage (gray) are shown. Coding regions (thick lines) and untranslated regions (thin lines) are shown for each mRNA. See also Table S1.
Figure 2
Figure 2
NSP16 Binds to U1 and U2 at Their mRNA Recognition Sites (A) NSP16 enrichment of reverse transcription stop positions across each nucleotide of U1 (red) compared with a control protein (GAPDH, black). The red box (below the x axis) represents most enriched nucleotide positions (U1, 9–13 nt). The gray-shaded box (overlay) outlines the position of the splice site recognition sequence. (B) Left: structure of the pre-catalytic human spliceosome (PDB: 6QX9; Charenton et al., 2019), highlighting the location of NSP16 binding site (red spheres) relative to U1 (yellow ribbon) and mRNA (purple ribbon). Right: schematic of the structure. (C) Enrichment across each nucleotide of U2 for NSP16 (red) and GAPDH (black). The red box demarcates most enriched nucleotide positions (U2, 27–34 nt). The gray-shaded box outlines the location of the branchpoint recognition sequence. (D) Structure of the pre-catalytic human spliceosome (PDB: 6QX9; Charenton et al., 2019) displaying the NSP16 binding site (red spheres), U2 (orange), and mRNA (purple). (E) Mock-infected (top) or SARS-CoV-2 infected (bottom) Vero E6 cells immunostained with a polyclonal antibody to NSP16 (left) or NSP1 (right). Imaris 3D reconstruction of the DAPI (nucleus) and NSP16 or NSP1 signal are shown for each protein. The signal contained within the 3D nuclear volume (blue) is shown in yellow and the cytoplasmic signal in purple. Scale bars, 3 μm. (F) Model: NSP16 binding to U1/U2 can affect mRNA recognition during splicing.
Figure S2
Figure S2
NSP16 Binds to the U1 and U2 Components of the Spliceosome at Their mRNA Recognition Sites, Related to Figure 2 (A) Comparison of U1 RNA enrichment across SARS-CoV-2 Halo capture datasets. (B) NSP16 binding traces along U1 RNA between two separate captures. Splice site recognition domain is highlighted in gray. (C) Comparison of U2 RNA enrichment across SARS-CoV-2 Halo capture datasets. (D) NSP16 binding traces along U2 RNA between two separate captures. Branch point recognition domain is highlighted in gray. (E) NSP16 immunofluorescence in Vero E6 cells infected (or mock infected) with SARS-CoV-2 at an MOI of 0.1 for 48h. Four representative fields are displayed, with size bar indicating 10 microns. (F) Western blot confirmation of NSP16 and NSP1 antibodies used to generate images in (E). Vero cells were infected (or mock infected) with SARS-CoV-2 at an MOI of 0.1 or 1; 72 hpi cells were lysed and probed by western blot with antibodies raised against NSP1 or NSP16. (G) Imaging of HEK293T cells transfected with Halo-tagged NSP16, NSP1, and NSP1ΔRC plasmids. Proteins are visualized using TMR-conjugated Halo-ligand (orange) and counter-stained with DAPI (blue). Scale bars indicate 10 microns.
Figure 3
Figure 3
NSP16 Suppresses Host mRNA Splicing (A) Schematic of fluorescence reporter used to assay mRNA splicing. (B) GFP density plot of HEK293T cells expressing the GFP splicing reporter and either GAPDH (gray) or NSP16 (red). (C) Schematic of the nascent RNA purification method. (D) The percentage of unspliced difference for each gene between HEK293T cells transfected with GAPDH (gray) or NSP16 (red). The plot represents the merge of four independent biological replicates; replicates are plotted in Figure S4C. (E) Violin plot for SARS-CoV-2 infected human lung epithelial cells (MOI = 0.01, 48 h) compared with mock infection. Plots are merges of two biological replicates; replicates are plotted in Figure S4E. (F) Model. NSP16 binding to U1 and U2 can reduce overall mRNA and protein levels. (G) Expression of an IFN-stimulated gene (ISG) reporter upon transfection with GAPDH (gray) or NSP16 (red) after stimulation with IFN-β. Three independent biological replicates; ∗∗p < 0.01. (H) Example of nascent RNA sequencing at the intron of ISG15 (intron, line; exon, box) upon SARS-CoV-2 (red) or mock (gray) infection.
Figure S3
Figure S3
NSP16 Suppresses Host mRNA Splicing, Related to Figure 3 (A) Median of raw GFP fluorescence measured in splicing reporter assay performed in HEK293T cells expressing either Halo-GAPDH (gray) or Halo-NSP16 (red). Two independent biological replicates per condition. (B) Overview of nascent RNA-sequencing method, including 5eU nucleotide feeding, biotin click chemistry conjugation, and biotin-streptavidin-based iterative capture methods. Human/mouse mixing experimental data illustrates selective enrichment of labeled material over unlabeled material after three sequential captures. (C1 = capture 1 enrichment, C2 = capture 2 enrichment, etc.) (C) Violin plot depicting difference in unspliced reads per gene (defined as the difference between number of unspliced fragment divided by total fragments spanning the 3′ splice site between condition and median of all control samples) for HEK293T cells transfected with either GAPDH (gray) or NSP16 (red) for 48hrs. All four individual replicates are presented. (D) Violin plot depicting difference in unspliced reads per gene (relative to median of GAPDH) for HEK293T cells transfected with either GAPDH, NSP9, or NSP16 (red) for 48hrs. (E) Violin plot depicting difference in unspliced reads per gene (relative to median of the mock condition) for Calu3 cells infected with SARS-CoV-2 virus at an MOI of 0.01 for 48 hr (red) or uninfected (gray). Biological replicates are presented. (F) Violin plot depicting fold change in total steady-state mRNA levels (mRNA initially normalized to ncRNA and ratio is fold normalized mock treatment) for SARS-CoV-2 infected (red) compared to mock infected (gray) samples. Data is presented for two biological replicates for each condition. (G) Normalized expression of an interferon signaling reporter upon stimulation with IFN-β and treatment with madrasin spliceosomal inhibitor (red) or DMSO vehicle (gray). Three independent biological replicates were measured for each condition. (H-I) Representative nascent RNA tracks from SARS-Cov-2 infected (red) and mock-treated cells (gray) along Intron 11 and Intron 12 of interferon stimulated gene, RIG-I.
Figure S4
Figure S4
NSP1 Binds to the 18S Ribosomal RNA Near the mRNA Entry Channel to Suppress Global mRNA Translation in Cells, Related to Figure 4 (A) Comparison of 18S RNA enrichment across SARS-CoV-2 Halo capture datasets. (B) The location of NSP1 binding (orange spheres) relative to 18S binding site (cyan) upon known structure of the 80S ribosome (gray). (C) Predicted structure of NSP1 based on Robetta modeling. The critical C-terminal amino acids required for binding 18S (K164 and H165) are indicated as red spheres. The region of homology with SERBP1 is shown in green. The observed NSP1 binding sites on the 18S rRNA are demarcated in cyan on the structure of the human 40S ribosome (PDB: 6G5H; gray)(Ameismeier et al., 2018), relative to the mRNA path (purple; 6YAL)(Simonetti et al., 2020), and known clogging factors (E) SERBP1 (green; 6MTE)(Brown et al., 2018) and (F) Stm1 (orange; 4V88)(Ben-Shem et al., 2011). (D) An mRNA encoding GFP was added to HeLa cell extracts along with different concentrations of purified NSP1 protein (x axis). The amount of GFP protein measured relative to the median of replicates for a buffer only control is shown (y axis). Two independent dose titrations were performed and are shown on top of each other. (E) Schematic illustrating puromycin tagging of newly translated proteins via the SuNSET method. If the level of ongoing translation is high, we expect to detect a large amount of newly generated proteins containing puromycin; if global translation is suppressed, we expect to observe a decrease in the amount of puromycin integrated into proteins. (F) Western blot of global puromycin incorporation into proteins of HEK293T cells transfected with either Halo-GFP (left) or Halo-NSP1 (right). GAPDH levels were measured in the same lysates to normalize for total protein in the sample (bottom). (-) puro lanes indicate transfected samples that were not treated with puromycin. (G) Quantification of puromycin intensity across each lane of the gel in Panel F. The ratio of puromycin signal over total GAPDH signal is plotted for individual replicates. (H) Vero E6 cells were infected (or mock infected) with SARS-CoV-2 at an MOI of 0.01. 48hpi cells were labeled with media containing puromycin, and lysates were probed by western blot. (I) As a control for total protein levels, after samples in (G) were run on a SDS-PAGE gel, transferred to nitrocellulose, and total proteins were stained with PONCEAU before blocking/antibody detection of puromycin signal. (J) Normalized GFP fluorescence intensity of GFP reporter co-transfected in HEK293T cells in the presence of the NSP1ΔRC mutant that does not bind to 18S (gray) or NSP1 (cyan) proteins. Three independent biological replicates were measured for each sample. Note: This experiment was performed alongside the various controls displayed in Figure 4D and are plotted on the same scale. (K) mRNA levels of ISG54 and IFN-β following stimulation with poly(I:C) normalized to levels in unstimulated A549 cells. (L and M) mRNA and protein levels of IFN-β following stimulation with poly(I:C) normalized to levels in unstimulated A549 cells transfected with NSP1ΔRC mutant (gray) or NSP1 (cyan). Two independent biological replicates were measured for each condition. In all panels, error bars represent standard deviation across replicates, and dots represent individual values for each replicate. indicates p < 0.05, ∗∗p < 0.01, and ∗∗∗p < 0.001.
Figure 4
Figure 4
NSP1 Binds to 18S Near the mRNA Entry Channel to Suppress Translation (A) NSP1 enrichment across each nucleotide of 18S. The cyan box indicates the most enriched nucleotides of NSP1 binding (18S, 607–644 nt). (B) The location of NSP1 binding (cyan spheres) relative to the known structure of 40S (gray) and mRNA (purple ribbon). Right: schematic illustrating structure (Ameismeier et al., 2018) and how NSP1 binding would block mRNA entry. (C) Images of HEK293T cells co-expressing the GFP reporter and GAPDH (top) or NSP1 (bottom). (D) Flow cytometry quantification (mean intensity) of GFP in the presence of GAPDH, NSP8/9, M, or NSP1 proteins. Three independent biological replicates per condition. (E) Puromycin incorporation (top) or total actin levels (bottom) measured in Calu3 cells infected with SARS-CoV-2 (MOI = 0.01, 48 h) or a mock-infected control (left 2 lanes). (F) The ratio of puromycin signal over total actin signal is plotted for each individual replicate. (G) Read enrichment on 18S for an independent replicate of NSP1 wild type, NSP1 R124A/K125A mutant, and NSP1 K164A/H165A (ΔRC) mutant. (H) Flow cytometry analysis of HEK293T cells transfected with GFP and NSP1ΔRC mutant (gray), wild-type NSP1, or NSP1 R124A/K125A (cyan). (I) Quantification of the IFN-β response in the presence of GAPDH (gray) or NSP1 (cyan). (J) Schematic of how NSP1 acts to suppress mRNA translation. Error bars represent standard deviation across biological replicates, and dots represent individual values for each replicate; p < 0.05 and ∗∗p < 0.01.
Figure S5
Figure S5
The 5′ Viral Leader Sequence Protects mRNAs from NSP1-Mediated Translational Inhibition, Related to Figure 5 (A) A schematic of the experimental design containing two reporter RNAs encoding fluorescent proteins, without the viral leader (top) and with the viral leader sequence appended to the 5′ end of the mRNA (bottom). Viral leader represented by three stem-loops in red. (B) Representative images of HEK293T cells co-transfected with GAPDH or NSP1 along with mCherry RNA with or without SARS-CoV-2 leader sequence. (C) Schematic illustrating the insertion of 5 nucleotides between the 5′ cap and the viral leader sequence. NSP1 protein represented in red. (D) Quantification of mCherry expression in HEK293T cells transfected with mCherry RNAs, fused to different 5′ leader variants, and either GAPDH or NSP1. Values are normalized to the median values of mCherry levels from control condition (GAPDH with + mCherry). At least 3 independent biological replicates per condition. Dots represent value for each independent replicate (e.g., NSP1 -L contains 6 independent replicates). (E) Quantification of mCherry expression from HEK293T cells transfected with Halo-tagged NSP1 WT or NSP1ΔRC mutant, along with leader-mCherry expressing plasmids. Values are normalized to the median values of mCherry levels in control sample (NSP1 with + leader-mCherry). Two independent biological replicates were measured per condition. In all panels, error bars represent standard deviation across replicates, and dots represent individual values for each replicate. indicates p < 0.05 and ∗∗p < 0.01.
Figure 5
Figure 5
The 5′ Viral Leader Protects mRNA from NSP1-Mediated Translational Inhibition (A) Images of cells co-transfected with NSP1 and mCherry alone (− leader, top) or mCherry fused to the SARS-CoV-2 leader (+ leader, bottom). (B) GFP (green) or mCherry (red) levels when fused to the viral leader (+ leader, right) or lacking the viral leader (− leader, left). (C) GFP reporter with no leader (left), full leader (center), or stem loop 1 (SL1) upon NSP1 expression. (D) Calu3 cells expressing SL1 fused to GFP. Cells were mock or SARS-CoV-2 infected (MOI = 0.1), and GFP expression was measured 24 h after infection by flow cytometry. (E) GFP reporter containing SL1 (left), a swap of SL2 and SL1 (SL2-SL1), insertion of 5 nt between the 5′ end and SL1 (+5 nt-SL1), or no leader. GFP protein level was measured for each condition upon expression of NSP1. (F) Proposed model of how NSP1 binding to the viral leader can allosterically modulate NSP1 structure to protect mRNAs in cis. Error bars represent standard deviation across biological replicates, and dots represent individual replicate values; p < 0.05 and ∗∗p < 0.01.
Figure 6
Figure 6
NSP8 and NSP9 Bind to 7SL RNA of the SRP (A) Enrichment of reverse transcription stop positions across each nucleotide of 7SL is shown for NSP8 (blue) and NSP9 (red). Red (7SL, 142–143 nt; 7SL, 149–151 nt) and blue (7SL, 193–194 nt) boxes demarcate the most enriched nucleotide positions. (B) The locations of the NSP8 (blue spheres) and NSP9 (red spheres) binding sites on the S domain of 7SL (yellow ribbon) structure relative to SRP54 and SRP19 (gray) (PDB: 1MFQ; Kuglstatter et al., 2002). Right: schematic of the structure and model of how NSP8/9 binding to 7SL could affect SRP protein binding. (C) Read enrichment across each nucleotide of 28S for NSP8 (blue). The black box indicates the location of the ES27 expansion sequence (28S, 2,889–3,551 nt). The blue box indicates the most enriched nucleotide position on 28S rRNA (28S, 3,017–3,529 nt). (D) The locations of the NSP8 (blue) and NSP9 (red) binding sites relative to the structure of the SRP-ribosome complex (PDB: 3JAJ; Voorhees and Hegde, 2015) superimposed on the structure of the ES27 region of 28S (Ebp1-ribosome complex; PDB: 6SXO; Wild et al., 2020). The observed NSP8 binding site in the ES27 region of 28S (gray) is demarcated in blue, and the NSP8 (blue) and NSP9 (red) binding sites on 7SL (yellow) are highlighted. Right: schematic illustrating the interaction between the ribosome and SRP.
Figure S6
Figure S6
NSP8 and NSP9 Bind to the 7SL RNA Component of the SRP, Related to Figure 6 (A) Comparison of 7SL RNA second read enrichment across viral protein capture datasets (top) with region of highest enrichment for NSP8/9 boxed. Independent expression, purification, and sequencing experiments for NSP8 and NSP9 were performed and are shown. (B) Comparison of 28S RNA enrichment across SARS-CoV-2 Halo capture datasets (top). Replicate representative tracks of NSP8 (blue) and NSP9 (red) on 28S rRNA are presented below. (C) Full view of 80S ribosome structure, interfaced with SRP (7SL RNA, yellow line), NSP9 binding sites on 7SL (red circles), and NSP8 binding sites on 7SL (dark blue circles) and on ES27 expansion segment on the 28S ribosomal RNA (light blue line). (D) Imaging of HEK293T cells transfected with Halo-NSP8 or Halo-NSP9 plasmids. Proteins are visualized using TMR-conjugated Halo-ligand (orange) and counter-stained with DAPI (blue) nuclear stain. Size bars indicate 10 microns. (E) Vero E6 cells were infected (or mock infected) with SARS-CoV-2 at an MOI of 0.1 for 48h, before fixing and staining with an antibody raised against NSP8 or NSP9. Cells are counter-stained with DAPI. Size bars indicate 10 microns. (F) Western blot confirmation of NSP8 and NSP9 antibodies used to generate images in (E). Vero cells were infected (or mock infected) with SARS-CoV-2 at an MOI of 0.1 or 1; 72 hpi cells were lysed and probed by western blot with antibodies raised against NSP8 or NSP9.
Figure S7
Figure S7
NSP8 and NSP9 Inhibit M and Secretory Protein Function, Related to Figure 7 (A) Schematic illustrating Signal Recognition Particle-mediated recognition and translocation of nascent membrane and secreted proteins (left). Upon SRP dysfunction, membrane and secreted proteins are predicted to be mislocalized and degraded (right). (B) Quantification of truncated Nerve Growth Factor Receptor (NGFR) fluorescence normalized to eGFP fluorescence (NGFR:GFP) from HEK293T cells transfected with control EED plasmid together with siRNAs targeting protein components of Signal Recognition Particle, SRP54 and SRP19. (C) Quantification of Membrane SuNSET puromycin staining fluorescence normalized to eGFP fluorescence (Puromycin:GFP) from HEK293T cells transfected with control EED plasmid together with with siRNAs targeting protein components of Signal Recognition Particle, SRP54 and SRP19. Three independent replicates for control and one replicate for siRNA treatments within this experiment. (D) NGFR:GFP ratio from Calu3 human lung epithelial cells infected with SARS-CoV-2 for 24 hr at an MOI of 0.1. Density comparison between Spike positive cells in virally infected condition to Spike negative cells in virally infected condition. (E) Signal P analysis of open reading frames of SARS-CoV-2 expressed proteins utilized in study. Proteins with greater than 0.95 predicted probability indicated Signal P algorithm are highlighted in green. (F) Top: Signal P analysis of open reading frames of various immunoregulatory cytokines and proteins, including Interferon Beta and Beta-2-Microglobulin-Precursor. Bottom: Signal P analysis of NGFR (membrane reporter) amino acid sequence and plot of signal peptide probability along the first 70 amino acids of NGFR sequence. In all panels, error bars represent standard deviation across replicates, and dots represent individual values for each replicate. indicates p < 0.05 and ∗∗p < 0.01. (G) Expression of an interferon stimulated gene reporter upon transfection with GAPDH or NSP8 and NSP9 (in combination), followed by stimulation with IFN-β. We note that because this assay measures intensity across a population of cells, any cells that are not transfected by NSP8/9 would not show this effect and would lead to a smaller overall difference than might occur within individual cells. In contrast, NGFR and SUNSET flow cytometry measurements (B-C) represent analysis of cells expressing NSP8/9.
Figure 7
Figure 7
NSP8 and NSP9 Inhibit Membrane and Secretory Protein Trafficking (A) Quantification of HEK293T cells transfected with plasmids co-expressing GFP-tagged NSPs and the NGFR membrane protein. Plotted is the ratio of NGFR to GFP levels for each condition. (B) The ratio of puromycin-containing proteins at the cell membrane normalized to GFP expression for each condition. (C) Quantification of two mRNA reporters containing SL1 fused to GFP (leader-GFP) or NGFR (leader-NGFR) in Vero cells infected with SARS-CoV-2 or mock infected for 24 h (MOI, 0.1). Plotted is the ratio of leader-NGFR to leader-GFP, binned by increasing amounts of S protein. (D) Density plot for leader-NGFR to leader-GFP ratios in virally infected Vero cells or mock-treated controls. Replicate conditions were merged for display. (E) Model of how NSP8/9 act to suppress SRP-dependent protein trafficking upon viral infection. (F) A model of how SARS-CoV-2 suppresses host immune responses through multi-pronged inhibition of core cellular functions. Cellular mechanisms are shown in gray and viral mechanisms in red. Error bars represent standard deviation across independent biological replicates, and dots represent individual values for each replicate; p < 0.05 and ∗∗p < 0.01.

Similar articles

Cited by

References

    1. Akopian D., Shen K., Zhang X., Shan S.O. Signal recognition particle: an essential protein-targeting machine. Annu. Rev. Biochem. 2013;82:693–721. - PMC - PubMed
    1. Alberti S., Saha S., Woodruff J.B., Franzmann T.M., Wang J., Hyman A.A. A User’s Guide for Phase Separation Assays with Purified Proteins. J. Mol. Biol. 2018;430:4806–4820. - PMC - PubMed
    1. Alexopoulou L., Holt A.C., Medzhitov R., Flavell R.A. Recognition of double-stranded RNA and activation of NF-kappaB by Toll-like receptor 3. Nature. 2001;413:732–738. - PubMed
    1. Ameismeier M., Cheng J., Berninghausen O., Beckmann R. Visualizing late states of human 40S ribosomal subunit maturation. Nature. 2018;558:249–253. - PubMed
    1. Andersen K.G., Rambaut A., Lipkin W.I., Holmes E.C., Garry R.F. The proximal origin of SARS-CoV-2. Nat. Med. 2020;26:450–452. - PMC - PubMed

Publication types

MeSH terms