. 2020 Oct:37:101761.
doi: 10.1016/j.redox.2020.101761. Epub 2020 Oct 14.

Stat2-Drp1 mediated mitochondrial mass increase is necessary for pro-inflammatory differentiation of macrophages

Affiliations

Stat2-Drp1 mediated mitochondrial mass increase is necessary for pro-inflammatory differentiation of macrophages

Weihua Yu et al. Redox Biol. 2020 Oct.

Erratum in

Abstract

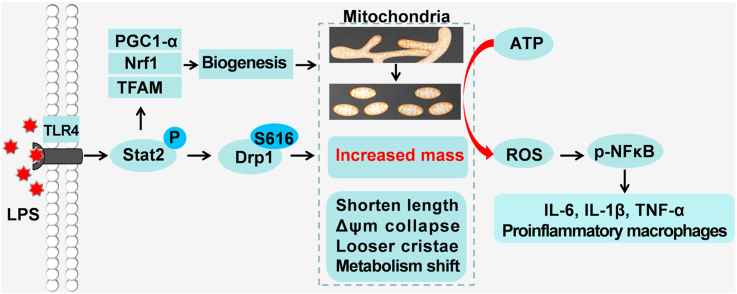
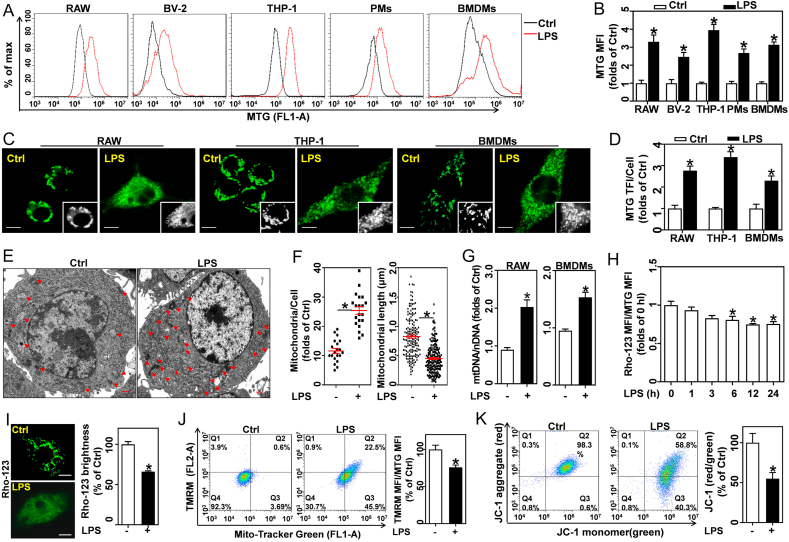
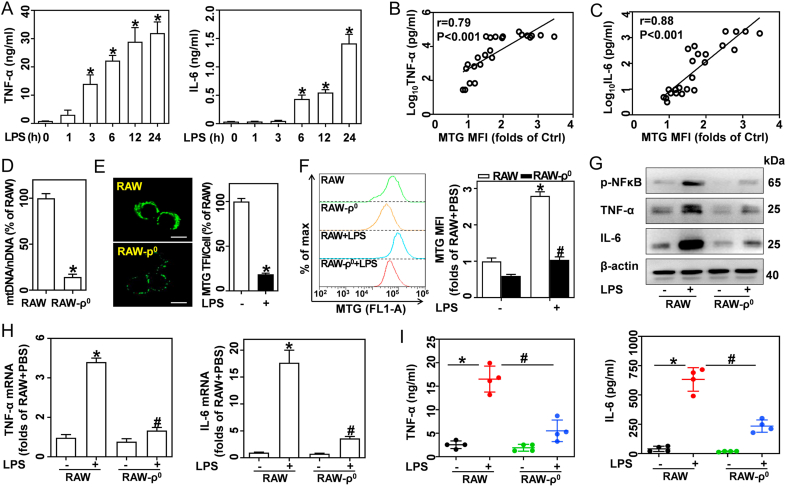
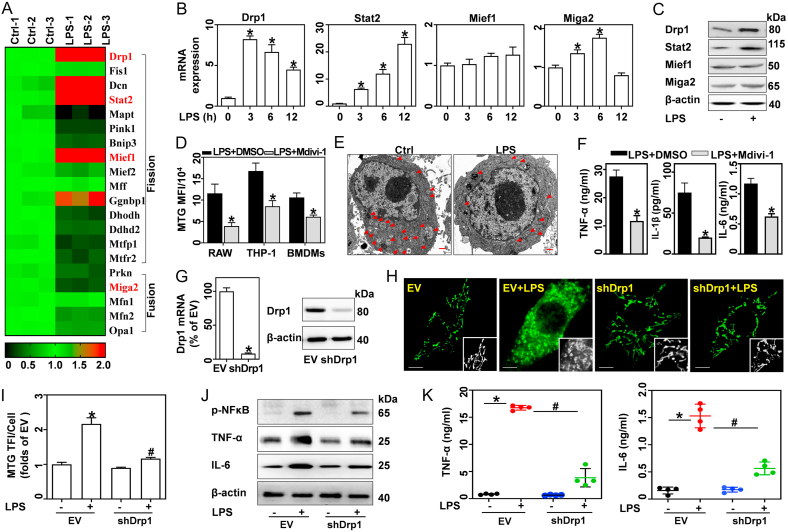
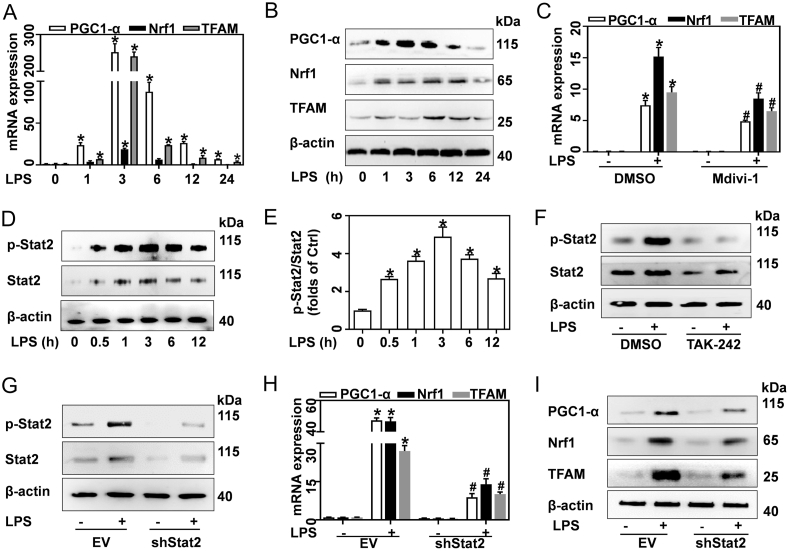
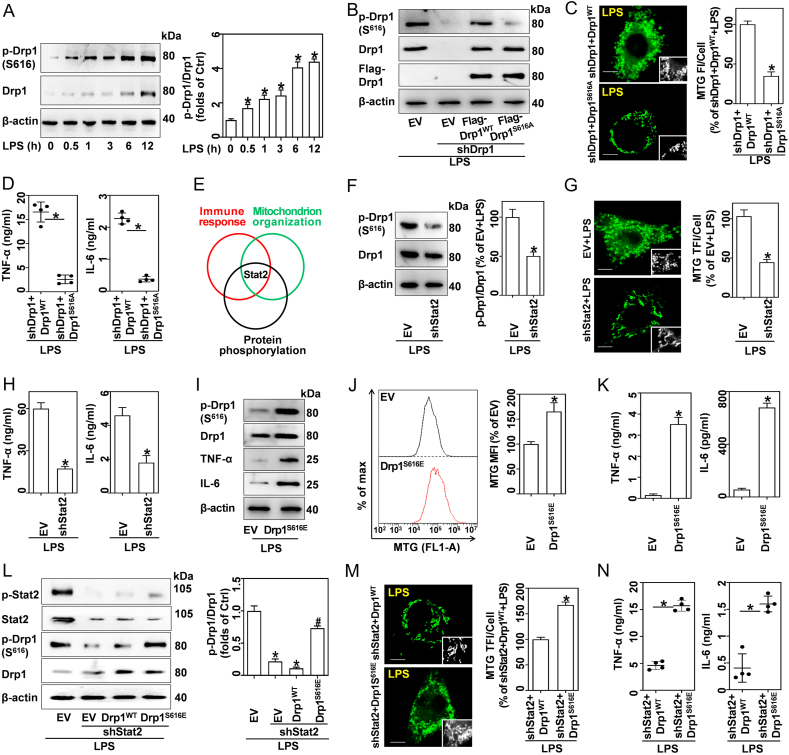
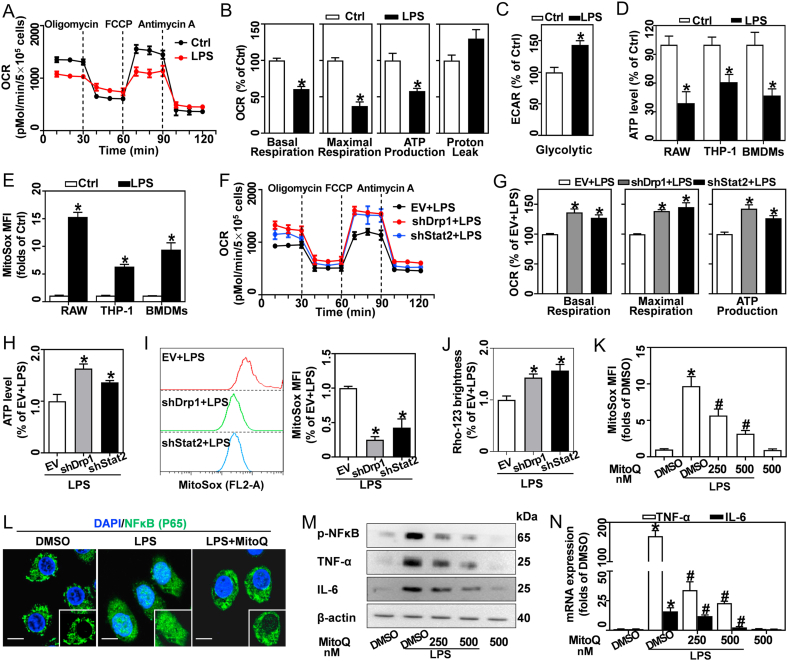
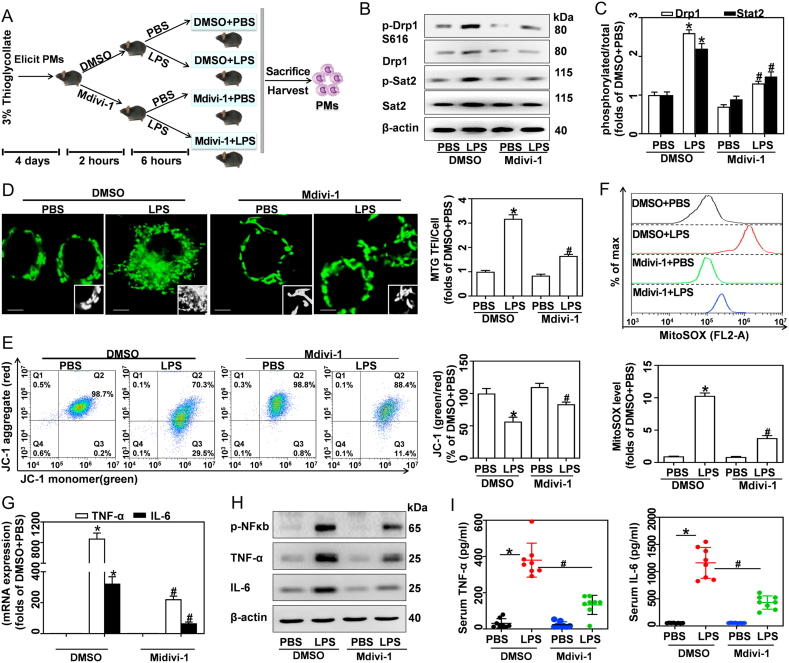
Macrophage recruitment and pro-inflammatory differentiation are hallmarks of various diseases, including infection and sepsis. Although studies suggest that mitochondria may regulate macrophage immune responses, it remains unclear whether mitochondrial mass affects macrophage pro-inflammatory differentiation. Here, we found that lipopolysaccharide (LPS)-activated macrophages possess higher mitochondrial mass than resting cells. Therefore, this study aimed to explore the functional role and molecular mechanisms of increased mitochondrial mass in pro-inflammatory differentiated macrophages. Results show that an increase in the mitochondrial mass of macrophages positively correlates with inflammatory cytokine generation in response to LPS. RNA-seq analysis revealed that LPS promotes signal transducers and activators of transcription 2 (Stat2) and dynamin-related protein 1 (Drp1) expression, which are enriched in positive mitochondrial fission regulation. Meanwhile, knockdown or pharmacological inhibition of Drp1 blunts LPS-induced mitochondrial mass increase and pro-inflammatory differentiation. Moreover, Stat2 boosts Drp1 phosphorylation at serine 616, required for Drp1-mediated mitochondrial fission. LPS also causes Stat2-and Drp1-dependent biogenesis, which contributes to the generation of additional mitochondria. However, these mitochondria are profoundly remodeled, displaying fragmented morphology, loose cristae, reduced Δψm, and metabolic programming. Furthermore, these remodeled mitochondria shift their function from ATP synthesis to reactive oxygen species (ROS) production, which drives NFκB-dependent inflammatory cytokine transcription. Interestingly, an increase in mitochondrial mass with constitutively active phosphomimetic mutant of Drp1 (Drp1S616E) boosted pro-inflammatory response in macrophages without LPS stimulation. In vivo, we also demonstrated that Mdivi-1 administration inhibits LPS-induced macrophage pro-inflammatory differentiation. Importantly, we observed Stat2 phosphorylation and Drp1-dependent mitochondrial mass increase in macrophages isolated from LPS-challenged mice. In conclusion, we comprehensively demonstrate that a Stat2-Drp1 dependent mitochondrial mass increase is necessary for pro-inflammatory differentiation of macrophages. Therefore, targeting the Stat2-Drp1 axis may provide novel therapeutic approaches for treating infection and inflammatory diseases.

Keywords: Drp1; Lipopolysaccharide; Mitochondrial mass; Pro-inflammatory macrophage; Reactive oxygen species; Stat2.


Conflict of interest statement

The authors declare no competing financial interests.

Figures

Image 1
Graphical abstract
Fig. 1
Fig. 1
Pro-inflammatory differentiated macrophages show higher mitochondrial mass and lower Δψm than resting macrophages. RAW, BV-2, THP-1, PMs, and BMDMs were stimulated with 0.5 μg/mL LPS for 12 h. (A) MTG-stained cells were detected by flow cytometry. (B) Calculated MTG MFI, n = 3. (C) MTG-stained RAW, THP-1 and BMDMs were tested by LSCM; scale bars, 5 μm. (D) MTG total fluorescence intensity (TFI) per cell were analyzed, n = 20 cells. (E) Ultrastructural images of mitochondria in BMDMs captured using TEM; scale bars, 500 nm. (F) Calculated mitochondria per cell (left, n = 20 cells) and mitochondrial length (right, 165 mitochondria from 15 Ctrl cells; 203 mitochondria from 8 LPS-treated cells). (G) qRT-PCR measured mtDNA copy number in RAW and BMDMs, and expressed as mtDNA/nDNA ratio, n = 3. (H) Flow cytometry determined Rho-123 MFI/MTG MFI ratio in BMDMs treated with LPS, n = 3. (I) Rho-123 stained BMDMs captured using LSCM; scale bars, 5 μm. Rho-123 brightness was measured, n = 20 cells. (J) BMDMs co-stained with MTG and TMRM analyzed by flow cytometry, and TMRM MFI/MTG MFI ratio, n = 3. (K) JC-1 stained BMDMs analyzed by flow cytometry, and JC-1 red/green ratio, n = 3. Data are expressed as mean ± SEM, *p < 0.05, vs. Ctrl (control cells).
Fig. 2
Fig. 2
Increased mitochondrial mass contributes to inflammatory cytokine release in LPS-activated macrophages. (A–C) Cells were treated with 0.5 μg/mL LPS for indicated time points. (A) TNF-α and IL-6 in BMDM supernatants measured by ELISA, n = 4. The correlations between MTG MFI and log10TNF-α (B) or log10IL-6 (C) were evaluated by Spearman analysis, p < 0.001, n = 24. (D–I) RAW-ρ0 and wildtype RAW cells (RAW) were treated with or without 0.5 μg/mL LPS for 12 h. (D) The mtDNA/nDNA ratio was measured by qRT-PCR, n = 3. (E) MTG-stained cells captured by LSCM; scale bars, 5 μm. MTG TFI per cell was analyzed, n = 20 cells. (F) MTG-stained cells analyzed by flow cytometry, and calculated MTG MFIs, n = 3. (G) Western blotting of p-NF-κB, TNF-α, and IL-6. (H) TNF-α and IL-6 mRNA as analyzed by qRT-PCR, n = 3. (I) TNF-α and IL-6 in supernatants measured by ELISA, n = 4. Data are expressed as mean ± SEM, *p < 0.05 vs. Ctrl (A); *p < 0.05 vs. RAW (D-F, H, I), #p < 0.05 vs. RAW + LPS (F, H, I).
Fig. 3
Fig. 3
Knockdown or inhibition of Drp1 blunts LPS-induced increase in mitochondrial mass and pro-inflammatory cytokine expression. (A–C) BMDMs were treated with 0.5 μg/mL LPS for 12 h or the indicated times. (A) RNA-seq analysis of gene expression profile in Ctrl and LPS-treated BMDMs. (B) qRT-PCR analysis of Drp1, Stat2, Mief1 and Miga2 mRNA expression, n = 3. (C) Proteins of Drp1, Stat2, Mief1, and Miga2 analyzed via western blotting. (D–F) BMDMs, RAW, and THP-1 cells were stimulated with LPS in the presence of DMSO or 50 μM Mdivi-1 for 12 h. (D) MTG-stained cells analyzed by flow cytometry, and calculated MFIs, n = 3. (E) Mitochondrial morphologies in BMDMs detected by TEM; scale bars, 500 nm. (F) TNF-α, IL-6, and IL-1β in supernatants tested by ELISA, n = 4. (G–K) BMDMs transfected with EV and shDrp1 were treated with or without LPS. (G) Drp1 mRNA and protein expressions detected by qRT-PCR and western blotting. (H) Confocal images of MTG-stained cells captured using LSCM, scale bars, 5 μm. (I) MTG TFI per cell, n = 20 cells. (J) p-NFκB, TNF-α, and IL-6 analyzed by western blotting. (K) TNF-α and IL-6 in supernatants analyzed by ELISA, n = 4. Data are expressed as mean ± SEM, *p < 0.05 vs. Ctrl (B); *p < 0.05 vs. LPS + DMSO (D, F); *p < 0.05 vs. EV (G, I, J), #p < 0.05 vs. EV + LPS (I, J).
Fig. 4
Fig. 4
LPS promotes mitochondrial biogenesis in a Drp1-and Stat2-dependent manner. (A–F) BMDMs were treated with 0.5 μg/mL LPS for the indicated times, or for 12 h, in the presence of DMSO, 50 μM Mdivi-1, or 100 nM TAK-242. (A) mRNA and (B) protein of PGC-1α, Nrf1, and TFAM in BMDMs treated with LPS were quantified by qRT-PCR and western blotting, respectively, n = 3. (C) PGC1A Nrf1, and TFAM mRNA in BMDMs treated with LPS and Mdivi-1 measured by qRT-PCR, n = 3. (D) Western blotting analysis of Stat2 and p-Stat2 proteins in BMDMs treated with LPS. (E) Ratio of p-Stat2/Stat2, n = 3. (F) Western blotting analysis of Stat2 and p-Stat2 proteins in BMDMs treated with LPS and TAK-242. (G–I) EV and shDrp1 transfected BMDMs were stimulated with 0.5 μg/mL LPS for 12 h. (G) Western blotting analysis of Stat2 and p-Stat2. (H) mRNA and (I) protein of PGC-1α, Nrf1 and TFAM tested by qRT-PCR and western blotting, respectively, n = 3. Data are expressed as mean ± SEM, *p < 0.05 vs. Ctrl (A, E); *p < 0.05 vs. DMSO + PBS, #p < 0.05 vs. DMSO + LPS (C); *p < 0.05 vs. EV, #p < 0.05 vs. EV + LPS (H).
Fig. 5
Fig. 5
Stat2 phosphorylation of Drp1 at S616 is required for LPS-induced accumulation of mitochondrial mass and inflammatory cytokines. (A) Western blotting analysis of Drp1 and p-Drp1 (S616) in BMDMs stimulated with 0.5 μg/mL LPS for indicated times, and quantified p-Drp1:Drp1 ratios, n = 3. (B–D) RAW cells were engineered to express shDrp1 and rescued with either EV, Flag-Drp1WT or Flag-Drp1S616A, prior to treatment with 0.5 μg/mL LPS for 12 h. Drp1WT, vectors expressing wildtype Drp1; Drp1S616A, vectors encoding a non-phosphorylatable mutant Drp1 at S616. (B) Western blotting analysis of p-Drp1, Drp1, and Flag-Drp1. (C) LSCM analysis of MTG-stained cells; scale bars, 5 μm. MTG TFI per cell was analyzed, n = 20 cells. (D) TNF-α and IL-6 in supernatants were quantified via ELISA, n = 4. (E) GO analysis suggests that Stat2 was enriched in pathways associated with regulation of immune response, mitochondrion organization, and protein phosphorylation. (F–H) BMDMs expressed EV and shStat2 and were treated with 0.5 μg/mL LPS for 12 h. (F) Drp1 and p-Drp1(S616) were analyzed using western blotting, and quantified p-Drp1:Drp1 ratios, n = 3. (G) LSCM analysis of MTG-stained cells; scale bars, 5 μm, and MTG TFI per cell, n = 20 cells. (H) TNF-α and IL-6 in supernatants analyzed by ELISA, n = 4. (I–K) RAW cells expressed EV and Drp1S616E. (I) Western blotting analysis of Drp1, p-Drp1, TNF-α and IL-6. (J) MTG-stained cells analyzed by flow cytometry, and calculated MFIs, n = 3. (K) TNF-α and IL-6 in supernatants analyzed by ELISA, n = 4. (L–N) RAW cells were engineered to encode shStat2 and overexpressed EV, Drp1WT and Drp1S616E (a phosphomimetic mutant), and were then treated with 0.5 μg/mL LPS for 12 h. (L) Western blotting analysis of Stat2, p-Stat2, Drp1 and p-Drp1, and quantified p-Drp1:Drp1 ratios, n = 3. (M) LSCM analysis of MTG-stained cells; scale bars, 5 μm, and MTG TFI per cell, n = 20 cells. (N) TNF-α and IL-6 in supernatants analyzed by ELISA, n = 4. Data are expressed as mean ± SEM, *p < 0.05 vs. Ctrl (A); *p < 0.05 vs. shDrp1+Drp1WT + LPS (C, D); *p < 0.05 vs. EV + LPS (F–H, L); *p < 0.05 vs. EV (J, K); #p < 0.05 vs shStat2+Drp1WT + LPS (L); *p < 0.05 vs. shStat2+Drp1WT + LPS (M, N).
Fig. 6
Fig. 6
Stat2-Drp1 induces mitochondria in LPS-activated macrophages to generate ROS rather than ATP, which then drives inflammation. (A–E) RAW, THP-1, and BMDMs were treated with 0.5 μg/mL LPS for 12 h. (A) Oxygen consumption rate (OCR) in BMDMs tested by Seahorse assay. (B) Quantitative levels of basal respiration, maximal respiration, ATP production, and proton leakage, n = 3. (C) Glycolysis in BMDMs determined from extracellular acidification rate (ECAR) by Seahorse assay, n = 3. (D) ATP levels in LPS-treated RAW, THP-1 and BMDMs measured using a specific ATP Determination kit, n = 3. (E) Mitochondrial ROS in LPS-treated RAW, THP-1, and BMDMs detected using MitoSOX by flow cytometry, n = 3. (F–J) BMDMs expressing EV, shDrp1 or shStat2 were stimulated with 0.5 μg/mL LPS for 12 h. (F) OCR evaluated by Seahorse assay. (G) Basal respiration, maximal respiration, and ATP production quantified, n = 3. (H) ATP levels measured, n = 3. (I) MitoSOX stained cells tested by flow cytometry, and analysis of MFIs, n = 3. (J) LSCM analyzed Rho-123 brightness, n = 20 cells. (K–N) BMDMs stimulated with 0.5 μg/mL LPS for 12 h in the presence of DMSO or MitoQ (250 and 500 nM). (K) MitoSOX stained cells analyzed by flow cytometry, and calculated MFIs, n = 3. (L) NFκB expression (FITC-labeled, green), analyzed by immunofluorescence; DAPI (blue) stains nuclei. (M) Protein bands of p-NFκB, TNF-α, and IL-6 measured by western blotting. (N) TNF-α and IL6 mRNA analyzed by qRT-PCR. Data are expressed as mean ± SEM, *p < 0.05 vs. Ctrl (B–E); *p < 0.05 vs. EV + LPS (G–J); *p < 0.05 vs. DMSO + PBS, #p < 0.05 vs. DMSO + LPS (K, N). (For interpretation of the references to colour in this figure legend, the reader is referred to the Web version of this article.)
Fig. 7
Fig. 7
Inhibition of Drp1 reduces mitochondrial mass and inflammatory cytokines in PMs derived from LPS-challenged mice. (A) 32 C57BL/6 mice were given 3% thioglycolate (i.p.) for 4 days to elicit macrophages. Animals were then injected (i.p.) with DMSO or Mdivi-1 (20 mg/kg) for 2 h, followed by PBS or LPS (15 mg/kg) for 6 h. PMs were isolated after mice were sacrificed. (B) Drp1, p-Drp1, p-Stat2 and Stat2 proteins in PMs analyzed by western blotting. (C) Quantification of p-Drp1:Drp1 and p-Stat2:Stat2 ratios. (D) MTG in PMs measured by LSCM; scale bars, 3 μm. Assessment of MTG TFI per cell, n = 20 cells. (E) JC-1 stained PMs analyzed by flow cytometry, and calculation of the JC-1 red:green ratio, n = 8. (F) MitoSOX stained PMs analyzed using flow cytometry, with calculated MFIs, n = 8. (G) TNF-α and IL6 mRNA in PMs analyzed by qRT-PCR, n = 3. (H) p-NFκB, TNF-α and IL-6 protein expressions analyzed by western blotting. (I) TNF-α and IL-6 in serum measured by ELISA, n = 8. Data are expressed as mean ± SEM, *p < 0.05 vs. DMSO + PBS, #p < 0.05 vs. DMSO + LPS. (For interpretation of the references to colour in this figure legend, the reader is referred to the Web version of this article.)

References

    1. Sica A., Erreni M., Allavena P. Macrophage polarization in pathology. Cell. Mol. Life Sci. 2015;72(21):4111–4126. - PMC - PubMed
    1. Reuter S., Gupta S.C., Chaturvedi M.M. Oxidative stress, inflammation, and cancer: how are they linked? Free Radic. Biol. Med. 2010;49(11):1603–1616. - PMC - PubMed
    1. Bashir S., Sharma Y., Elahi A. Macrophage polarization: the link between inflammation and related diseases. Inflamm. Res. 2016;65(1):1–11. - PubMed
    1. Folmes C.D.L., Dzeja P.P., Nelson T.J. Mitochondria in control of cell fate. Circ. Res. 2012;110(4):526–529. - PMC - PubMed
    1. Weinberg S.E., Sena L.A., Chandel N.S. Mitochondria in the regulation of innate and adaptive immunity. Immunity. 2015;42(3):406–417. - PMC - PubMed

Publication types