. 2020 Oct 18;25(20):4780.
doi: 10.3390/molecules25204780.

Synthesis, In Silico and In Vitro Assessment of New Quinazolinones as Anticancer Agents via Potential AKT Inhibition

Affiliations

Synthesis, In Silico and In Vitro Assessment of New Quinazolinones as Anticancer Agents via Potential AKT Inhibition

Ahmed A Noser et al. Molecules. .

Abstract

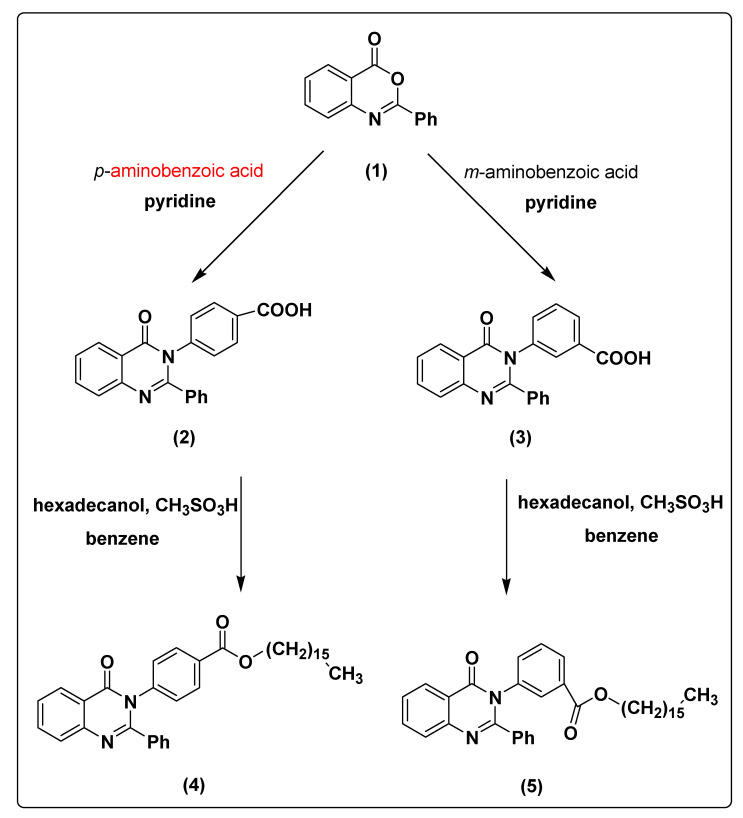
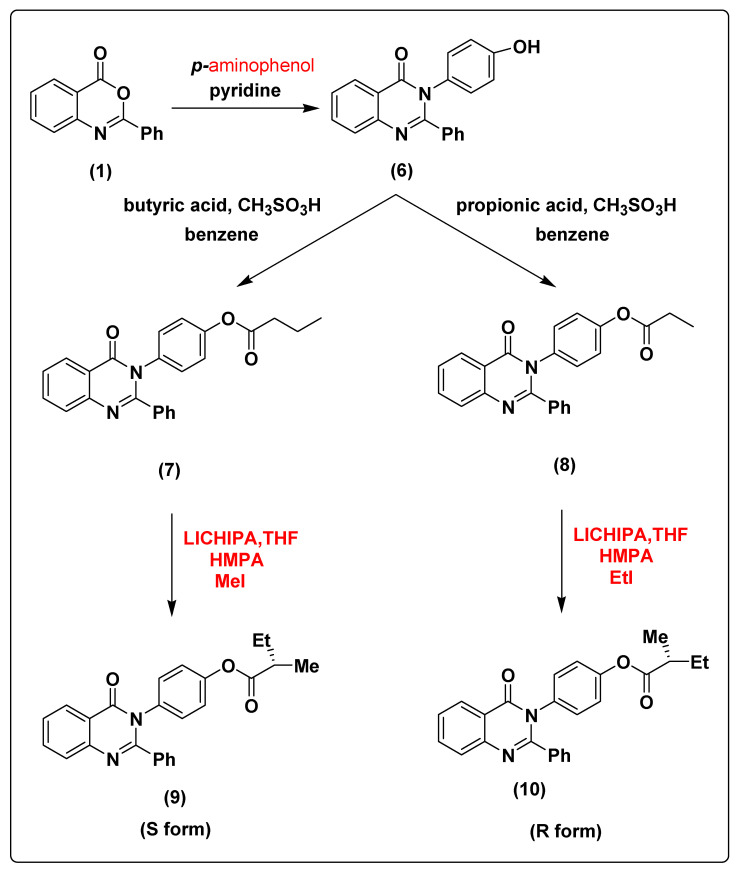
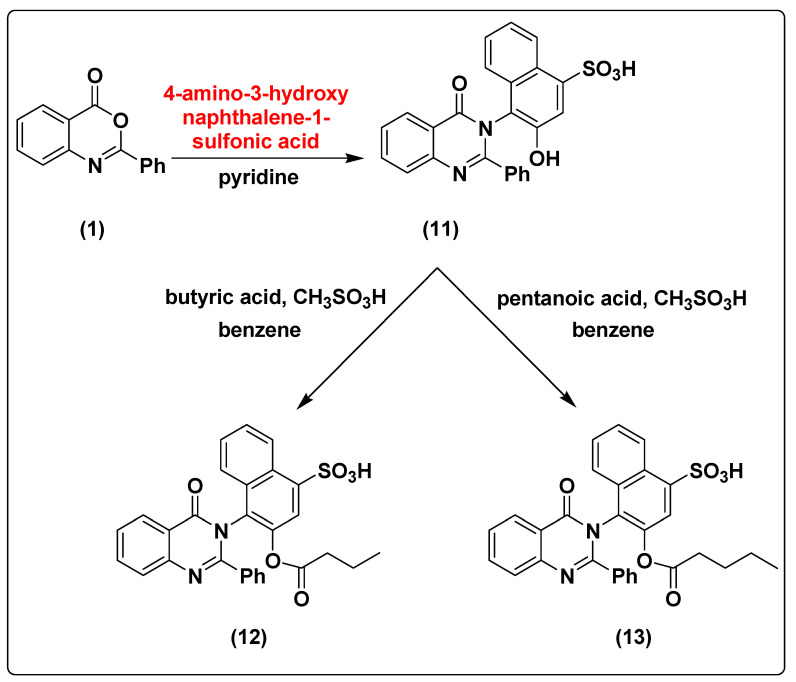
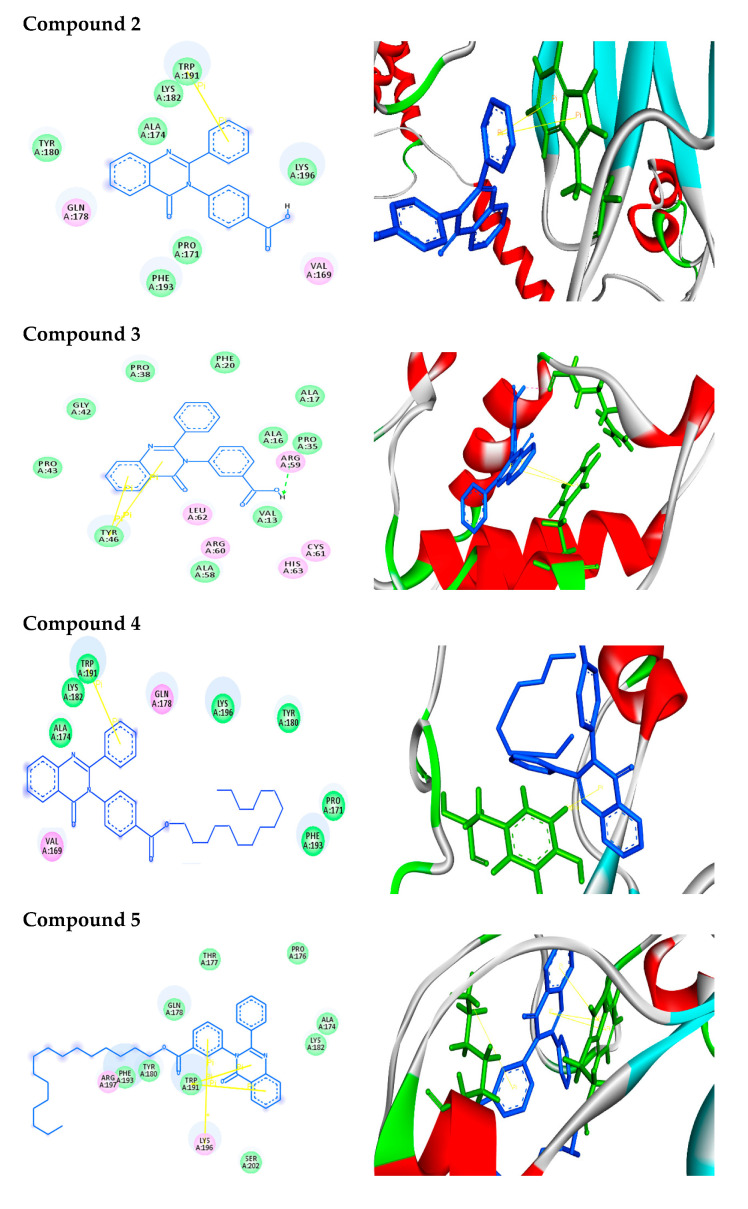
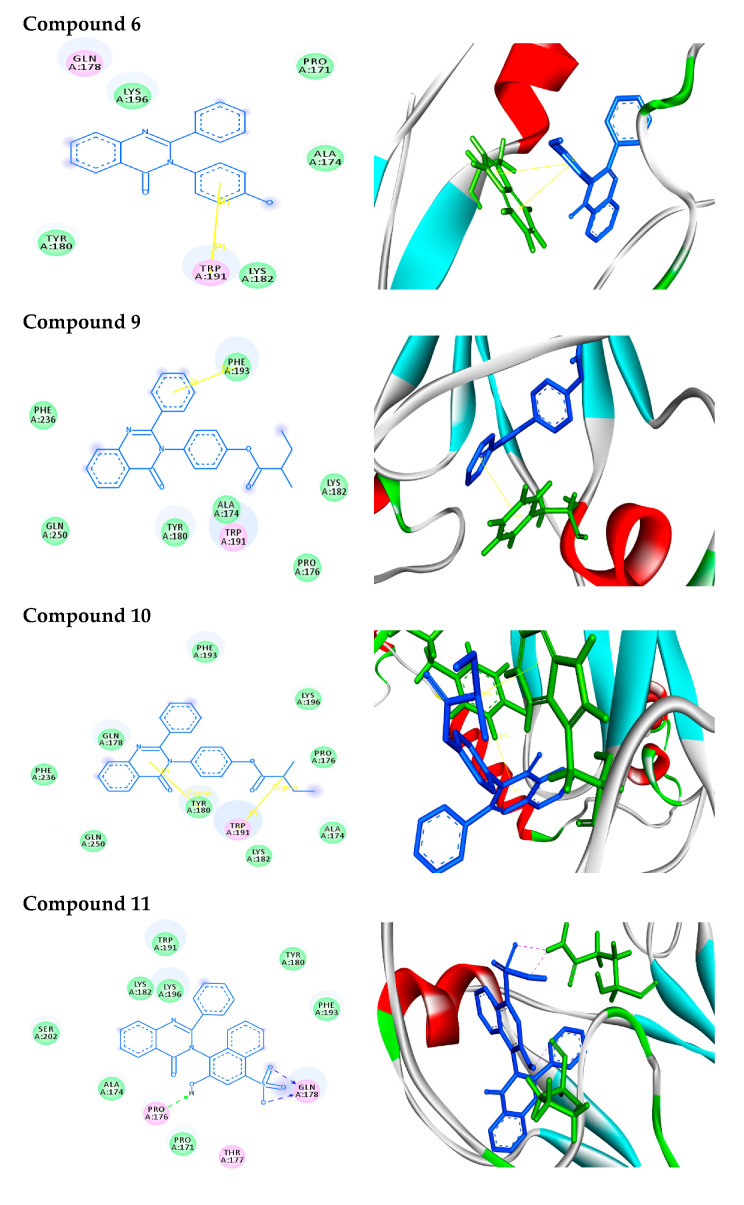
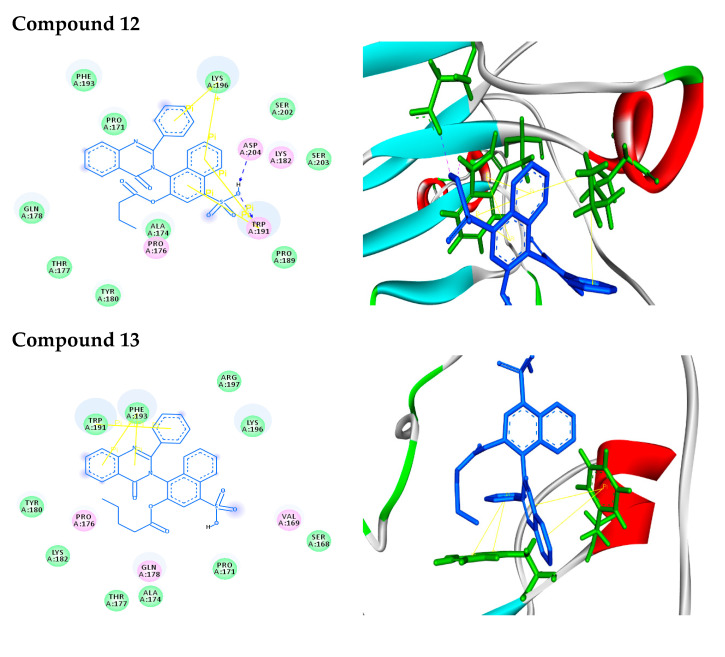
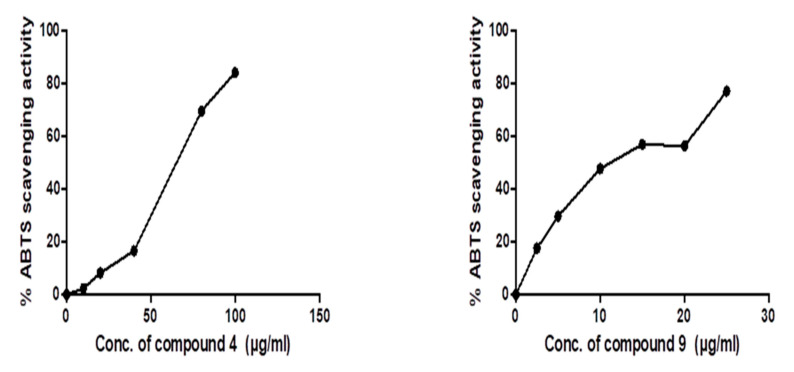
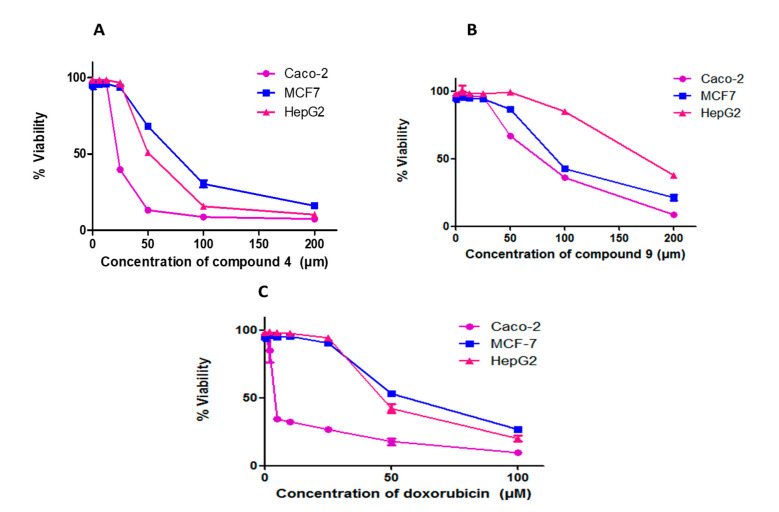
A series of novel quinazolinone derivatives (2-13) was synthesized and examined for their cytotoxicity to HepG2, MCF-7, and Caco-2 in an MTT assay. Among these derivatives, compounds 4 and 9 exhibited significant cytotoxic activity against Caco-2, HepG2, and MCF-7 cancer cells. Compound 4 had more significant inhibitory effects than compound 9 on Caco-2, HepG2, and MCF-7 cell lines, with IC50 values of 23.31 ± 0.09, 53.29 ± 0.25, and 72.22 ± 0.14µM, respectively. The AKT pathway is one of human cancer's most often deregulated signals. AKT is also overexpressed in human cancers such as glioma, lung, breast, ovarian, gastric, and pancreas. A molecular docking study was performed to analyze the inhibitory action of newly synthetic quinazolinone derivatives against Homo sapiens AKT1 protein. Molecular docking simulations were found to be in accordance with in vitro studies, and hence supported the biological activity. The results suggested that compounds 4 and 9 could be used as drug candidates for cancer therapy via its potential inhibition of AKT1 as described by docking study.

Keywords: AKT1; cancer; cytotoxic activity; docking study; quinazolinone.


Conflict of interest statement

The authors declare no conflict of interest.

Figures

Scheme 1
Scheme 1
The synthesis pathway of compounds 2–5 from compound 1.
Scheme 2
Scheme 2
The synthesis pathway of compounds 6–10 from compound 1.
Scheme 3
Scheme 3
The synthesis pathway of compounds 11–13 from compound 1.
Figure 1
Figure 1
Binding modes/interactions of the synthetic compounds with active sites of AKT1 protein. (Left side) 2D representations demonstrating the molecular interactions between compounds and the active site region of AKT1 protein. The amino acid residues are shown in three-letter code, H-bonds are in pink doted lines, and π-interactions are in yellow lines. (Right side) 3D representations demonstrating the molecular interactions between compounds and the active site region of AKT1 protein. The compounds are represented by blue stick models, while the active site regions are shown by green stick models. H-bond contacts are shown in pink dotted lines, while π-stacking is shown in yellow lines.
Figure 1
Figure 1
Binding modes/interactions of the synthetic compounds with active sites of AKT1 protein. (Left side) 2D representations demonstrating the molecular interactions between compounds and the active site region of AKT1 protein. The amino acid residues are shown in three-letter code, H-bonds are in pink doted lines, and π-interactions are in yellow lines. (Right side) 3D representations demonstrating the molecular interactions between compounds and the active site region of AKT1 protein. The compounds are represented by blue stick models, while the active site regions are shown by green stick models. H-bond contacts are shown in pink dotted lines, while π-stacking is shown in yellow lines.
Figure 2
Figure 2
ABTS radical scavenging antioxidant activity of compounds 4 and 9. The IC50 values of each drug are expressed as mean ± SE of three independent experiments performed in triplets calculated and plotted using Graphpad Prism software 6 (San Diego, CA, USA).
Figure 3
Figure 3
Compounds 4 and 9 and doxorubicin inhibit proliferation in different cancer cell lines. Cells were treated with various concentrations of each compound for 48 h and cell viability was plotted against drug concentration to calculate IC50. The IC50 values of each drug are expressed as mean ± SE of three independent experiments performed in triplets calculated and plotted using Graphpad Prism software 6 (San Diego, CA).

References

    1. Nepali K., Sharma S., Sharma M., Bedi P.M.S., Dhar K.L. Rational approaches, design strategies, structure activity relationship and mechanistic insights for anticancer hybrids. Eur. J. Med. Chem. 2014;77:422–487. doi: 10.1016/j.ejmech.2014.03.018. - DOI - PubMed
    1. Popat K., McQueen K., Feeley T.W. The global burden of cancer. Best Pract. Res. Clin. Anaesthesiol. 2013;27:399–408. doi: 10.1016/j.bpa.2013.10.010. - DOI - PubMed
    1. Nussbaumer S., Bonnabry P., Veuthey J.-L., Fleury-Souverain S. Analysis of anticancer drugs: A review. Talanta. 2011;85:2265–2289. doi: 10.1016/j.talanta.2011.08.034. - DOI - PubMed
    1. Holohan C., Van Schaeybroeck S., Longley D.B., Johnston P.G. Cancer drug resistance: An evolving paradigm. Nat. Rev. Cancer. 2013;13:714–726. doi: 10.1038/nrc3599. - DOI - PubMed
    1. Foo J., Michor F. Evolution of acquired resistance to anti-cancer therapy. J. Theor. Biol. 2014;355:10–20. doi: 10.1016/j.jtbi.2014.02.025. - DOI - PMC - PubMed

MeSH terms