. 2020 Oct 18;21(20):7706.
doi: 10.3390/ijms21207706.

High Adenosine Extracellular Levels Induce Glioblastoma Aggressive Traits Modulating the Mesenchymal Stromal Cell Secretome

Affiliations

High Adenosine Extracellular Levels Induce Glioblastoma Aggressive Traits Modulating the Mesenchymal Stromal Cell Secretome

Deborah Pietrobono et al. Int J Mol Sci. .

Abstract

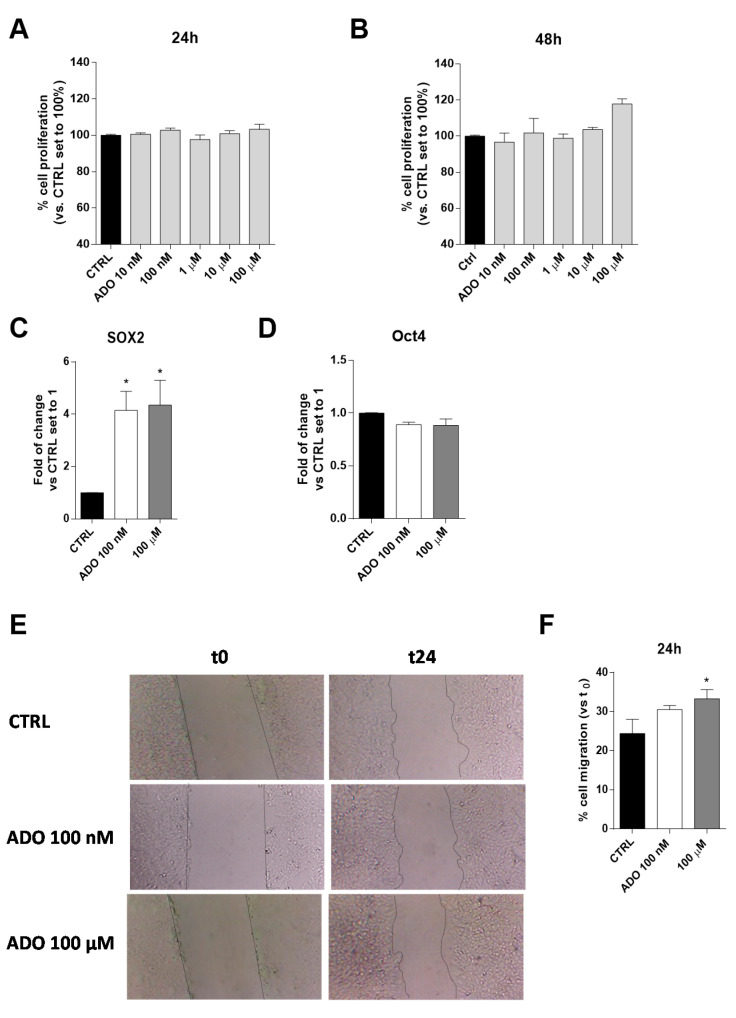
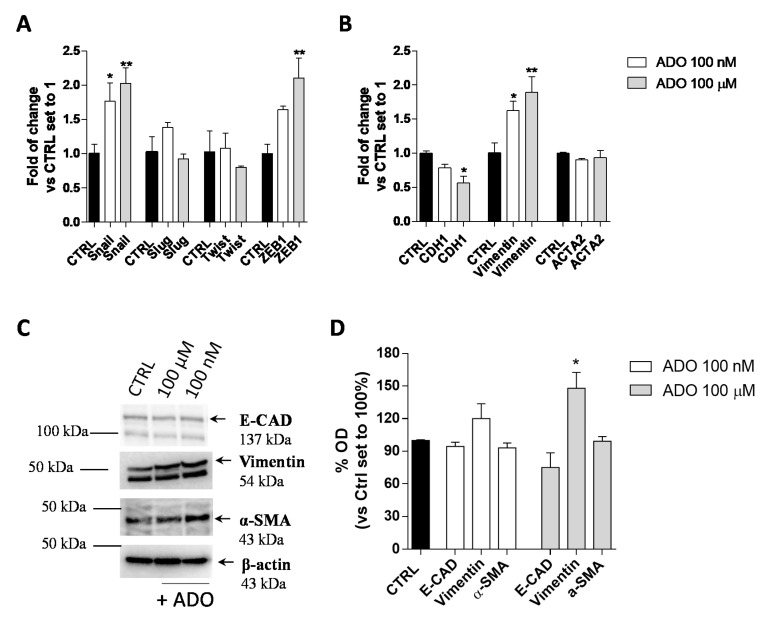
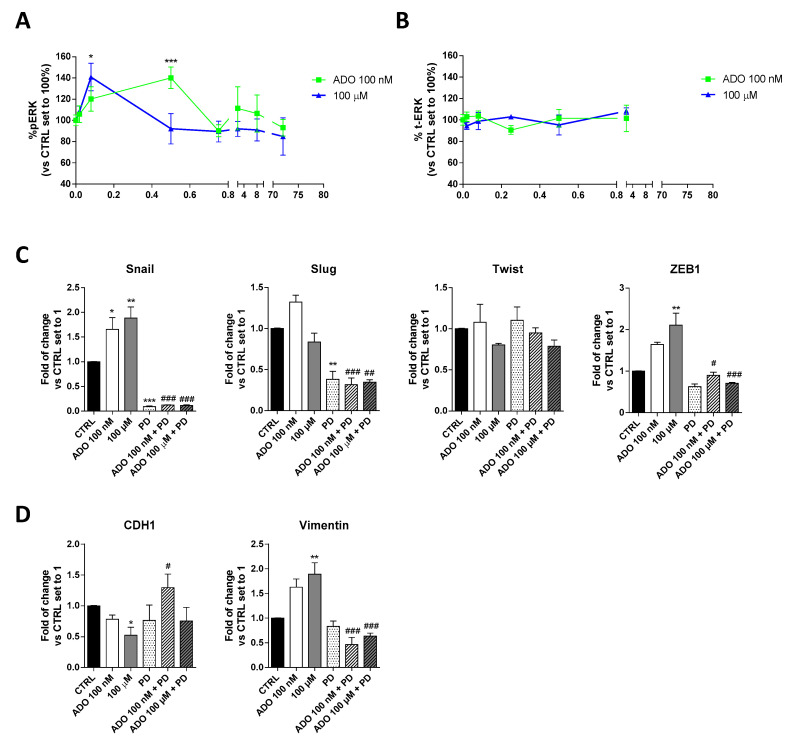
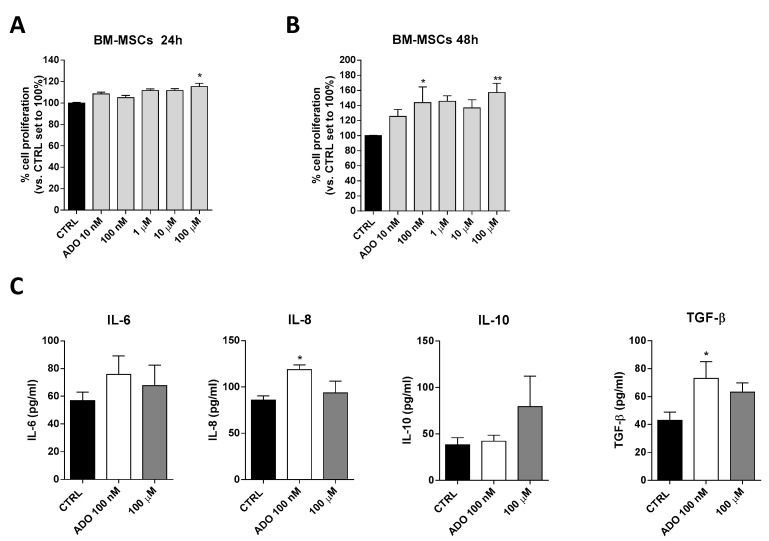
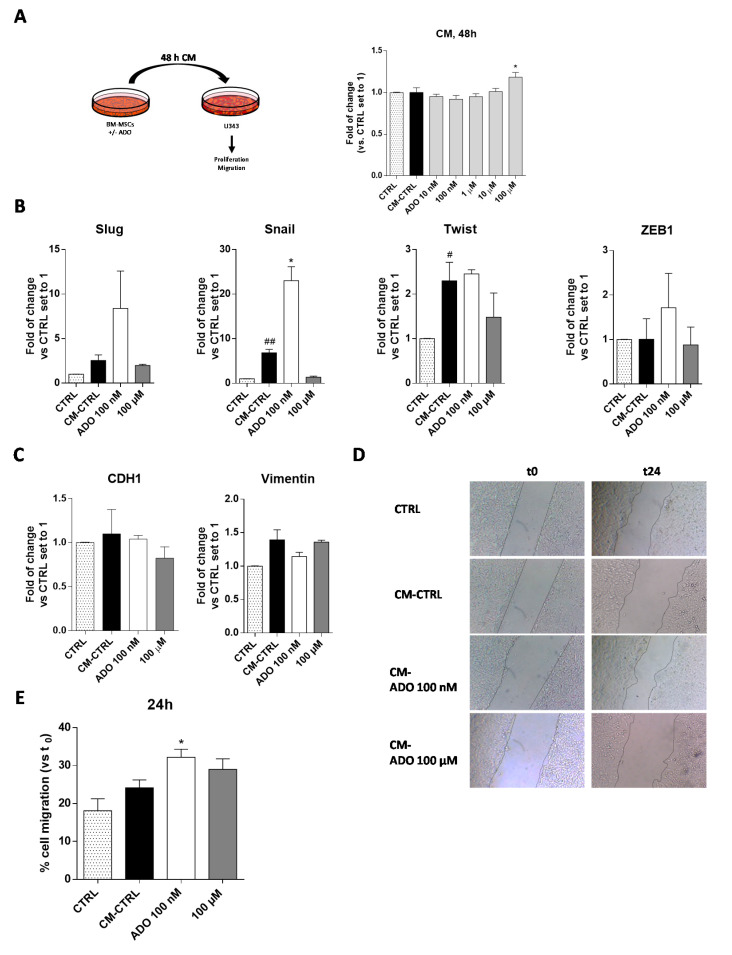
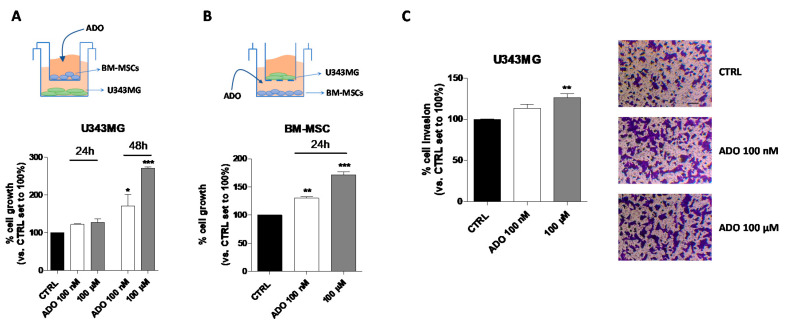
Glioblastoma is an aggressive, fast-growing brain tumor influenced by the composition of the tumor microenvironment (TME) in which mesenchymal stromal cell (MSCs) play a pivotal role. Adenosine (ADO), a purinergic signal molecule, can reach up to high micromolar concentrations in TME. The activity of specific adenosine receptor subtypes on glioma cells has been widely explored, as have the effects of MSCs on tumor progression. However, the effects of high levels of ADO on glioma aggressive traits are still unclear as is its role in cancer cells-MSC cross-talk. Herein, we first studied the role of extracellular Adenosine (ADO) on isolated human U343MG cells as a glioblastoma cellular model, finding that at high concentrations it was able to prompt the gene expression of Snail and ZEB1, which regulate the epithelial-mesenchymal transition (EMT) process, even if a complete transition was not reached. These effects were mediated by the induction of ERK1/2 phosphorylation. Additionally, ADO affected isolated bone marrow derived MSCs (BM-MSCs) by modifying the pattern of secreted inflammatory cytokines. Then, the conditioned medium (CM) of BM-MSCs stimulated with ADO and a co-culture system were used to investigate the role of extracellular ADO in GBM-MSC cross-talk. The CM promoted the increase of glioma motility and induced a partial phenotypic change of glioblastoma cells. These effects were maintained when U343MG cells and BM-MSCs were co-cultured. In conclusion, ADO may affect glioma biology directly and through the modulation of the paracrine factors released by MSCs overall promoting a more aggressive phenotype. These results point out the importance to deeply investigate the role of extracellular soluble factors in the glioma cross-talk with other cell types of the TME to better understand its pathological mechanisms.

Keywords: adenosine; co-culture; glioblastoma; mesenchymal stromal cells; tumor microenvironment.


Conflict of interest statement

The authors declare no conflict of interest.

Figures

Figure 1
Figure 1
Effects of ADO on U343MG cell proliferation, expression of stemness genes and cell motility. (A,B) U343MG cells were treated with different concentrations of ADO (10 nM to 100 µM) for: 24 h (A); or 48 h (B). At the end of the treatment, cell proliferation was evaluated, as described in Section 4.3. The data are expressed as percentages relative to untreated cells (CTRL), which were set at 100% (mean ± SEM; N = 3). (C,D) The total RNA was extracted from U343MG cells after treatment with ADO (100 nM and 100 µM) for 48 h, and the relative mRNA quantification of the markers SOX2 (C) and Oct4 (D) was performed by RT-PCR, as described in Section 4.4. The data are expressed as fold changes with respect to basal value set to 1 (mean values ± SEM, N = 2). (E,F) U343MG cells were treated with ADO (100 nM or 100 µM) and the healing of the wound was evaluated in the scratch assay. (E) Representative images of the scratch wounds at 0 and 24 h. (F) The data are expressed as percentage of gap closure after 24 h of treatment compared to the untreated cells (CTRL), set to 100%. The data are represented as the means ± SEM of at least of three independent experiments. The significance of differences was determined by one-way ANOVA, followed by Bonferroni’s post hoc test: * p < 0.05 vs. CTRL.
Figure 2
Figure 2
ADO modulation of GMT process in glioma cells. U343MG cells were treated with ADO (100 nM or 100 µM) for 72 h. (A,B) The mRNA expression levels of GMT master genes (Slug, Snail, Twist and ZEB1) (A) and the epithelial (CDH1) and mesenchymal (Vimentin and ACTA2) markers (B) were determined by Real-Time RT-PCR. The data are expressed as fold changes with respect to basal value set to 1 and are the mean values ± SEM of two independent experiments. (C,D) U343MG cells were treated as described above and the protein expression of Epithelial (E-CAD) and Mesenchymal markers (Vimentin and α-SMA) were evaluated by Western blotting. (C) One representative blot for each protein is presented and (D) the bar graph shows the densitometric analysis of the Western blot performed using ChemiDocTM XRS+ System (BioRad, Hercules, CA, USA). The data are expressed as the fold change vs. the CTRL levels, which were set to 1 and are the mean values ± SEM of three different experiments. The significance was determined by one-way ANOVA, followed by Bonferroni’s post hoc test: * p < 0.05, ** p < 0.01 vs. CTRL.
Figure 3
Figure 3
Involvement of ERK 1/2 phosphorylation in ADO-mediated induction of GMT traits. (A) Time-course analysis of ERK 1/2 phosphorylation in U343MG cells. U343MG cells were treated with ADO (100 nM and 100 µM) for different time (2 min–72 h), and ERK 1/2 phosphorylation was measured by immuno-enzymatic assay. The data are expressed as the percentage versus untreated cells (CTRL) set to 100% ± SEM of at least three independent experiments performed in duplicate. (B) Time-course analysis of total ERK 1/2 in U343MG cells. (C,D) U343MG cells were treated with ADO (100 nM and 100 µM) in the presence or absence of 1 µM PD184352 for 72 h. mRNA expression levels of GMT master genes (Slug, Snail, Twist and ZEB1) (C) and of the Epithelial (CDH1) and Mesenchymal (Vimentin) markers (D) were determined by RT-PCR. The data are expressed as fold changes with respect to basal value set to 1 and are the mean values ± SEM of two independent experiments. The significance of the differences was determined by one-way ANOVA, followed by Bonferroni’s post hoc test or two-way ANOVA with Bonferroni correction and two-sided tests for multiple comparisons. * p < 0.05, ** p < 0.01, *** p < 0.001 vs. CTRL; # p < 0.05, ## p < 0.01, ### p < 0.001 vs. corresponding ADO treatment.
Figure 4
Figure 4
ADO effects on BM-MSCs proliferation and BM-MSCs cytokines release. (A,B) BM-MSCs were treated with different concentrations of ADO (10 nM to 100 µM) for 24 h (A) or 48 h (B) in complete medium. At the end of the treatment period, cell proliferation was evaluated as described in Section 4.3. The data are expressed as percentage relative to untreated cells (CTRL), which were set at 100% (mean ± SEM; N = 3). (C) BM-MSCs were treated in serum-free medium with ADO (100 nM and 100 µM) for 48 h. At the end of treatment, the IL-6, IL-8, IL-10 and TGF-β levels in the medium were quantified using commercial ELISA kits. The data are reported as the mean values ± SEM of three independent experiments. The significance of the differences was determined by one-way ANOVA, followed by Bonferroni’s post-hoc test: * p < 0.05, ** p < 0.01 vs. the CTRL.
Figure 5
Figure 5
ADO modified the BM-MSC secretome affecting the U343MG proliferation, GMT traits and cell motility. (A) U343MG cells were grown in 80% U343MG culture medium + 20% BM-MSC medium (CTRL), CM obtained from untreated cells (CM-CTRL) or cells treated with ADO for 48 h. At the end of the treatments, cell proliferation was evaluated using the MTS assay. The data are expressed as the percentage versus the CTRL, which was set to 100%, and they are presented as the mean values ± SEM of three independent experiments, each performed in duplicate. (B,C) U343MG cells were treated as described above and, after 72 h of treatment, mRNA expression levels of Slug, Snail, Twist, ZEB1, CDH1 and Vimentin were determined by RT-PCR. The data are expressed as fold changes with respect to untreated cells set to 1 and are the mean values ± SEM of two independent experiments. (D,E) U343MG cells were treated as above, and representative images (D) of the scratch wounds at 0 and 24 h after treatment are reported. (E) The data are expressed as percentage of gap closure after 24 h of treatment compared to the CTRL set to 100%. The data are represented as the means ± SEM of at least two independent experiments performed in triplicate. The significance of the differences was determined by one-way ANOVA, followed by Bonferroni’s post-hoc test: # p < 0.05, ## p < 0.01 vs. CTRL; * p < 0.05 vs. CM-CTRL.
Figure 6
Figure 6
Effects of ADO in the BM-MSC and GBM cell cross-talk. (A) The image depicts the contact-independent transwell cultures with BM-MSCs in the upper chamber and U343MG in the lower chamber. U343MG cell proliferation was evaluated after 24 and 48 h with Crystal violet, as reported in Section 4.9. (B) The image depicts the contact-independent transwell cultures with U343MG in the upper chamber and BM-MSCs in the lower chamber. BM-MSCs cell proliferation was evaluated after 48 h with Crystal violet, as reported in Section 4.9. (C) U343MG cells were seeded in the upper chamber and BM-MSCs treated with ADO (100 nM and 100 µM) in the lower chamber. After 24 h, U343MG cell invasion was analyzed using Matrigel basement membrane transwell system, as described in Section 4.10. Representative images are shown. Cell migration was quantified by counting the number of cells that migrated into the lower surface of the transwell membrane. The data are reported as percentage of cell invasion versus the CTRL set to 100% and are the means ± SEM of three independent experiments. The significance of the differences was determined by one-way ANOVA, followed by Bonferroni’s post-hoc test. * p < 0.05, ** p < 0.01, *** p < 0.001 vs. CTRL.

Similar articles

Cited by

References

    1. Razavi S.M., Lee K.E., Jin B.E., Aujla P.S., Gholamin S., Li G. Immune Evasion Strategies of Glioblastoma. Front. Surg. 2016;3:11. doi: 10.3389/fsurg.2016.00011. - DOI - PMC - PubMed
    1. Schiffer D., Annovazzi L., Casalone C., Corona C., Mellai M. Glioblastoma: Microenvironment and Niche Concept. Cancers. 2019;11:5. doi: 10.3390/cancers11010005. - DOI - PMC - PubMed
    1. Jung Y., Ahn S.H., Park S.H., Choi Y.H. Effect of glucose level on chemical hypoxia-and hydrogen peroxide-induced chemokine expression in human glioblastoma cell lines. Korean J. Physiol. Pharmacol. 2017;21:509–518. doi: 10.4196/kjpp.2017.21.5.509. - DOI - PMC - PubMed
    1. Catalano V., Turdo A., Di Franco S., Dieli F., Todaro M., Stassi G. Tumor and its microenvironment: A synergistic interplay. Semin. Cancer Biol. 2013;23:522–532. doi: 10.1016/j.semcancer.2013.08.007. - DOI - PubMed
    1. Zhang Q., Yi D.Y., Xue B.Z., Wen W.W., Lu Y.P., Abdelmaksou A., Sun M.X., Yuan D.T., Zhao H.Y., Xiong N.X., et al. CD90 determined two subpopulations of glioma-associated mesenchymal stem cells with different roles in tumour progression. Cell Death Dis. 2018;9:1101. doi: 10.1038/s41419-018-1140-6. - DOI - PMC - PubMed

MeSH terms