Horizontal Combination of MEK and PI3K/mTOR Inhibition in BRAF Mutant Tumor Cells with or without Concomitant PI3K Pathway Mutations
- PMID: 33081092
- PMCID: PMC7589607
- DOI: 10.3390/ijms21207649
Horizontal Combination of MEK and PI3K/mTOR Inhibition in BRAF Mutant Tumor Cells with or without Concomitant PI3K Pathway Mutations
Abstract
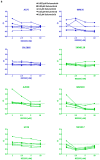
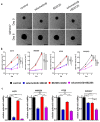
The RAS/RAF and PI3K/Akt pathways play a key regulatory role in cancer and are often hit by oncogenic mutations. Despite molecular targeting, the long-term success of monotherapy is often hampered by de novo or acquired resistance. In the case of concurrent mutations in both pathways, horizontal combination could be a reasonable approach. In our study, we investigated the MEK inhibitor selumetinib and PI3K/mTOR dual inhibitor BEZ235 alone and in combination in BRAF-only mutant and BRAF + PI3K/PTEN double mutant cancer cells using short- and long-term 2D viability assays, spheroid assays, and immunoblots. In the 2D assays, selumetinib was more effective on BRAF-only mutant lines when compared to BRAF + PI3K/PTEN double mutants. Furthermore, combination therapy had an additive effect in most of the lines while synergism was observed in two of the double mutants. Importantly, in the SW1417 BRAF + PI3K double mutant cells, synergism was also confirmed in the spheroid and in the in vivo model. Mechanistically, p-Akt level decreased only in the SW1417 cell line after combination treatment. In conclusion, the presence of concurrent mutations alone did not predict a stronger response to combination treatment. Therefore, additional investigations are warranted to identify predictive factors that can select patients who can benefit from the horizontal combinational inhibition of these two pathways.
Keywords: BEZ235; BRAF; PI3K; PTEN; combination therapy; selumetinib.
Conflict of interest statement
None of the authors has conflict of interest.
Figures


Similar articles
-
Primary cross-resistance to BRAFV600E-, MEK1/2- and PI3K/mTOR-specific inhibitors in BRAF-mutant melanoma cells counteracted by dual pathway blockade.Oncotarget. 2016 Jan 26;7(4):3947-65. doi: 10.18632/oncotarget.6600. Oncotarget. 2016. PMID: 26678033 Free PMC article.
-
Sensitivity to the MEK inhibitor E6201 in melanoma cells is associated with mutant BRAF and wildtype PTEN status.Mol Cancer. 2012 Oct 5;11:75. doi: 10.1186/1476-4598-11-75. Mol Cancer. 2012. PMID: 23039341 Free PMC article.
-
Impact of combined mTOR and MEK inhibition in uveal melanoma is driven by tumor genotype.PLoS One. 2012;7(7):e40439. doi: 10.1371/journal.pone.0040439. Epub 2012 Jul 10. PLoS One. 2012. PMID: 22808163 Free PMC article.
-
Ras/Raf/MEK/ERK and PI3K/PTEN/Akt/mTOR cascade inhibitors: how mutations can result in therapy resistance and how to overcome resistance.Oncotarget. 2012 Oct;3(10):1068-111. doi: 10.18632/oncotarget.659. Oncotarget. 2012. PMID: 23085539 Free PMC article. Review.
-
Therapeutic resistance resulting from mutations in Raf/MEK/ERK and PI3K/PTEN/Akt/mTOR signaling pathways.J Cell Physiol. 2011 Nov;226(11):2762-81. doi: 10.1002/jcp.22647. J Cell Physiol. 2011. PMID: 21302297 Review.
Cited by
-
In Vitro Experiments on the Effects of GP-2250 on BRAF-Mutated Melanoma Cell Lines and Benign Melanocytes.Int J Mol Sci. 2023 Oct 19;24(20):15336. doi: 10.3390/ijms242015336. Int J Mol Sci. 2023. PMID: 37895015 Free PMC article.
-
Targeting the RAS/RAF/MAPK pathway for cancer therapy: from mechanism to clinical studies.Signal Transduct Target Ther. 2023 Dec 18;8(1):455. doi: 10.1038/s41392-023-01705-z. Signal Transduct Target Ther. 2023. PMID: 38105263 Free PMC article. Review.
-
Targeting MAPK in Cancer 2.0.Int J Mol Sci. 2022 May 20;23(10):5702. doi: 10.3390/ijms23105702. Int J Mol Sci. 2022. PMID: 35628511 Free PMC article.
-
Clinical Applications of the Molecular Landscape of Melanoma: Integration of Research into Diagnostic and Therapeutic Strategies.Cancers (Basel). 2025 Apr 24;17(9):1422. doi: 10.3390/cancers17091422. Cancers (Basel). 2025. PMID: 40361349 Free PMC article. Review.
-
Proteomic Changes in the Monolayer and Spheroid Melanoma Cell Models of Acquired Resistance to BRAF and MEK1/2 Inhibitors.ACS Omega. 2022 Jan 18;7(4):3293-3311. doi: 10.1021/acsomega.1c05361. eCollection 2022 Feb 1. ACS Omega. 2022. PMID: 35128241 Free PMC article.
References
-
- Satyamoorthy K., Li G., Gerrero M.R., Brose M.S., Volpe P., Weber B.L., Van Belle P., E Elder D., Herlyn M. Constitutive mitogen-activated protein kinase activation in melanoma is mediated by both BRAF mutations and autocrine growth factor stimulation. Cancer Res. 2003;63:756–759. - PubMed
-
- Steinmetz R., Wagoner H.A., Zeng P., Hammond J.R., Hannon T.S., Meyers J.L., Pescovitz O.H. Mechanisms Regulating the Constitutive Activation of the Extracellular Signal-Regulated Kinase (ERK) Signaling Pathway in Ovarian Cancer and the Effect of Ribonucleic Acid Interference for ERK1/2 on Cancer Cell Proliferation. Mol. Endocrinol. 2004;18:2570–2582. doi: 10.1210/me.2004-0082. - DOI - PubMed
-
- Stemke-Hale K., Gonzalez-Angulo A.M., Lluch A., Neve R.M., Kuo W.-L., Davies M., Carey M., Yinghui G., Guan Y., Sahin A., et al. An Integrative Genomic and Proteomic Analysis of PIK3CA, PTEN, and AKT Mutations in Breast Cancer. Cancer Res. 2008;68:6084–6091. doi: 10.1158/0008-5472.CAN-07-6854. - DOI - PMC - PubMed
MeSH terms
Substances
Grants and funding
LinkOut - more resources
Full Text Sources
Medical
Research Materials
Miscellaneous

