

DAP Kinase-Related Apoptosis-Inducing Protein Kinase 2 (DRAK2) Is a Key Regulator and Molecular Marker in Chronic Lymphocytic Leukemia
- PMID: 33081245
- PMCID: PMC7593912
- DOI: 10.3390/ijms21207663
DAP Kinase-Related Apoptosis-Inducing Protein Kinase 2 (DRAK2) Is a Key Regulator and Molecular Marker in Chronic Lymphocytic Leukemia
Abstract
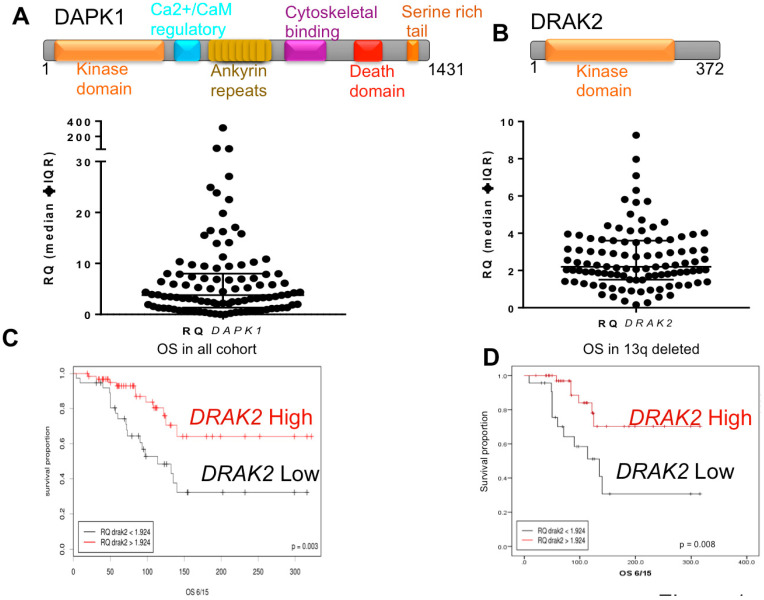
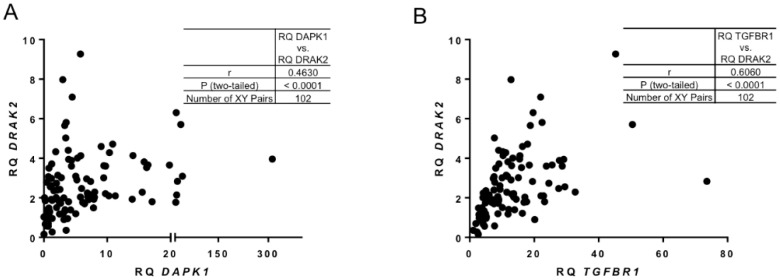
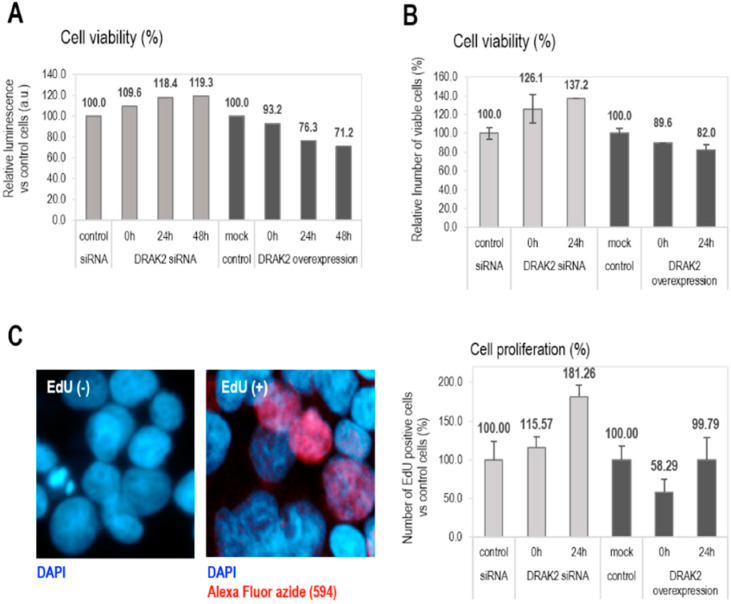
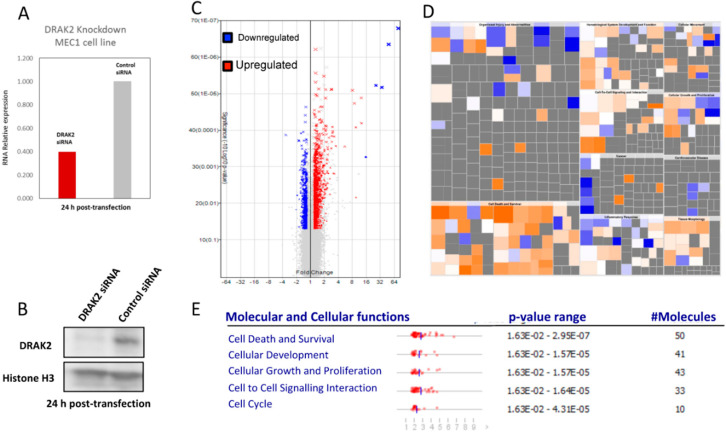
Chronic lymphocytic leukemia (CLL) is the most common adult leukemia in the Western World and it is characterized by a marked degree of clinical heterogeneity. An impaired balance between pro- and anti-apoptotic stimuli determines chemorefractoriness and outcome. The low proliferation rate of CLL cells indicates that one of the primary mechanisms involved in disease development may be an apoptotic failure. Here, we study the clinical and functional significance of DRAK2, a novel stress response kinase that plays a critical role in apoptosis, T-cell biology, and B-cell activation in CLL. We have analyzed CLL patient samples and showed that low expression levels of DRAK2 were significantly associated with unfavorable outcome in our CLL cohort. DRAK2 expression levels showed a positive correlation with the expression of DAPK1, and TGFBR1. Consistent with clinical data, the downregulation of DRAK2 in MEC-1 CLL cells strongly increased cell viability and proliferation. Further, our transcriptome data from MEC-1 cells highlighted MAPK, NF-κB, and Akt and as critical signaling hubs upon DRAK2 knockdown. Taken together, our results indicate DRAK2 as a novel marker of CLL survival that plays key regulatory roles in CLL prognosis.
Keywords: CLL; DAPK1; DRAK2; STK17B; prognostic indicator.
Conflict of interest statement
The authors have no competing interests in relation to the work described. The funders had no role in the design of the study; in the collection, analyses, or interpretation of data; in the writing of the manuscript, or in the decision to publish the results.
Figures
Similar articles
-
Sustained signaling through the B-cell receptor induces Mcl-1 and promotes survival of chronic lymphocytic leukemia B cells.Blood. 2005 Jun 15;105(12):4820-7. doi: 10.1182/blood-2004-07-2669. Epub 2005 Feb 22. Blood. 2005. PMID: 15728130
-
The Akt/Mcl-1 pathway plays a prominent role in mediating antiapoptotic signals downstream of the B-cell receptor in chronic lymphocytic leukemia B cells.Blood. 2008 Jan 15;111(2):846-55. doi: 10.1182/blood-2007-05-089037. Epub 2007 Oct 10. Blood. 2008. PMID: 17928528
-
Sprouty 2: a novel attenuator of B-cell receptor and MAPK-Erk signaling in CLL.Blood. 2016 May 12;127(19):2310-21. doi: 10.1182/blood-2015-09-669317. Epub 2016 Jan 25. Blood. 2016. PMID: 26809508 Free PMC article.
-
Molecular pathogenesis of chronic lymphocytic leukemia.Curr Mol Med. 2006 Sep;6(6):665-75. doi: 10.2174/156652406778195008. Curr Mol Med. 2006. PMID: 17022736 Review.
-
New insights into the characteristics of DRAK2 and its role in apoptosis: From molecular mechanisms to clinically applied potential.Front Pharmacol. 2022 Oct 28;13:1014508. doi: 10.3389/fphar.2022.1014508. eCollection 2022. Front Pharmacol. 2022. PMID: 36386181 Free PMC article. Review.
Cited by
-
Protein Kinases: Function, Substrates, and Implication in Diseases.Int J Mol Sci. 2022 Mar 24;23(7):3560. doi: 10.3390/ijms23073560. Int J Mol Sci. 2022. PMID: 35408921 Free PMC article.
-
Prognostic and immune-related value of STK17B in skin cutaneous melanoma.PLoS One. 2022 Feb 16;17(2):e0263311. doi: 10.1371/journal.pone.0263311. eCollection 2022. PLoS One. 2022. PMID: 35171924 Free PMC article.
-
Evaluation of STK17B as a cancer immunotherapy target utilizing highly potent and selective small molecule inhibitors.Front Immunol. 2024 Oct 21;15:1411395. doi: 10.3389/fimmu.2024.1411395. eCollection 2024. Front Immunol. 2024. PMID: 39502695 Free PMC article.
-
Exosomal miR-133a-3p Derived from BMSCs Alleviates Cerebral Ischemia-Reperfusion Injury via Targeting DAPK2.Int J Nanomedicine. 2023 Jan 5;18:65-78. doi: 10.2147/IJN.S385395. eCollection 2023. Int J Nanomedicine. 2023. PMID: 36636640 Free PMC article.
-
Predictive value of dendritic cell-related genes for prognosis and immunotherapy response in lung adenocarcinoma.Cancer Cell Int. 2025 Jan 14;25(1):13. doi: 10.1186/s12935-025-03642-z. Cancer Cell Int. 2025. PMID: 39810206 Free PMC article.
References
-
- Hermelink H.K., Montserrat E., Catovsky D., Campo E., Harris N.L., Stein H. Chronic Lymphocytic Leukemia/Small Lymphocytic Lymphoma. In: Müller-Swerdlow S.H., Campo E., Harris N.L., Jaffe E.S., Pileri S.A., Stein H., Thiele J., Vardiman J.W., editors. World Health Organization Classification of Tumours, Pathology and Genetics of Tumours of Haematopoietic and Lymphoid Tissues. 4th ed. IARC; Lyon, France: 2008. pp. 180–182.
MeSH terms
Substances
Grants and funding
LinkOut - more resources
Full Text Sources
Molecular Biology Databases
Research Materials
Miscellaneous
