Analysis of Antibiotic Use Patterns and Trends Based on Procurement Data of Healthcare Institutions in Shaanxi Province, Western China, 2015-2018
- PMID: 33081253
- PMCID: PMC7593904
- DOI: 10.3390/ijerph17207536
Analysis of Antibiotic Use Patterns and Trends Based on Procurement Data of Healthcare Institutions in Shaanxi Province, Western China, 2015-2018
Abstract
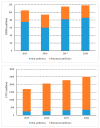
Overuse of antibiotics has caused a series of global problems, especially in the underdeveloped western regions where healthcare systems are fragile. We used antibiotic procurement data of all healthcare institutions to analyze the total amount, patterns and trends of antibiotic use in Shaanxi Province, western China between 2015 and 2018. Antibiotic utilization was quantified using the standard Anatomical Therapeutic Chemical (ATC)/Defined daily dose (DDD) methodology. The World Health Organization's "Access, Watch and Reserve" (AWaRe) classification and European Surveillance of Antimicrobial Consumption (ESAC) drug-specific quality indicators were also adopted to evaluate the appropriateness and quality of antibiotic utilization. Overall, antibiotic consumption decreased from 11.20 DID in 2015 to 10.13 DID (DDDs per 1000 inhabitants per day) in 2016, then increased to 12.99 DID in 2018. The top three antibiotic categories consumed in 2018 were J01C (penicillins) 33.58%, J01D (cephalosporins) 29.76%, and J01F (macrolides) 19.14%. Parenteral antibiotics accounted for 27.41% of the total consumption. The largest proportion of antibiotic use was observed in primary healthcare institutions in rural areas, which accounts for 51.67% of total use. Consumption of the Access group, the Watch group, the Reserve group of antibiotics was 40.31%, 42.28% and 0.11%, respectively. Concurrently, the consumption of J01D and the percentage of J01 (DD + DE) (third and fourth generation cephalosporins) were at a poor level according to the evaluation of ESAC quality indicators. The total antibiotic consumption in Shaanxi Province had been on an upward trend, and the patterns of antibiotic use were not justified enough to conclude that it was rational. This is partly because there was high preference for the third and fourth generation cephalosporins and for the Watch group antibiotics.
Keywords: antibiotic utilization; healthcare institutions; trends and patterns; west China.
Conflict of interest statement
The authors declare no conflict of interest.
Figures


References
-
- O’Neill J. Antimicrobial Resistance: Tackling a Crisis for the Health and Wealth of Nations. [(accessed on 14 April 2020)];2014 Available online: https://amr-review.org/
Publication types
MeSH terms
Substances
LinkOut - more resources
Full Text Sources
Medical
Research Materials

