. 2020 Oct 28;287(1937):20201550.
doi: 10.1098/rspb.2020.1550. Epub 2020 Oct 21.

The biophysical basis of thermal tolerance in fish eggs

Affiliations

The biophysical basis of thermal tolerance in fish eggs

Benjamin T Martin et al. Proc Biol Sci. .

Abstract

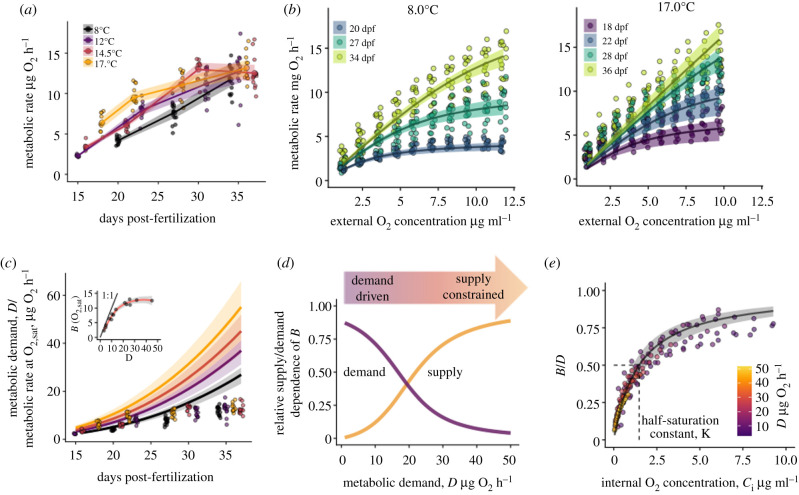
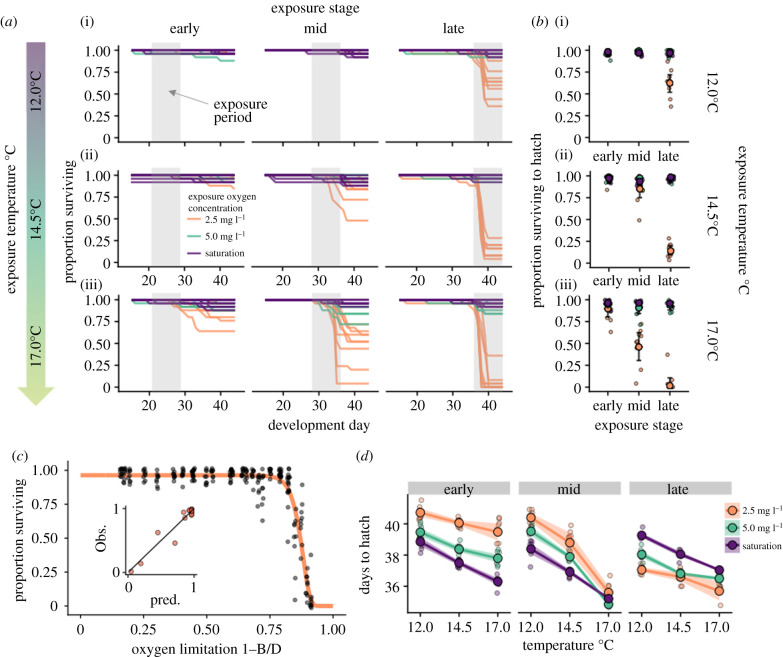
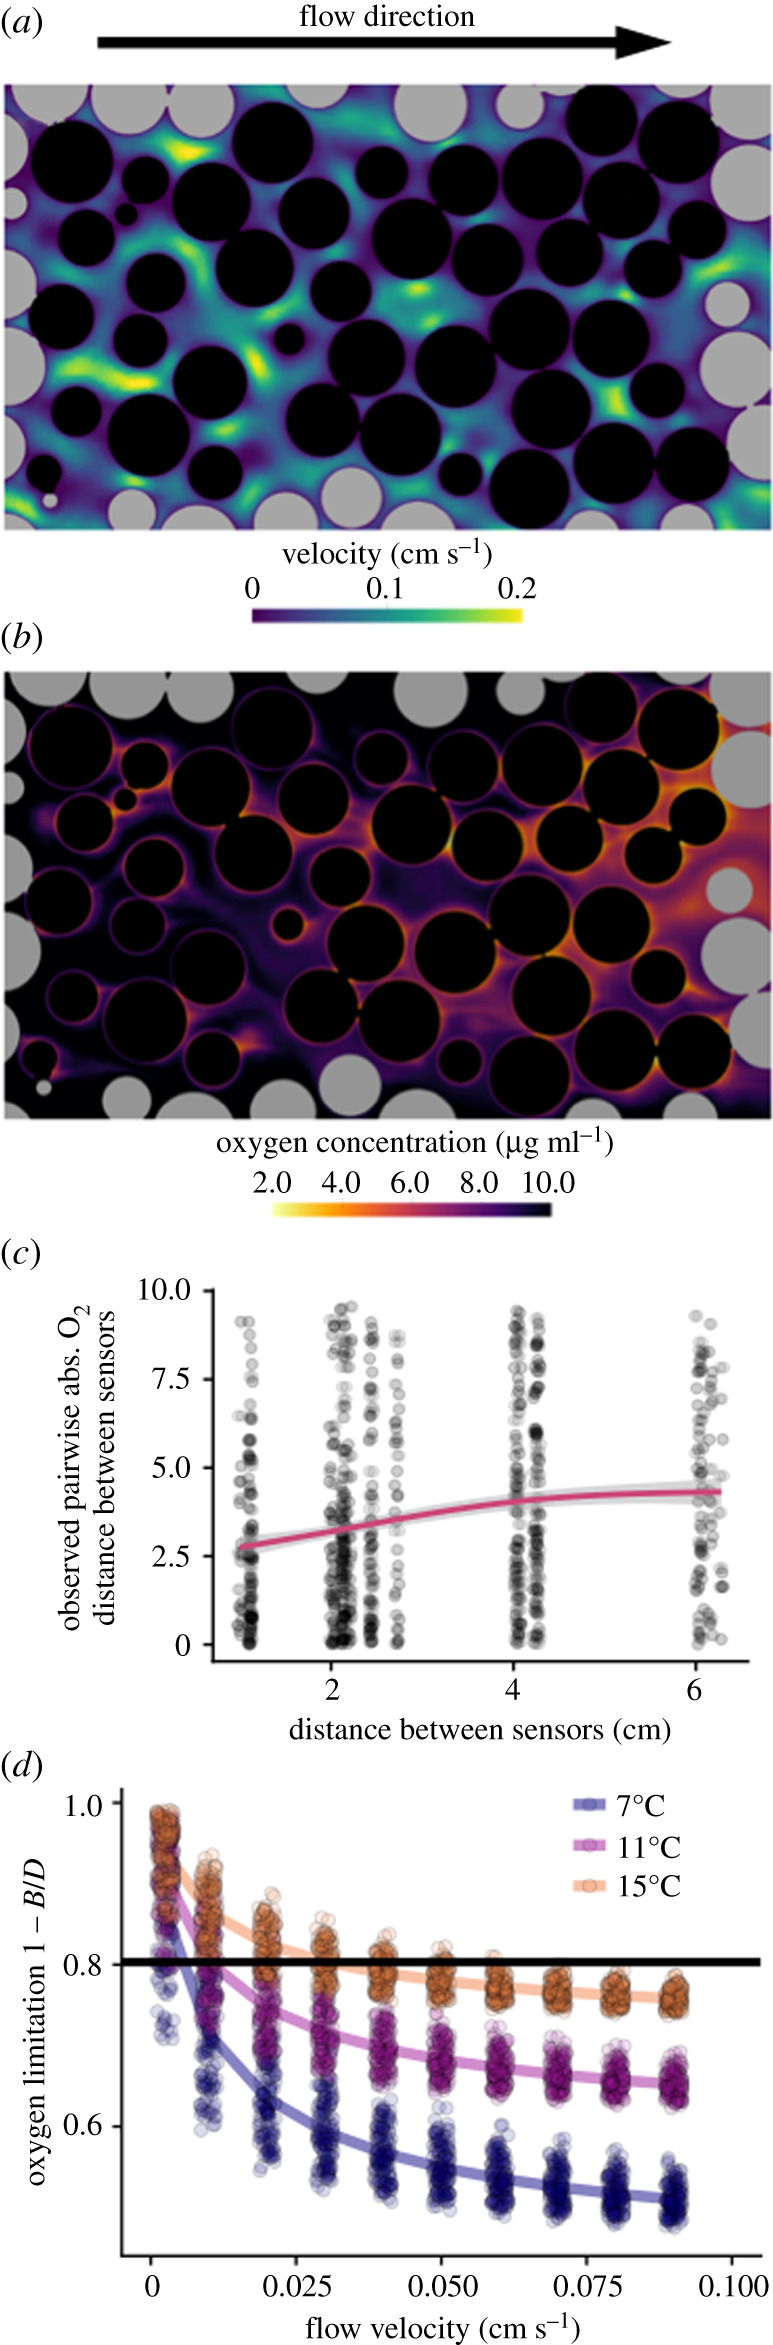
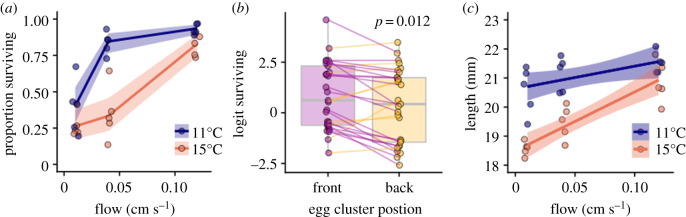
A warming climate poses a fundamental problem for embryos that develop within eggs because their demand for oxygen (O2) increases much more rapidly with temperature than their capacity for supply, which is constrained by diffusion across the egg surface. Thus, as temperatures rise, eggs may experience O2 limitation due to an imbalance between O2 supply and demand. Here, we formulate a mathematical model of O2 limitation and experimentally test whether this mechanism underlies the upper thermal tolerance in large aquatic eggs. Using Chinook salmon (Oncorhynchus tshawytscha) as a model system, we show that the thermal tolerance of eggs varies systematically with features of the organism and environment. Importantly, this variation can be precisely predicted by the degree to which these features shift the balance between O2 supply and demand. Equipped with this mechanistic understanding, we predict and experimentally confirm that the thermal tolerance of these embryos in their natural habitat is substantially lower than expected from laboratory experiments performed under normoxia. More broadly, our biophysical model of O2 limitation provides a mechanistic explanation for the elevated thermal sensitivity of fish embryos relative to other life stages, global patterns in egg size and the extreme fecundity of large teleosts.

Keywords: egg; embryo; metabolic rate; oxygen limitation; temperature; thermal tolerance.


Conflict of interest statement

We declare we have no competing interests.

Figures

Figure 1.
Figure 1.
Measuring and modelling O2 supply and demand in developing salmon embryos (a) Measured metabolic rates of salmon embryos at O2 saturation depended on development stage and temperature: replicate eggs (small circles), treatment means (large circles, lines) and 95% CI (bands). (b) Observed metabolic rates of individual eggs (circles) as a function of O2 in the respirometry chamber at intervals of 10% saturation. The developmental stages of experimental embryos (days post-fertilization) are denoted by colour. Lines represent predictions of the biophysical model (95% CI: bands). The two panels show data from the highest and lowest experimental temperatures; data for all experimental temperatures are shown in electronic supplementary material, figure S1 (c) The estimated metabolic demand, D, of embryos increases rapidly with temperature and development day (lines; bands depict 95% CI), while the observed metabolic rate in normoxia plateaus (points, same data as panel (a). Inset shows the measured realized metabolic at saturated O2 as a function of the estimated demand. Points represent treatment means for each temperature development day combination (n = 15). (d) As the metabolic demand of embryos increases their metabolism switches from being demand driven to supply constrained. Shown is the relative dependence of realized metabolic rate, B, on metabolic demand, D, and supply, Co, as a function of D, in normoxia; 0 and 1 denote complete independence and proportional dependence respectively (see electronic supplementary material, appendix A1 for calculation). (e) Mean observed metabolic rates, B, scaled by D, across all temperatures, development stages and external O2 concentrations (points), collapse to a single Michaelis–Menten relationship a function of the within-egg O2 concentration. Line shows the model-predicted Michaelis–Menten relationship (bands: 95% CI). (Online version in colour.)
Figure 2.
Figure 2.
The balance of O2 supply and demand drives temperature-dependent survival of salmon eggs. (a) Time series of proportion of eggs surviving in nine replicate groups of salmon eggs exposed to one of nine combinations of temperature and dissolved O2 levels for one week at three different developmental stages. Before and after exposure, eggs were reared at 12°C in normoxic conditions. (b) The proportion of eggs surviving to hatch across treatments depended on the interaction among O2, temperature and the developmental stage at exposure. Small circles represent the proportion surviving in individual replicates (nine replicates per treatment, 25 eggs per replicate), large circles and error bars show treatment means and 95% confidence intervals. (c) Variation in survival across all combinations of temperature, O2 and developmental stage at exposure was largely explained by the degree of O2 limitation (1 − B/D), where B is the realized metabolic rate and D is the intrinsic metabolic demand in the absence of O2 limitation. Black circles (n = 243) denote values for replicate experimental units from all 27 treatments, circles are slightly jittered. Fitted line shows predicted survival,S^, where S^=SBeh(Olim), where SB is the background survival probability, and h is the O2 limitation-dependent hazard rate, which was assumed to be h=ec0+c1Olim. Inset shows predicted versus observed mean survival for all 27 treatments. (d) Embryos exposed to hypoxic conditions early in development hatched later than eggs reared in normoxic conditions, while later in development, exposure to hypoxic conditions resulted in early hatching compared to normoxic treatments. (Online version in colour.)
Figure 3.
Figure 3.
Heterogeneous O2 dynamics emerge in egg clusters. (a) Representative cross section of flow velocity from a CFD simulation (flow = 0.04 cm s−1, T = 15°C) mimicking the natural rearing environment of salmon eggs. The black and grey circles are egg and gravel cross-sections, respectively. The random packing configuration of eggs and gravel resulted in highly variable flow conditions within the egg cluster. (b) This variability in flow in turn led to highly variable local O2 conditions, where slow-flowing regions were more heavily depleted of O2. Additionally, O2 was depleted as it flowed from the front to the back of the egg cluster. (c) Measured O2 concentrations within experimental egg clusters were highly variable even at spatial scales as small as 1 cm. Shown are absolute differences in O2 concentrations between paired O2 probes within the same egg pocket as a function of the distance between probes. (d) The degree of O2 limitation for eggs within the cluster in the CFD model depended on flow and temperature. Each point represents one egg within the cluster, lines show the mean O2 limitation of eggs within a treatment. The black horizontal line represents a critical O2 limitation, above which mortality increases rapidly with further O2 limitation (figure 2c). (Online version in colour.)
Figure 4.
Figure 4.
Thermal tolerance in egg clusters. (a) The thermal tolerance of salmon embryos developing in conditions matching their natural habitat—clusters of 200 eggs buried in gravel PVC pipes—was substantially reduced at flow velocities typically observed in natural redds (less than 0.1 cm s−1 [–15]). Shown are the proportion of surviving Chinook embryos reared from fertilization to hatch in five replicate experimental units as a function of experimental temperature and flow velocity. Lines and bands denote the means and 95% CI at each of the 6 treatments. (b) Within experimental replicates, survival was lower in the downstream or back half of the egg cluster, likely due to O2 depletion as water flows through the egg cluster (figure 3b). Paired points represent logit-transformed proportion survival in each experimental replicate. (c) Flow and temperature conditions in this experiment also affected the mean size at hatch, with embryos hatching at smaller sizes in warmer slower flowing water. (Online version in colour.)

References

    1. Pörtner HO, Bock C, Mark FC. 2017. Oxygen-and capacity-limited thermal tolerance: bridging ecology and physiology. J. Exp. Biol. 220, 2685–2696. (10.1242/jeb.134585) - DOI - PubMed
    1. McCullough DA.1999. A review and synthesis of effects of alterations to the water temperature regime on freshwater life stages of salmonids, with special reference to Chinook salmon. Seattle, WA: US Environmental Protection Agency.
    1. Eliason EJ, Clark TD, Hague MJ, Hanson LM, Gallagher ZS, Jeffries KM, Farrell AP. 2011. Differences in thermal tolerance among sockeye salmon populations. Science 332, 109–112. (10.1126/science.1199158) - DOI - PubMed
    1. Whitney CK, Hinch SG, Patterson DA. 2013. Provenance matters: thermal reaction norms for embryo survival among sockeye salmon Oncorhynchus nerka populations. J. Fish Biol. 82, 1159–1176. (10.1111/jfb.12055) - DOI - PubMed
    1. Dahlke FT, Wohlrab S, Butzin M, Pörtner HO. 2020. Thermal bottlenecks in the life cycle define climate vulnerability of fish. Science 369, 65–70. (10.1126/science.aaz3658) - DOI - PubMed

Publication types